ThreePointsChannel
- 指标
- 版本: 1.5
- 更新: 8 十二月 2018
- 激活: 10
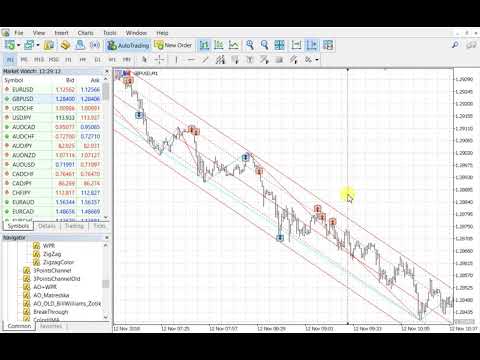
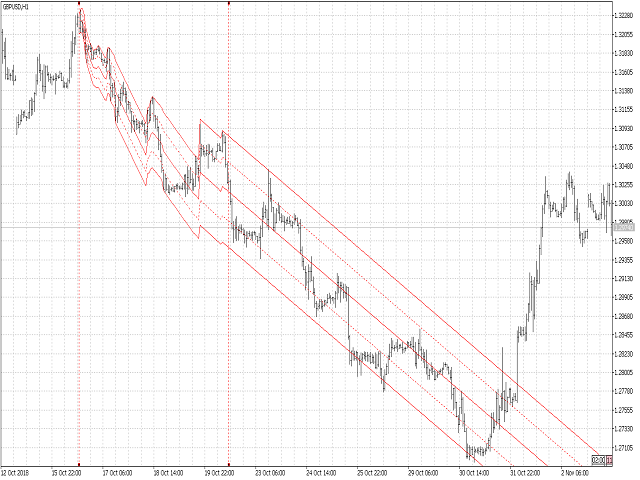
The principle of construction - on top of any number of bars set by the user, a channel is constructed with maximum and minimum lines so that the bars touch the maximum and minimum of the channel at exactly three points. The name of the indicator follows from this principle. Both vertical lines can be moved along the graph by the user, thus specifying the period on which the channel is built. After a specified period, channel rays are drawn that define a channel in which the price can move.
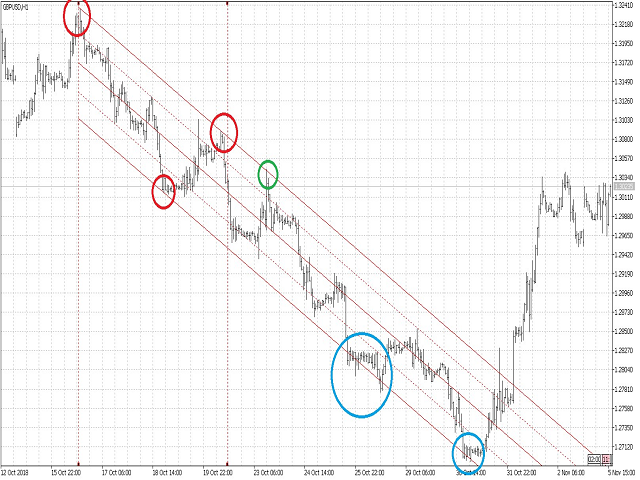
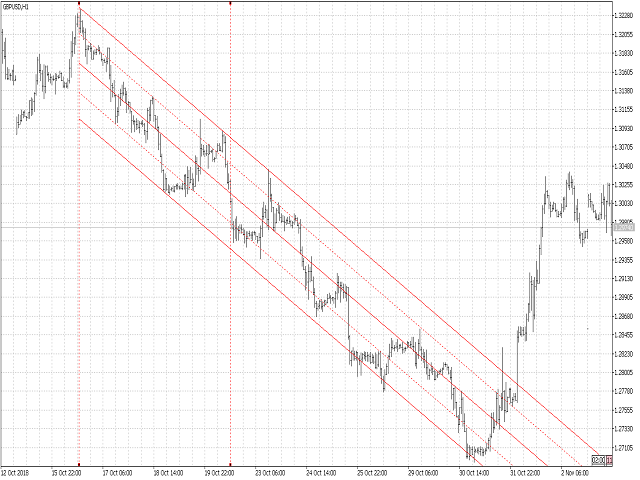
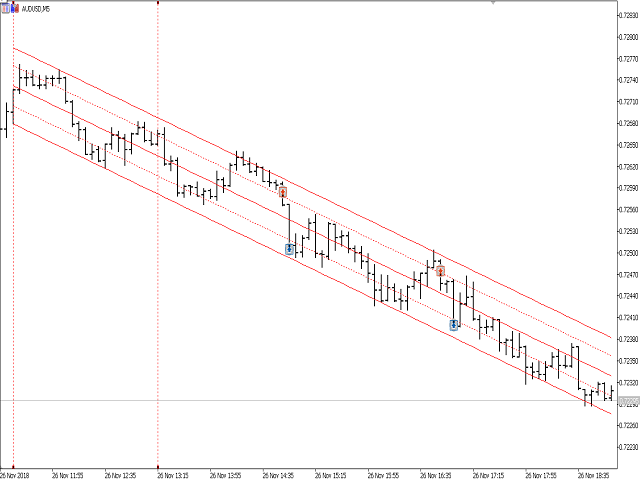
In the picture, the ThreePointsChannel channel is built on top of the bars between two vertical dashed lines. The three points along which the channel is built are marked with red circles. In the period between the two lines, the channel may redraw. The indicator has a parameter that prohibits redrawing. The right vertical dotted line shows a bar, after which the channel does not redraw. On the picture the green circle marks the moment when the price was in the overbought zone, a moment suitable for opening positions down. Blue circles mark the oversold zone, a moment suitable for closing positions down. The parallel lines inside the channel are the channel levels. By default, the Indicator takes the distance between the two main lines of the channel for 100% and draws lines of 23.6% (dotted line), 50% and 76.4% (dotted line) inside the channel. The percentage that the indicator uses to draw the channel is determined by the indicator parameter.
Indicator parameters:
Redraw - allows redrawing of the channel in the interval between two vertical lines, set by the user.
Coeff - determines the distance of the overbought and oversold channel as a percentage of the channel boundaries, is drawn with a dotted line.
Color - the parameter sets the color of all lines.
InputBar - sets the bar of the right vertical line on which the indicator will be initialized
Length - the distance between the left and right vertical line in bars.
The InputBar and Length parameters are responsible for the period in which the channel is initialized. After initialization, the user can move both vertical lines to adjust the period on which the channel is built.
Version 1.1 - Added channel angle calculation
Version 1.2 - Moved Angle text to first vertical line
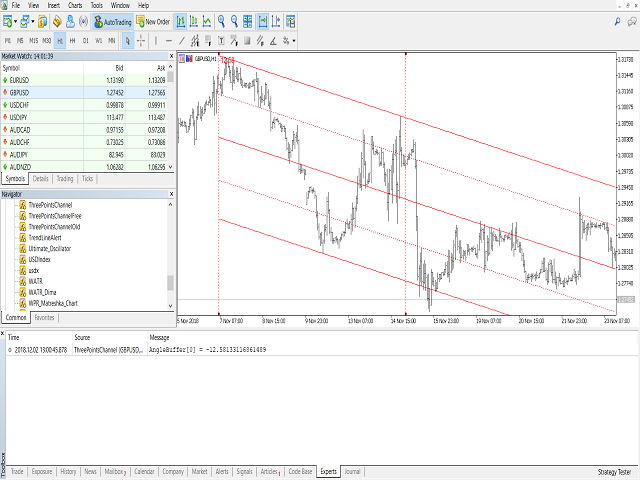
Version 1.3 - Added indicator buffer for Angle value - indicator buffer index 5, array index 0
Version 1.4 - Resolved deinit issue
In test mode, moving vertical lines is not possible due to the built-in limitations of the MetaTrader platform.


thank you Dimitr for brilliant job , hope to continue updating this for future . thanks