Dashboard Super Currency Strength MT5

如果产品有任何问题或者您需要在此产品上添加功能,请联系我

Contact/message me if you encounter any issue using the product or need extra feature to add on the base version.


There is Demo version of this panel Dashboard Timeframe 15 Demo in my product list, please try it out to get familiar with all functionalities free, LINK.

This system basically utilizes TDI as the core indicator to generate trading signal mainly on time-frame M15. The signal will be further filtered and trimmed by 1) 200 EMA and Price; 2) 10 EMA and Heiken Ashi Candle; 3) Round number.

To facilitate you to understand and trade this system quickly and effectively, the collection of PDF manual and all indicators are provided in my first comment of this product.

For who cannot access Google Drive, please find these resources in the thread or PM me.

  • PDF Manual
  • Two Indicators: place them under /MQL4/Indicators/

Dashboard Timeframe 15 is an intuitive and handy graphic tool to help you to:

  • Have 28 pairs under control with one dashboard.
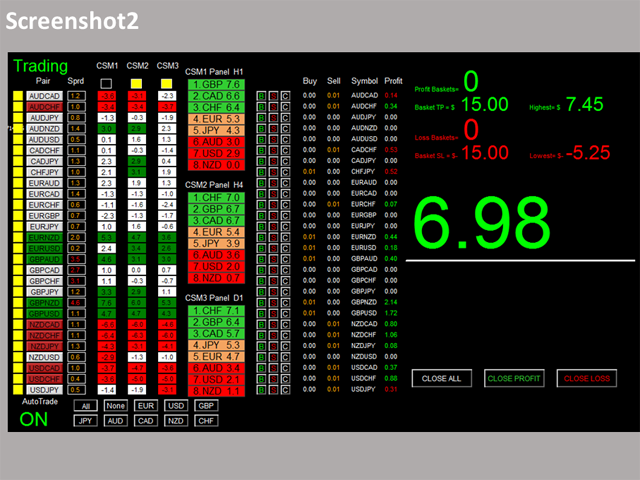
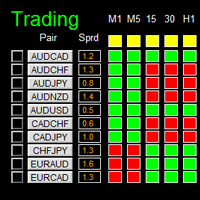
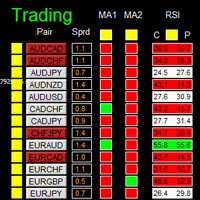
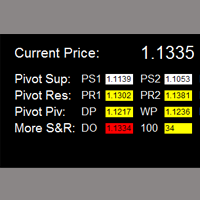
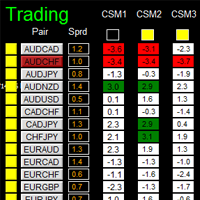
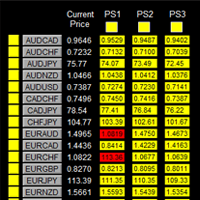
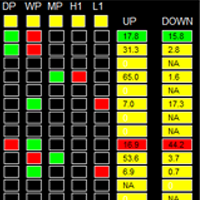
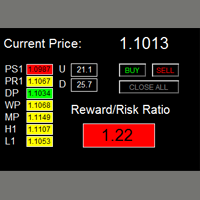
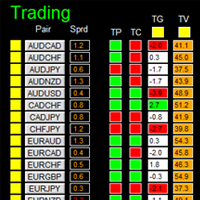
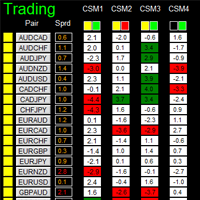
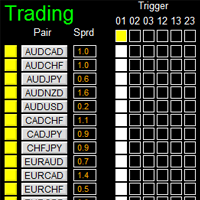
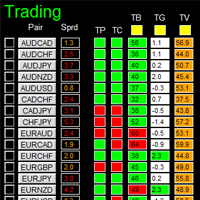
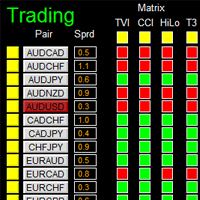
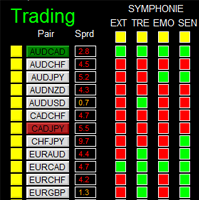
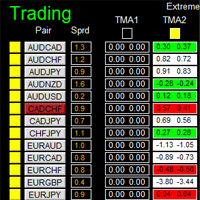
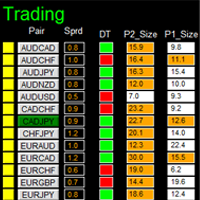
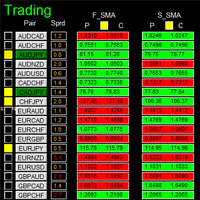
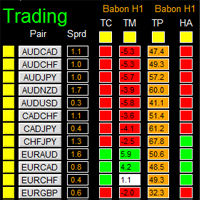
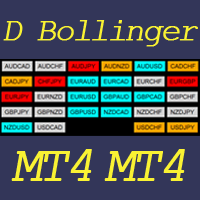
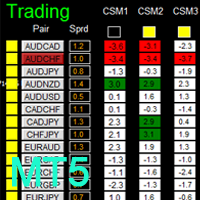
  • Monitor all 28 pairs and provide trading signals based on the Timeframe15 system rules (see screenshot 1, 2, 3, and 4).
  • Manage order automatically once signal are generated.
  • Monitor your positions easily with one glance to know status of all trading pairs.


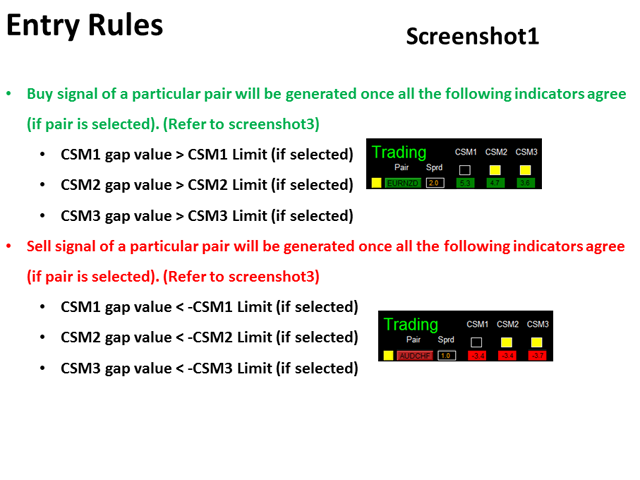
Entry Rules

Refer to screenshot 1, 2, 3, and 4

Make sure completing the following action items to make this dashboard working.


Important Action Items before Using Dashboard

  1. Download historical data of all 28 pairs. Use this free tool to download historical data by simple one-drag, link.
  2. Make sure you have all 28 symbols in Symbol window.
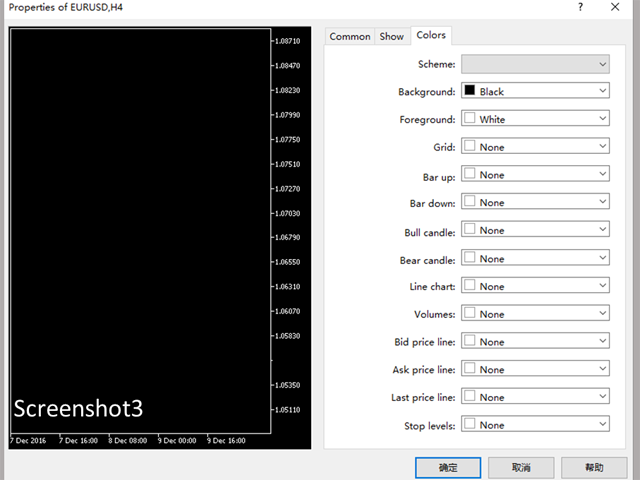
  3. To make your dashboard looks clear and neat, it’s better to apply the black template. Please refer to screenshot 6.


Input Parameters

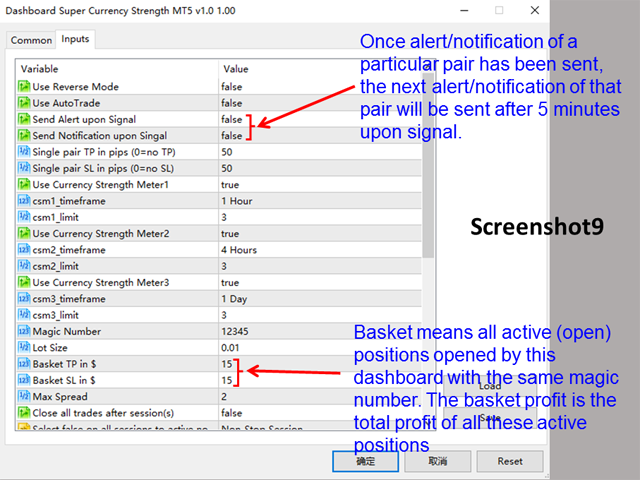
  • Use AutoTrade
  • Send Alert upon Signal (Refer to entry rule)
  • Send Notification upon Signal (Refer to entry rule)
  • Single pair TakeProfit in pips
  • Single pair StopLoss in pips
  • Use TDI Base Line
  • Use TDI Momentum Indi
  • TDI Momentum TH
  • Use TDI over bought/sell Limit
    • TDI overbought limit
    • TDI oversold limit
  • 200 EMA Period
  • 10 EMA Period
  • Use Round Number
    • Round Number Limit
  • Magic Number
  • Lot Size:
  • Basket TakeProfit in $:(see explanation in Note1)
  • Basket StopLoss in $
  • Max Spread
  • Trading Session, if time is out of session, no order will be sent
    • Close all trades after session(s)
  • Note that: starting and ending time is your computer/local time, not server time
  • Session Input, pls refer to other dashboard product description (Dashboard Super Currency Strength)
  • Time-frame of new chart
  • Suffix
  • X_axis
  • Y_axis


Dashboard Objects

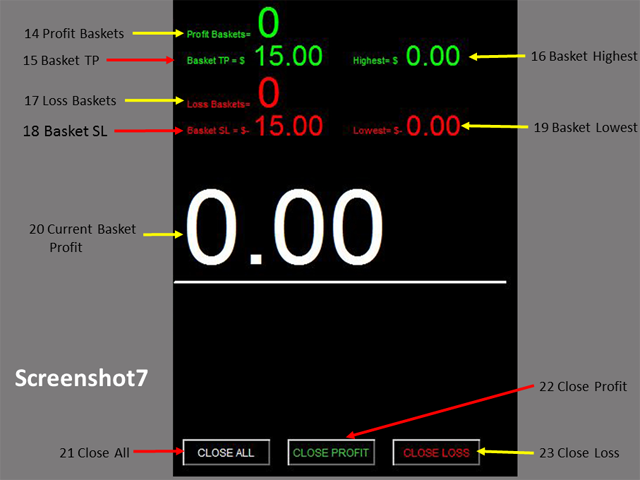
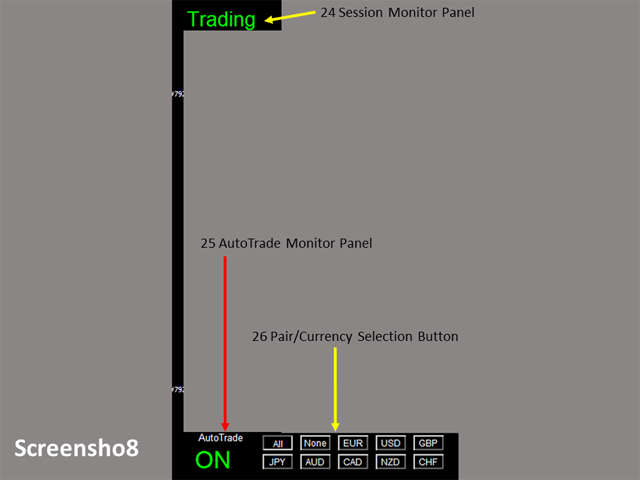
Please refer to screenshot 7 to 11.

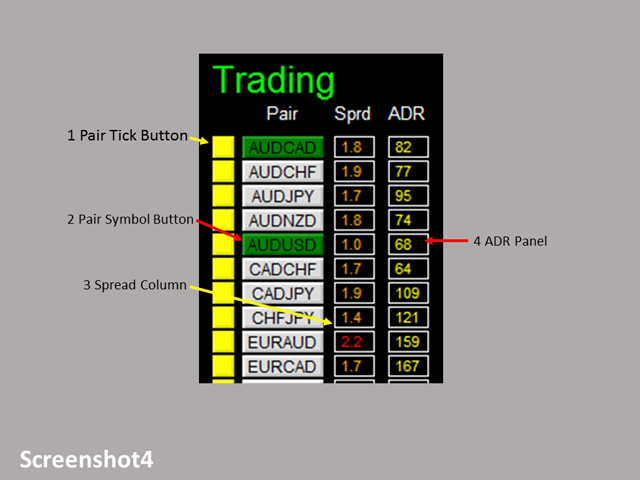
  1. Pair Tick Button
    • Black->de-active
    • Yellow->active
  2. Pair Symbol Button:
    • Click on button to open a corresponding new window chart
  3. Spread column: show current spread of each pair.
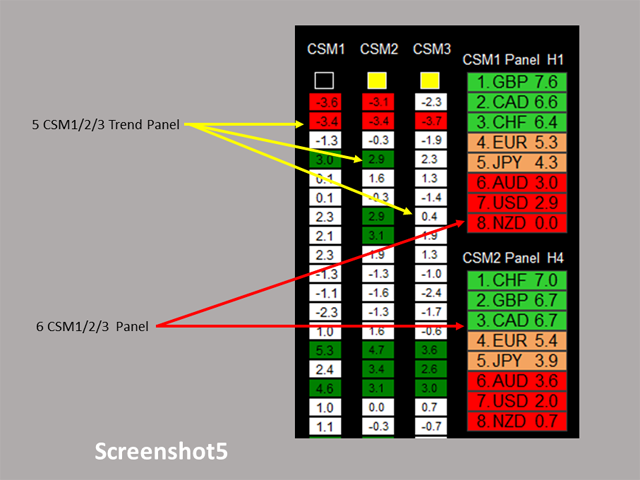
  4. Current and Previous TDI green vs red status Panel:
    • TDI green>TDI red -> panel green
    • TDI red>TDI green -> panel red
  5. Indicator Status Panel: indicates which indicator is selected to generate signal
  6. TDI Base Panel
    • TDI price>=TDI base ->panel green
    • TDI price<TDI base -> panel red
  7. TDI Momentum Panel:
    • TDI momentum>Momentum limit -> panel green
    • TDI momentum<(-Momentum limit) -> panel red
    • Otherwise -> panel white
  8. TDI Price Panel
    • Value>TDI overbought limit -> panel red ->sell only
    • Value<TDI oversold limit -> panel green ->buy only
    • Otherwise -> panel orange ->both
  9. 200 EMA Value
  10. Current Price
  11. 200 EMA Signal Panel
    • Current Price>=200 EMA: panel green
    • Current Price <200 EMA: panel red
  12. 10 EMA Value
  13. HA Close Value
  14. 10 EMA Signal Panel
    • HA Close>=10 EMA ->panel green
    • HA Close<10 EMA ->panel red
  15. Round Number Panel
    • (100-RN_limit) < Last two digit < upper 100 ->panel red
    • Lower 00 < Last two digit < RN_limit -> panel greed
    • Otherwise ->panel orange
  16. For the rest objects description, please refer to other Dashboard product description (Dashboard Super Currency Strength), they are the same.

If you have any customized request and/or suggestion, please feedback to me.

推荐产品
本指标可以让您享受两个最流行的产品来分析在感兴趣的价位的请求量和市场成交量: 真实市场深度图表 真实报价足迹成交量图表 本产品结合两个指标的效力,并以单个文件提供。 反危机出售。今日低价。赶紧! 真实的 COMBO 市场深度功能和报价成交量图表,完全等同于原始指标。您将享受这两款产品结合为单一超级指标的力量!下面是您将得到的功能: 真实市场深度图表 股民专用工具现已在 MetaTrader 5 上可用。 真实市场深度图表 指标在图表上以直方条的形式显示可视化的市场深度,并在实时模式下刷新。 利用 真实市场深度图表 指标您可以正确评估市场请求并从图表上看到大的市场。这可以 100% 的精确剥头皮和设置持仓止损。 指标以两种相应颜色的水平直方条形式显示买和卖的请求 (买-卖)。价格图表上给定级别的显示条和它们的长度与请求的交易量相应。此外, 它指示买卖请求的最大交易量。 此指标显示买卖请求总数量作为堆积面积图。这可以评估当经过下一价位时将会执行的请求总量。买卖请求总数量也显示在图表上。 省缺, 指标显示在图表背景上, 且它不会干扰任何其它指标。当使用指标交易时, 建议使用实际交易量。 本
Garner Trade Pad EA
Garner Edward Bennie
Garner Trade Pad EA is an MT5 Expert Advisor that brings trade planning and position sizing directly onto your chart. Position your Stop Loss and Take Profit, choose the amount you want to risk, and view the calculated lot size before placing an order.TP1 buy The dark navy panel with blue accents provides a clear view of your proposed trade. It is a manually operated calculator and order-entry tool: you choose the direction, levels and timing of every trade. ## Movable chart panel - Drag t
This Volume Delta Profile is an advanced MetaTrader 5 indicator that visualizes   volume delta (order flow imbalance)   using a volume profile-style histogram. It shows the difference between buying and selling pressure at specific price levels, helping traders identify supply and demand zones. This indicator provides a unique perspective on market dynamics by visualizing the imbalance between buying and selling pressure, offering insights beyond traditional volume analysis. Core Concept Positiv
VolumeProfile MT5
Robert Hess
4.14 (7)
Description: The Volume Profile displays detailed informations of historical trading activities at certain price levels (Market Profile). Locate the areas with the best prices in the market and get an advantage over other market participants. Features: Customizable Market Profile Shows the "fair" Value Area with 70% of all Volume Shows critical low volume zones Shows VPOC, VAL and VAH Points integrated resource management to reduce the load while working with multiple charts Works on all timefr
TRINITY TREND — 一个 EA,三大趋势市场(Bitcoin、Ethereum、USDJPY) 概览(MT5 回测 — 历史回测数据,并非实盘记录) - 一个 EA,从一张 BTCUSD H4 图表运行三个低相关的趋势市场:BTCUSD、ETHUSD 和 USDJPY 顺 SMA200 方向的唐奇安突破 - 长周期(2019.01-2026.06,测试器模拟 tick):Standard(默认)+1,021% / 盈利因子 1.91 / 净值回撤 14.1% - 100% 真实 tick 检验(2026.01-2026.08,38 笔交易):Standard 盈利因子 1.25 / 净值回撤 12.9%;Defensive 盈利因子 1.34 / 净值回撤 6.4% - Ultra 在真实 tick 上亏损(盈利因子 0.93 / 净值回撤 75.3%)——这就是 v2.38 把默认改为 Standard 的原因 - 完整验证记录: https://fxea365.com/zh-CN/ea/multi-asset-trend-pack === 首发价格:限时最低价 $
ClusterSecondForex
Rafil Nurmukhametov
4.67 (3)
该工具允许绘制不同类型的图表。 秒图从1秒到86400秒 从1滴答开始的滴答图 成交量图 三角洲图 仁科图 范围图 用于体积分析的内置指标。 产品演示 https://www.mql5.com/ru/channels/clustersecondforex 每日市场概况和所选时间框架的市场概况。 集群搜索。 不平衡。 VWAP。 动态POC、VAH、VAL 价格窗口简介 具有不同表现形式的垂直体积。 δ,有不同的可视化选项。 当前的和高的时间框架极 地下室蜡烛图指标 为了控制该图表,我们使用了 鼠标左键--移动图表,在设置中选择不同模式,调用位于屏幕左下角螺丝刀键图标下的主设置窗口。 鼠标右键 - 用于输入位于屏幕左上角图标下的图形结构的设置,以及绘制垂直、水平、趋势线和矩形的个别设置。 在图表区域旋转鼠标滚轮--左右移动图表,按住Ctrl键--上下移动图表,在价格比例区域--按价格比例,在时间轴区域--按时间比例。 H键--在图表上或体积区建立一条水平线(必须启用 "画水平线 "图标),Shift+H键--删除所有水平线。 V键 - 设置垂直线(必须启用 "画垂直线 "图标),S
TLID Volume Profile
Robby Suhendrawan
Volume Profile 是专业和机构交易者使用的最强大的分析工具之一。与仅在屏幕底部显示交易发生时间的传统成交量指标不同,Volume Profile 准确显示了这些交易发生的价格水平。这为您提供了市场结构的清晰 X 光透视图,让您能够准确看到聪明的资金 (smart money) 和机构在何处积累或派发其头寸。 Volume Profile 如何检测机构订单和 Support/Resistance(支撑/阻力) 通过根据价格比例水平绘制成交量,该指标根据实际的历史交易自然地揭示了真实的供需区域。根据标准的 Volume Profile 规则,您可以通过以下方式解读市场: Point of Control (POC): 这是在选定时间段内交易量最大的特定价格水平。POC 代表了买卖双方接受的最公平价格。机构围绕这一水平建立他们庞大的头寸。在交易中,POC 充当了一块巨大的磁铁和非常强大的 Support 或 Resistance 水平。如果价格远离 POC,它通常会自然地被吸引回 POC。 Value Area (VA): 这是大部分交易量发生的价格范围,通常设置为总交易量的 7
该指标建立当前报价,可以与历史报价进行比较,并在此基础上进行价格走势预测。指示器有一个文本字段,用于快速导航到所需日期。 选项: 符号 - 选择指标将显示的符号; SymbolPeriod - 选择指标从中获取数据的时段; IndicatorColor - 指示器颜色; HorisontalShift - 由指标绘制的报价移动指定的柱数; Inverse - true 反转引号,false - 原始视图; ChartVerticalShiftStep - 图表垂直移动(键盘上的向上/向下箭头); 接下来是文本字段的设置,您可以在其中输入日期,您可以通过按“回车”立即跳转到该日期。 接下来是文本字段的设置,您可以在其中输入日期,您可以通过按“回车”立即跳转到该日期。
Haven Fibonacci Volume Profiles — 您的自动市场区间分析师 隆重推出 Haven Fibonacci Volume Profiles — 一款将市场分析提升到新水平的强大工具。该指标可自动识别基于重要转向点(枢轴点)构建的关键价格区间,并在每个区间上叠加详细的成交量分布图和斐波那契水平。这使交易者能够即时了解流动性集中在哪里,以及真正的支撑位和阻力位位于何处。 其他产品 -> 这里 . 无需再猜测哪个区间是有效的。该指标为您完成所有复杂的工作,同时显示历史和当前的价格区间,让您全面了解市场背景。 指标主要功能 自动识别区间: 指标可独立找到重要的高点和低点(枢轴点),并在此之间构建价格区间。 详细的成交量分布图: 为每个区间计算并显示成交量分布图,突出显示交易活动最多和最少的区域。 可自定义的斐波那契水平: 斐波那契水平会自动应用于每个区间。您可以启用、禁用并自定义每个水平的颜色(0.0、0.236、0.5、1.0 等)。 POC(控制点)可视化: 成交量分布图清晰显示成交量最大的水平,该水平通常作为强支撑或阻力。 历史分析: 指标不仅显示当前的价格区间
Total Volume Profile
Shahabeddin Baset
Includes almost all the concepts related to Volume Profile: POC , Value Area , Developing POC , Anchored VWAP , Volume Delta ; since the “Total” in its name. It is fast in its calculations and simple to work with. Features: 1.    Selectable calculation timeframe to find most traded levels. 2.    Capable of calculating Volume Profile based on tick data 3.    Adjustable histogram bars by their count. 4.    Adjustable histogram bars by their height (price range). 5.    Showing Value Area (VA

交易控制台:使您的交易体验更舒适 该应用无法在策略测试器中进行测试。 请从以下链接获取演示版本并进行测试。 Download DEMO ver. 这是用于演示帐户的。 1. 交易期间的功能: (1) 经济指标的显示和通知: 在经济指标发布前几分钟收到警报、推送通知和电子邮件。 在警报期间屏幕会闪烁,易于注意。 根据货币、关键词和指标重要性自定义通知。 指标按重要性进行颜色编码。 (2) 可视化的TP/SL订单: 在下单时以点数、pips和货币金额估算盈亏。 使用鼠标操作指定TP和SL值,可选择“固定RR值”或“单独更改”选项。 仅下TP、仅下SL或同时下单的选项。 支持市价订单(自动模式)、指定的止损订单和限价订单(手动模式)。 轻松修改多个仓位的TP和SL,显示盈亏估算。 (3) 自动手数(交易量)计算: 根据指定的保证金维持率计算最大手数。 以计算出的最大手数的分数或百分比计算单笔订单的手数。 也可以根据所需的保证金金额计算手数。 (4) 移动止损 (5) 止盈平仓: 通过添加指定的点数、pips或金额,在止盈值时接收通知或平仓。 (6) 结算时的批量操作: 无需等待服务器响应,
ClusterSecond
Rafil Nurmukhametov
4.78 (32)
该工具允许绘制不同类型的图表。 秒图从1秒到86400秒 从1滴答开始的滴答图 成交量图 三角洲图 仁科图 范围图 用于体积分析的内置指标。 该工具的演示版 https://www.mql5.com/ru/channels/clustersecond 每日市场概况和所选时间框架的市场概况。 集群搜索。 不平衡。 VWAP。 动态POC、VAH、VAL 价格窗口简介 具有不同表现形式的垂直体积。 δ,有不同的可视化选项。 当前的和高的时间框架极 地下室指标烛台显示 也可以从图表中进行交易。 注意:该工具是为具有真实(交换)量的市场设计的。 它不适合外汇市场。它在VPS上不起作用。它在策略测试器中不起作用。 为了控制该图表,我们使用了 鼠标左键 - 移动图表,在设置中选择不同的模式,调用位于屏幕左下角带螺丝刀的钥匙图标下的主设置窗口。 鼠标右键 - 用于输入位于屏幕左上角图标下的图形结构的设置,以及绘制垂直、水平、趋势线和矩形的单独设置。 在图表区域旋转鼠标滚轮--左右移动图表,按住Ctrl键--上下移动图表,在价格比例区域--按价格比例,在时间轴区域--按时间比例。 H键--在
Philippe Calibre 79 Gold
Yassir Lamrichi
5 (2)
Philippe Calibre 79 | 专为 XAUUSD 打造的高精度算法交易系统 加入官方讨论与支持群组: 点击这里 实时信号 实盘信号: 点击这里 其他可选风险策略 风险策略 说明 下载链接 保守型策略  侧重低风险敞口 下载  预设 防御型策略  降低波动风险 下载 预设 严格防御配置 严格的风险限制 下载 预设 系统官方文档 详细的使用教程与参数指南,请查阅我们的 MQL5 官方博客文章: [链接] 完整输入参数配置手册 [链接] 资金管理与风险控制配置指南 [链接] 每日净值风控 (Daily Equity) 设置教程 系统概述 Philippe Calibre 79 是一款专为 MetaTrader 5 平台的黄金 (XAUUSD) 交易而设计的高性能全自动 EA。该系统基于动量分析与统计价格行为学 (Price Action) 寻找入场契机。系统内置高效的订单组合闭合机制 (Basket Closure) 来处理持仓,杜绝不可控的盲目马丁倍投风险。 核心功能 • 订单组合管理 (Basket Management):自动将亏损订单与较大盈利订单进行对冲
这是一款基于市场深度的可视化指标,它可工作于所有提供市场深度的品种。它显示每笔卖价/出价的交易量与总卖价/出价的交易量的比值,这样用户可以直观地判断买卖方向的瞬时强度。你可以同时在几个图表上应用这个指标,观察不同品种的买卖队列。 购买前请确认你的交易商有提供市场深度这个功能。 。。。。。。。。。。。。。。。。。。。。。。。。。。。。。。。。。。。。。。。。。。。。。。。。。。。。。。。。。。。。。。。。。。。。。。。。 。。。。。。。。。。。。。。。。。。。。。。。。。。。。。。。。。。。。。。。。。。。。。。。。。。。。。。。。。。。。。。。。。。。。。。。。。 。。。。。。。。。。。。。。。。。。。。。。。。。。。。。。。。。。。。。。。。。。。。。。。。。。。
Magic Channel Scalper  is a channel indicator for the MetaTrader 5 terminal. This indicator allows finding the most probable trend reversal points. Unlike most channel indicators, Magic Channel Scalper does not redraw. The alert system (alerts, email and push notifications) will help you to simultaneously monitor multiple trading instruments. Attach the indicator to a chart, and the alert will trigger once a signal emerges. With our alerting system, you will never miss a single position opening
Volume Vacuum Profile
Gleidson Duca De Aguiar
Launch price: 30 USD - price will increase after the first purchases, so early buyers lock in this rate. Volume Vacuum Profile is a session-by-session Volume Profile indicator for MetaTrader 5. It combines the daily Point of Control (POC), a full volume histogram and automatic Low Volume Node (LVN) detection - the liquidity vacuum zones where price tends to move fast due to a lack of resting orders. Key features: - Volume histogram built from 1-minute data for each trading day, independent of
累積成交量差值 (CVD) 指標(及其相關的成交量差值蠟燭圖)屬於以成交量為基礎的訂單流指標。 與僅顯示交易總量的標準成交量指標不同,CVD 專門衡量市場買入壓力和賣出壓力之間的淨差值。 其構成如下: 成交量差值(蠟燭圖):衡量每根蠟燭圖中的市價買單(以賣價成交)與市價賣單(以買價成交)之間的差值。如果蠟燭圖的成交量差值為正,表示買方佔據主導地位;如果為負,則表示賣方佔據主導地位。 累積成交量差值(折線圖/長條圖):CVD 將各個蠟燭圖的成交量差值進行匯總,以顯示更宏觀的趨勢。 在技​​術分析中的主要用途: 訂單流與情緒:它使交易者能夠深入了解價格走勢,從而判斷究竟是買方還是賣方在主導價格波動。 背離檢測:它被廣泛用作動量和背離工具。例如,如果價格創出新高,但CVD指標創出新低(看跌背離),則表示上升趨勢缺乏真正的買盤支撐,可能很快就會反轉。 突破確認:交易者使用它來確認突破關鍵支撐位或阻力位是否得到了實際買盤的支持。
Hull Heikin Ashi Smoothed
Flavio Javier Jarabeck
Heikin Ashi candlesticks are a powerful tool for traders, offering a clear and smooth visualization of market trends. Unlike traditional candlesticks, they filter out market noise, providing a cleaner view of the market's direction and strength, which helps traders make more informed decisions. The Hull Heikin Ashi Smoothed indicator from Minions Labs takes this a step further by integrating the Hull Moving Average for enhanced smoothing and precision. This indicator not only simplifies trend id
Volume Flow Pro
Phonekeo Chanthavong
VolumeFlow Pro is an MT5 technical indicator that combines Volume Profile, session tracking, Candle timer and real-time market structure analysis: Volume Profile: Analyzes Tick/Real Volume to plot dynamic Volume Profiles, Point of Control (POC), Value Area (VAH/VAL), and HVN/LVN support/resistance levels. Market Context: Scores market conditions (0–100) and detects Value Area reclaims, rejections, and breakouts. Sessions & MTF: Overlay higher-timeframe levels and track Sydney, Tokyo, London,
Honest Breakeven
Konstantin Gruzdev
Indicator gives an honest picture of changes in breakeven levels for transactions throughout the account history, and not just for open positions (screenshot 1). Accurate calculation of levels, taking into account accrued commissions, fees and swaps, allows you to evaluate trading results both visually and in Expert Advisors (screenshot 2). For Expert Advisors, the indicator in its standard form provides not only the break-even level, but also the number of positions, volume, and all additional
Holiday Guard
Nataliia Vyhovska
Achieve peace of mind with our EA companion! Simply set it and let it roll. Safeguard your trades on sluggish market days and holidays. Get updates on your balance and EA status every Friday evening, for example. Stay in the loop even if your terminal or VPS decides to take a break. Trading made easy – enjoy the tranquility! This EA has several functionalities Closing of pending or open positions during pre-configured holidays. Automatic closing and reopening of pending positions during the nig
This is an open interest indicator for the Russian FORTS futures market. Now, you can receive data on the open interest in real time in МТ5 terminal. This allows you to develop brand new trading strategies or considerably improve the existing ones. The data on the open interest is received from the database (text CSV or binary one at user's discretion). Thus, upon completion of a trading session and disabling the terminal (or PC), the data is saved and uploaded to the chart when the terminal is
Pulse Reversal Zones Pro 帮助 MT5 交易者通过简洁的实时仪表盘识别潜在的反转区域、市场疲软迹象、入场区域、止盈/止损预测以及趋势压力。购买前,请下载演示版并在策略测试器中进行测试。 Pulse Reversal Zones Pro 专为那些寻求更清晰方式来识别潜在市场反转、动能衰竭及价格反应区域的交易者而设计,且在显示信息的同时不会导致图表变得过于拥挤杂乱。 该指标采用了一种基于“脉冲”原理的反转识别引擎,其灵感源自先进的动量分析与延展性逻辑。它综合分析了市场走势、震荡指标距离、EMA 偏差、零轴位置、信号强度以及(可选的)更高时间周期偏差之间的相互关系。当各项条件达成一致时,它会直接在图表上标记出潜在的做多(LONG)或做空(SHORT)脉冲交易机会。 与那些仅显示简单箭头的初级指标不同,Pulse Reversal Zones Pro 提供了一套完整的可视化交易框架。它将入场区域、预估止盈(TP)水平、止损(SL)区域、信号评分、市场偏差、延展性状态、确认模式以及实时扫描状态,全部整合在一个简洁明了的界面之中。 为何交易者应当选用此指标? 本指
Pulsar Terminal 是 Astralys LLC 旗下商标 Pulsar Technologies 的产品。 Pulsar Terminal是MetaTrader 5的实用工具插件。它是一个 可视化界面 ,结合了 配套应用程序 中的执行工具,通过 Expert Advisor 连接到您的MetaTrader 5账户。我们使用配套应用程序来最大化工具的功能,并提供比标准MT5面板更先进的可视化界面和工作流程。Pulsar Terminal不是独立应用程序,需要MetaTrader 5才能运行。EA与Pulsar Terminal配套应用程序 仅通过localhost 通信。配套应用程序的安装程序通过安装指南(MQL5博客文章)提供给购买者。 该界面允许您执行订单、管理风险、查看交易统计数据,以及通过连接到MetaTrader 5的配套应用程序中的高级图表工具直接进行图表分析。 安装指南(MQL5博客): 将在产品批准后发布 用户指南(MQL5博客) 重要 - 运行条件 1) MetaTrader 5必须在与配套应用程序相同的PC上打开(通过EA的仅限localhost连
Smart Gold Expert Advisor — это профессиональный торговый советник с интерактивной графической панелью, разработанный специально для торговли на новостях (преимущественно на инструменте Gold/USD, но может использоваться и для любых других активов). Робот автоматизирует выставление отложенных ордеров по обе стороны от текущей цены, управляет рисками и сопровождает сделку после прорыва. 1. Ключевые возможности и функции. Интерактивная торговая панель: Полностью визуальный интерфейс прямо на графи
Blahtech Market Profile MT5
Blahtech Limited
5 (10)
Was: $249  Now: $99   Market Profile defines a number of day types that can help the trader to determine market behaviour. A key feature is the Value Area, representing the range of price action where 70% of trading took place. Understanding the Value Area can give traders valuable insight into market direction and establish the higher odds trade. It is an excellent addition to any system you may be using. Inspired by Jim Dalton’s book “Mind Over Markets”, this indicator is designed to suit the
BoxChart MT5
Evgeny Shevtsov
5 (7)
The market is unfair if only because 10% of participants manage 90% of funds. An ordinary trader has slim changes to stand against these "vultures". This problem can be solved. You just need to be among these 10%, learn to predict their intentions and move with them. Volume is the only preemptive factor that faultlessly works on any timeframe and symbol. First, the volume appears and is accumulated, and only then the price moves. The price moves from one volume to another. Areas of volume accumu
Trading Assistent is a multifunctional trading panel that combines all necessary tools for professional trading. The panel provides complete control over positions, in-depth risk analysis, and fast order execution. MAIN FUNCTIONAL BLOCKS Position Management: - Real-time viewing of all open positions - Sorting by symbol, profit, volume, and type - Visual indication of profitable and losing positions - Bulk closing operations - Breakeven function for profit protection Trading Operations: - I
LevelsHunter Pro
Dmitrii Kovalevskii
LevelsHunter Pro – 专业成交量分布图与历史分析 这是什么 LevelsHunter Pro 是一款成交量分布图指标,不仅显示当前的 POC、VAH 和 VAL 水平,还允许您   回到过去 ,查看任何历史交易时刻这些水平的位置。 这不是一个在图表上猜测的工具。而是对已经发生的情况进行   冷静分析   的工具。 交易者为什么需要它 问题:   大多数指标只显示「此时此地」。您关闭一笔交易并想分析错误 — 但水平已经移动了。您无法判断 POC 是在入场价之上还是之下。您无法判断价格为何反弹或突破水平。 解决方案:   LevelsHunter Pro 记录每个K线的水平。您只需点击历史中的任何一根K线,就能准确看到当时的成交量分布图。 如何在交易中使用 1. 改善实时入场 您看到一个买入信号。价格接近 POC 或 VAH 水平。您该怎么办? 开启   历史模式 ,快速检查一小时前或昨天在同一水平上价格的表现。如果一小时前价格从 POC 反弹 — 该水平有效。如果突破了 — 最好远离。 一个具体的策略示例: 您交易 VAH 向上突破。价格正在测试 VAH。您点击同一根K线
Smart Sweep Sniper: Midnight Open PRO Edition The ultra-specialized institutional tool for Day Trading and Prop Firms If you like it, please leave a positive review to support our work; if you encounter any problems, please let us know. This Midnight Open edition marks a radical evolution. It abandons generalist macro-economic analysis to become an instrument of surgical precision, focused exclusively on intraday reactivity and the pinpoint exploitation of the midnight opening price (NY). Desig
该产品的买家也购买
================================================================================ POC BREAKOUT - V20.72. Full Professional Grade Toolkit ================================================================================ POC Breakout is a full MetaTrader 5 trading dashboard for discretionary traders who want breakout signals, Point of Control (POC) context, volume profiles, order flow, market structure, news, alerts, and advanced trade planning in one professional workspace. Attached directly to you
Telegram to MT5 Multi-Channel Copier   可将您 Telegram 和 Discord 频道中的交易信号自动复制到 MetaTrader 5。无需机器人、无需浏览器扩展、无需手动复制。信号一到 Telegram 或 Discord,EA 几秒内就在您的终端开仓。 在复制某个频道之前,内置回测器还能告诉您该频道在您的账户上会有怎样的表现。 产品包含两个组件:一个监听您 Telegram 频道的 Windows 应用程序,以及在 MT5 终端执行信号的本 EA。同时提供 MT4 版本   点此 . 设置指南与应用下载:   https://www.mql5.com/en/blogs/post/768988 了解如何 回测任何 Telegram 信号频道 。 当前价格将来会上调。 工作原理 应用通过您自己的 Telegram 账号连接,因此能看到您关注的所有频道、群组、话题和机器人,包括私密和 VIP 频道。信号到达时,应用读取它,EA 按您的手数和设置在终端中开仓。 整个过程全自动,无需守在电脑前。专为 24/7 无人值守运行设计:Telegram 连接
Farmed Hedge Yield Farming | All Markets (Manual - Hybrid - Semi/Automated EA) VERIFIED TRADING RESULTS - Farmed Hedge Yield Axi Copy:  https://www.mql5.com/en/signals/2356376 - Farmed Hedge Yield Exn Copy:   https://www.mql5.com/en/signals/2356404 - Farmed Hedge Yield V Copy:  https://www.mql5.com/en/signals/2357156 IMPORTANT NOTICE: FarmedHedge is a MANUAL-FOCUSED TRADING UTILITY ,not a fully automated EA. Results shown on this Signal include manual trades and overall strategic management.
The product will copy all telegram signal to MT5 ( which you are member) , also it can work as remote copier.  Easy to set up, copy order instant, can work with almost signal formats, image signal,  s upport to translate other language to English Work with all type of channel or group, even channel have "Restrict Saving Content", work with  multi channel, multi MT5 Work as remote copier: with signal have ticket number, it will copy exactly via ticket number. Support to backtest signal. How to s
Power Candles 策略扫描器——自优化多符号设置查找器 Power Candles策略扫描器 采用与Power Candles指标相同的自优化引擎,可同时扫描您“市场观察”中的所有交易品种。一个面板即可显示当前哪些品种在统计上具备交易价值、每种策略的最佳应用方向、最优止损/止盈组合,并在新信号触发时立即向您发送提醒。 本工具是 Stein Investments 生态系统的一部分 - 18+ 款工具,加上 Max,您的一对一 AI 交易导师。  随时在线,深入了解每一款指标,在您需要梳理思路的那一刻就在那里。  立即认识他: https://stein.investments 您的全面市场监控。每个交易品种超过3,000次自动优化。2种警报类型。一键切换图表并采取行动。 为何您需要此工具 大多数多标的扫描器仅展示价格 波动 。每只股票的波动率、百分比变化、RSI。您仍需自行摸索正确的策略、合适的止损位以及理想的入场阈值。Power Candles策略扫描器针对每只股票自动解答这些问题,仅在数学验证过的交易设置中触发实际入场信号时才会向您发出提示。这就是全部卖点。 自动
Entry In The Zone with SMC Multi Timeframe is a real-time market analysis tool based on Smart Money Concepts (SMC), designed to analyze market structure, price direction, and key trading zones. It supports both Single-Timeframe and Multi-Timeframe Analysis, providing a clearer view of overall market structure across multiple timeframes, with real-time BUY / SELL signals designed with a strict focus on No-Repaint principles.   The signals are designed to help filter unclear setups and evaluate tr
Quant AI Agents
Ho Tuan Thang
5 (1)
Quant AI Agents are independent trading Expert Advisors. Instead of trading using a fixed strategy like other conventional EAs, Quant AI Agents   is a   multi-agent AI trading framework   that turns natural-language strategy prompts into live.  WANT THE SAME RESULTS AS MY LIVE SIGNAL?   Use the exact same brokers I do:   IC MARKETS , IC TRADING   .  Unlike the centralized stock market, Forex has no single, unified price feed.  Every broker sources liquidity from different providers, creating un
RETAILBERG FOOTPRINT CHART PRO — Order-Flow Workspace for MetaTrader 5 Version 7.00  |  Professional System  |  31 tools  |  One chart A full 150-page illustrated User Manual is included. Please read the full manual to understand this feature packed footprint chart elements and ui. https://www.mql5.com/en/blogs/post/777982 DEMO / STRATEGY TESTER — PLEASE READ FIRST
The Patch
Mian Rameez Ali
The Patch It never opens a trade. It walks behind the ones that did. Every open position, every pending order — checked twice a second for the one thing that's easy to forget: a stop, a target. Found bare, it doesn't ask. It writes the missing number in, measured in points from wherever the position began, and moves on to the next. No strategy, no opinion on direction. Just the quiet assumption that nothing should ever sit on the market unprotected — not because someone decided it shouldn't,
FUTURES ORDERFLOW FOOTPRINT CHART Professional OrderFlow EA for MetaTrader 5 Version 1.01| Professional tool for real traders | Institutional-Grade Visualization STRATEGY TESTER USERS - PLEASE SELECT EVERY REAL TICK WHEN TESTING AND YOU HAVE DOWNLOADED HISTORICAL DATA. IF YOU SEE A WAITING SCREEN AND IT IS NOT DOWNLOADING, IT MEANS YOU HAVE LOW HISTORICAL DATA. TRY 1 MIN AND 5 MIN FIRST ON 1 DAY DATA. ONE DAY DATA SHOULD BE THE NEWEST AND MOST CURRENT DATE. PLEASE WAIT UNTIL THE MARKET HAS ROL
Floor Watch
Syed Tauqeer Hussain Shah
Floor Watch One number, watched every thirty seconds: how far equity has fallen since the day began — or since its highest point, if it's told to trail the peak instead of the open. Cross the line and it doesn't argue. Every open position closes, every pending order vanishes, and anything that slips through afterward gets shut the moment it appears. Not asked. Removed. The floor holds until the clock turns 5 AM Pakistan time — then, and only then, does the day start over. One rule. No except
Ultimate Extractor
Clifton Creath
5 (7)
Ultimate Extractor - Professional Trading Analytics for MT5 *****this is the local HTML version of Ultimate Extractor. !!!!!it is not compatible with Cloud!!!! For the online version please reach out to me directly****** Ultimate EA manager also now available when you use cloud pro and above for free!! Ultimate Extractor transforms your MetaTrader 5 trading history into actionable insights with comprehensive analytics, interactive charts, and real-time performance tracking. What It Does Automa
Advanced Daily Trading Limiter PRO
AL MOOSAWI ABDULLAH JAFFER BAQER
Advanced Daily Trading Limiter PRO Professional Risk Management. Uncompromising Trading Discipline. One undisciplined trading session can erase weeks of consistent profits. Whether it's overtrading, revenge trading, or exceeding a prop firm's daily risk limits, emotional decisions often become a trader's biggest obstacle—not the market itself. Advanced Daily Trading Limiter PRO is a comprehensive risk management and discipline enforcement utility for MetaTrader 5, designed to help traders stay
一次购买,即可免费获得我所有 MT4 和 MT5 指标,包括现有指标及未来发布的指标。 购买后请联系我,了解领取方式。 计划每售出 10 份后提价 50$,最高至 999$。 实际价格以结算时的 Market 标价为准。 保留您信赖的指标,让相关操作自动完成。 您的信号。您的规则。您的交易执行。 您已有信赖的 MT5 指标,却仍需盯盘、等待信号、计算手数、下单并手动管理每个持仓? Stratiora Signal Engine MT5 将这些环节连接起来。它可将兼容的买入和卖出缓冲区信号转化为完整的自动化流程:入场、交易量计算、止损、止盈、过滤、持仓管理及账户保护。 更换指标或交易思路时,无需每次另行定制 EA。您可以使用同一个灵活的执行引擎,自行决定每个信号的交易方式。 您的信号。您的规则。您的交易执行。 为什么开发 Stratiora 许多交易者已有熟悉且信赖的指标,但仍需手动盯盘、等待信号、计算手数、下单和管理持仓。 Stratiora 的目的就是连接这些步骤。 指标仍负责生成交易信号,Stratiora 负责按您的规则执行和管理。您决定何时读取信号、如何计算交易量、设置哪些保
AI Trading Assistant | Discord/Telegram → MetaTrader 5 Automation An advanced automation framework that enables natural language trade instructions sent from Discord or Telegram to be executed automatically on MetaTrader 5 using n8n workflows and a custom Expert Advisor. This solution integrates modern workflow automation with MetaTrader 5, allowing users to send trade instructions such as: “buy EURUSD 1% risk 30 pip SL 3R TP” “sell GBPUSD now 2% 20 SL 60 TP” “buy limit EURUSD at 1.0850 with 1%
YuClusters
Yury Kulikov
4.93 (43)
Attention: You can view the program operation in the free version  YuClusters DEMO .  YuClusters is a professional market analysis system. The trader has unique opportunities to analyze the flow of orders, trade volumes, price movements using various charts, profiles, indicators, and graphical objects. YuClusters operates on data based on Time&Sales or ticks information, depending on what is available in the quotes of a financial instrument. YuClusters allows you to build graphs by combining da
Premium Trade Manager - 内置交易导师的图表面板 Premium Trade Manager 将一位交易导师嵌入您的图表,并在其下搭载完整的执行引擎。像往常一样建立交易,然后让您的 AI 交易导师 Max 读取这笔具体的交易,结合您的实时账户给出直接判断,再由您决定是否下单:止损是否符合纪律化交易的要求、风险规模是否合理、高影响新闻事件是否即将发布、您是否接近资金盘限额。其下是完整的执行引擎,负责点击之后的一切:一键按风险下单、您在图表上拖动规划且交易进行中仍可随时调整的计划、最多四个分批止盈级别、七种移动止损方式、实时资金盘合规检查、新闻屏蔽保护,以及对自身成本进行评级的点差功能。决策由您做出。Max 给出第二次审视。面板负责此后的一切。 购买前先亲手体验。 直接在浏览器中点击实时面板,这是在购买前感受其工作方式的最快途径。 stein.investments/products/premium-trade-manager Max 是您的一对一 AI 交易导师,他直接内置于面板之中。  他了解您的账户、您的设置和您的规则,用您自己的语言回答,并在每笔交易下单前进
VirtualTradePad PRO SE MT5 — MetaTrader 5 专业交易控制中心 VirtualTradePad PRO SE 是一款基于图表的高级交易面板,也是适用于 MetaTrader 5 的交易管理工作区。它专为希望获得更快执行、更清晰持仓控制、结构化交易管理、可视化价位规划,以及直接在图表上完成专业交易流程的交易者而设计。 这不仅仅是一个 BUY / SELL 面板。PRO SE 将手动交易、挂单、持仓管理、部分平仓、篮子利润/亏损控制、加仓均价层级、ATM 规则、信号监控、实时市场信息、策略测试器 (Strategy Tester) 流程以及面向 VPS 的运行方式整合到一个互相关联的界面中。 MT4 版本 | 完整说明和截图 | 如何购买 | 如何安装 | 如何获取日志文件 | 如何测试与优化 | Expforex 的所有产品 为什么交易者会选择这套面板 图表一键交易 ,并支持键盘快速操作 快速完成开仓、平仓、修改、反转、锁仓与部分平仓 深度控制仓位、挂单、总利润与风控逻辑 自动参数计算,减少手动输入与重复劳动 为什么 PRO SE 比标准手动交易更高
Daily Trading Limiter
AL MOOSAWI ABDULLAH JAFFER BAQER
5 (8)
• Please test the product in the Strategy Tester before purchasing to understand how it works. • If you face any issues, contact me via private message—I’m always available to help. • After purchase, send me a screenshot of your order to receive a FREE EA as a gift. Daily Trading Limiter — the rule you cannot break Every trader knows the number. Three trades. Two percent. One bad day and stop. And every trader has watched themselves take the fourth trade anyway. The problem was never knowing th
MT5 Trading Deck
Manuel Michiels
5 (2)
One button. One trade. MT5 Trading Deck is a hotkey trading panel for MetaTrader 5 that turns the platform into a keyboard-driven execution cockpit. Stop loss, take profit and lot size are pre-calculated for every key; the moment you press, a market order is live on the broker. A complete technical user manual is attached in the product Comments section. It documents every input parameter, the full hotkey map, the recommended Stream Deck XL layout, and the advanced workflows for Pre-Limit orders
EA Slipstream
Stephen J Martret
5 (1)
EA Slipstream — MQL5 市场产品说明(简体中文) 您的回测按照 EA 要求的价格成交了每一笔订单,您的账户却不会。 EA Slipstream 使用您自己的成交价、滑点和点差,衡量执行成本对 EA 的影响,呈现 EA 的真实表现。 回测按 EA 指定的价位计算每一笔交易。而在实盘中,挂单会按触发瞬间可获得的价格成交,止损会在行情触及时的位置平仓,当时的点差就是账户当时的报价。这两者之间的差异既不是观点,也不是模型——它已经记录在您的 EA 所下的订单里,也记录在您终端保存的价格历史里。 EA Slipstream 同时读取两者。它衡量您的账户在成交时让出了多少,每笔交易开仓那一分钟的点差是多少,以及重要新闻发布后的几秒内点差发生了什么变化。随后,它把这些测量结果应用到交易本身:既包括已在您账户上运行的 EA,也包括您加载的任意一份策略测试器报告。结果是同一个 EA 的第二次呈现——按您自己的执行条件计价,而不是按完美成交计价。 执行条件因账户而异,也因交易品种而异。本工具不对其做优劣评判,也不比较不同的服务提供方。它衡量的是您的账户实际发生了什么,并显示这对策略意味着
EA Overfitter
Stephen J Martret
5 (1)
回测看起来很漂亮。但它明天、下周、下个月还能继续赚钱吗? EA Overfitter 让您的 EA 在 100 段它从未见过的价格历史上重新运行。一个分数告诉您这个优势是否真实。 回测告诉您的,是 EA 在某一段价格历史上的表现——那段恰好发生过的历史。您无法从中判断,这个结果有多少来自策略本身,又有多少只是那一条特定路径带来的。 EA Overfitter 回答的正是这个问题。它构建最多 100 段您的 EA 从未交易过的合成价格历史,让策略在全部这些历史上重新运行,并展示它所产生的完整结果区间。您得到的不再是一条幸运或不幸路径上的单个数字,而是一幅真实的图景:策略在陌生数据上多久能赚钱、典型结果是什么样(而不是最好的那一次),以及您的回测离它有多远。 这些世界是由您自己的近期历史重建而成,因此这不是预测——任何从历史数据出发的检验都不可能是预测。它告诉您的是:这个优势是否依赖于价格的某一种特定排列,以及回测数字距离典型结果有多远。在投入资金之前,这才是值得回答的问题。 三个步骤 1. 构建。在图表上选择时间区间和世界数量,然后按 Build。EA Overfitter 会
Trading Chaos Expert
Hennadii Stanilevych
5 (11)
世界上没有本软件的同等产品,它代表一个覆盖交易信号的通用交易 "控制台",自动入场,设置止损和止盈,还有在单一窗口里同时进行多交易尾随终止。EA 的 "三次点击" 直观控制,确保在不同计算机上全方位使用所有功能,包括平板电脑。 与附加的信号指标交互来标记图标,给出实际市场的全貌,EA 令您做出正确的选择,以及在大多数情况下成为胜者一方。内置资金管理算法, 还有自动计算手数, 虚拟订单交易, 以及一些其它从崩溃账户里挽救交易者的 "诀窍"。它不是一个 "黑盒子"。而是一个深思熟虑的交易员的不可或缺的助理, 至少要尝试一次它的动作。 注,在面板上形成的 EA 不能在策略测试员中测试。可以在您的模拟账户里以实时模式检查它, 您可以下载本 EA 的免费版 - 混沌交易 EA 演示 。 EA 表现为一个面板,带有内置功能的交易机器人的,自动基于交易者可直观检查的交易信号入场,完全按照比尔·威廉姆斯的策略“混沌交易:第二版”和“新贸易维度”。在单独的窗口里,EA 识别价格走势的导向,用于指定品种和时间帧的全自动交易模式,也可以多品种并发。 它同时分析 MetaTrader 5“市场观察”窗口中显示
Copy your MT5 trades to Interactive Brokers You keep using MT5. Every order you open or close is sent to your IB account. In real time. No coding. No changes to your strategy or EA. Try it first Rent 1 month: $30. Test on a live or paper account. What it does Real-time copying: same direction, reverse, or one side only. Map any MT5 symbol to any IB symbol. Set a lot ratio for each. Forex, Futures, Stocks, CFDs, Metals and Crypto. Position sync: both accounts checked, any difference fixed. Optio
Quant Panel
Kevin Craig E Gittins
量化面板专业版 量化交易者的终极多EA性能仪表盘 无需再在多个图表或外部工具之间切换来监控您的算法策略!Quant Panel Pro 通过一个简洁专业的界面,为您提供机构级的投资组合监控体验。 核心功能 触手可及的量化分析 所有智能交易顾问(EA)的实时盈亏汇总 带有交易频率指标的胜率统计分析 高级回撤跟踪(已实现和未实现) 风险回报分析——最佳盈利与最大亏损对比 连续亏损监控及警报 专业量化界面 无限滚动——同时监控无限制策略 彩色编码性能矩阵——即时可视化投资组合健康状况 完全可定制布局——适应您的分析流程 现代金融风格设计——专为专业交易者打造 机构级功能 实时数据流——毫秒级精准更新 魔术编号策略筛选——按算法类型组织 多品种性能跟踪——跨市场分析 投资组合级统计——全面的绩效总结 完全可定制 专业配色方案和排版 可调整的刷新率和显示行数 可配置的列布局和指标 个性化仪表盘偏好 改变您的交易操作方式 之前: 手动表格、分散的MT4窗口、延迟分析 之后: 实时投资组合仪表盘、自动化分析、专业报告 “我的量化交易系统中缺失的一环——终于有了机构级的监控工具!” 简单设置流程 将
Dynamic Fibonacci Grid
Tsvetan Tsvetanov
5 (1)
推出最新版本的 MT5 动态斐波那契网格仪表盘(Dynamic Fibonacci Grid Dashboard)。 全新版本配备了众多新功能,为您的交易体验带来彻底升级,并让您从全新的角度观察市场和价格行为。通过同时分析多个时间周期和多个交易品种,探索更多可能性。界面友好,支持手动交易和持仓管理,并大幅扩展了预设自动化策略的应用能力。此外,DFG 现在在策略测试器中可作为交易模拟器全面运行,您可以使用历史数据重现不同的交易环境。在可视化模式中练习手动交易,在高速模式中测试自动化策略。 主要功能 • 基于动态斐波那契通道(Dynamic Fibonacci Bands)的多周期、多品种高级技术分析。 通过我们的实时市场监控仪表盘,体验前所未有的高效分析能力。我们将来自 M1、M5、M15 和 H1 图表的复杂数据合成为易于理解的网格水平。这种独特呈现方式让交易者能够在同一个屏幕上监控 10 个不同品种的价格行为,而无需依赖传统图表。结果是更快速的决策过程,以及更简洁、不杂乱的交易环境。 • 可自定义且用户友好的界面,集成最重要的功能。 包括账户状态与信息、快捷手动交易与持仓管理按
Timeless Charts
Samuel Manoel De Souza
5 (8)
Timeless Charts is an all-in-one trading utility for professional traders. It combines custom chart types such as Seconds Charts and Renko with advanced order flow analysis using Footprints , Clusters , Volume Profiles , VWAP studies, and anchored analysis tools for deeper market insight. Trading and position management are handled directly from the chart through an integrated trade management panel , while Market Replay and Virtual Accounts provide environments for practicing trading skills and
Mentfx Mmanage mt5
Anton Jere Calmes
4.25 (8)
The added video will showcase all functionality, effectiveness, and uses of the trade manager. Drag and Drop Trade Manager. Draw your entry and have the tool calculate the rest. Advanced targeting and close portions of a trade directly available in tool (manage trades while you sleep). Market order or limit order on either side with factored spread. Just draw the entry, the tool does the rest. Hotkey setup to make it simple. Draw where you want to enter, and the stop loss, the tool calculates al
EasyInsight AIO MT5
Alain Verleyen
4.92 (12)
EASY Insight AIO – 全能智能交易一站式解决方案 概述 想象一下,您可以在几秒钟内扫描整个市场——外汇、黄金、加密货币、指数,甚至股票——无需手动筛选图表、繁琐安装或配置指标。 EASY Insight AIO 是您专为 AI 交易打造的即装即用数据导出工具。它将整个市场快照一次性输出为简洁的 CSV 文件,直接支持 ChatGPT、Claude、Gemini、Perplexity 等各类 AI 平台的即时分析。 无需窗口切换,无需图表叠加,也没有任何杂乱。只需纯净、结构化的数据自动导出,让您专注于基于数据的高效决策,无需再盯盘耗时。 为什么选择 EASY Insight AIO? 真正的一体化 • 无需设置,无需安装指标,无图表叠加。只需安装、运行并导出——就是这么简单。 多资产全覆盖 • 扫描分析外汇、金属、加密货币、指数、股票——您的券商所能提供的一切市场。 AI 专属数据导出 • 高度结构化、针对 AI 优化的 CSV 文件,直接适配主流智能工具和平台。 完整导出内容: • 三个可选周期的货币强度分析 • 净多头头寸变化体现市场情绪 • 成交量变化、
VERON LINK MASTER MT5 — Real-time Multi-Account Dashboard & Sync Controller Veron Link Master is a high-performance, centralized monitoring and synchronization control center designed for MetaTrader 5. Built specifically for traders managing multiple accounts, prop firm portfolios, grid/martingale EAs, or client networks, Veron Link Master provides a seamless, ultra-modern dark-themed GUI dashboard directly on your MT5 terminal. Pricing Structure: Take advantage of our early-bird pricing before
作者的更多信息
Close Button
Wang Yu
4.76 (38)
所有MQL5 EA产品,付费100RMB加入VIP会员即可全部无限制使用,详情请咨询客服QQ407776353 所有MQL5 EA产品,付费100RMB加入VIP会员即可全部无限制使用,详情请咨询客服QQ407776353 所有MQL5 EA产品,付费100RMB加入VIP会员即可全部无限制使用,详情请咨询客服QQ407776353 所有MQL5 EA产品,付费100RMB加入VIP会员即可全部无限制使用,详情请咨询客服QQ407776353 所有MQL5 EA产品,付费100RMB加入VIP会员即可全部无限制使用,详情请咨询客服QQ407776353 所有MQL5 EA产品,付费100RMB加入VIP会员即可全部无限制使用,详情请咨询客服QQ407776353 所有MQL5 EA产品,付费100RMB加入VIP会员即可全部无限制使用,详情请咨询客服QQ407776353
FREE
如果产品有任何问题或者您需要在此产品上添加功能,请联系我 Contact/message me if you encounter any issue using the product or need extra feature to add on the base version. You can get the free Close Button MT4 version at LINK . Close Button provides you an intuitive, effective, and handy way to close your orders and/or positions based on their type and their profit status. The tool provides seven close options: Close All: close all pending orders and positions. Close Profit: close all positions which are in profit. Close L
FREE
如果产品有任何问题或者您需要在此产品上添加功能,请联系我 Contact/message me if you encounter any issue using the product or need extra feature to add on the base version. PA Touching Alert is a tool to free you from watching price to touch certain critical price levels all day alone. With this tool, you can set two price levels: upper price and lower price, which should be greater than/less than the current price respectively. Then once price touches the upper price or lower price, alert and/or notification would be sent
FREE
如果产品有任何问题或者您需要在此产品上添加功能,请联系我 Contact/message me if you encounter any issue using the product or need extra feature to add on the base version. Floating Highest Lowest MT5 provides you an intuitive and user-friendly method to monitor the floating highest (profit) and lowest (loss) that all your trades together ever arrive. For example, I opened 3 orders, which arrived at $4.71 floating profit when trade following trend. Later when the trend is against me, these 3 orders arrive $30 in loss, and a
FREE
如果产品有任何问题或者您需要在此产品上添加功能,请联系我 Contact/message me if you encounter any issue using the product or need extra feature to add on the base version. Session TakeProfit StopLoss is basically helping to set the take profit and stop loss in dollar for the total open orders (session). Once the total profit is greater than session_tp or less than session_sl, the EA will help to close all open orders acting similarly to a take profit/stop loss for a single order. Inputs session_tp: session take profit ses
FREE
所有MQL5 EA产品,付费100RMB加入VIP会员即可全部无限制使用,详情请咨询客服QQ407776353 所有MQL5 EA产品,付费100RMB加入VIP会员即可全部无限制使用,详情请咨询客服QQ407776353 所有MQL5 EA产品,付费100RMB加入VIP会员即可全部无限制使用,详情请咨询客服QQ407776353 所有MQL5 EA产品,付费100RMB加入VIP会员即可全部无限制使用,详情请咨询客服QQ407776353 所有MQL5 EA产品,付费100RMB加入VIP会员即可全部无限制使用,详情请咨询客服QQ407776353 所有MQL5 EA产品,付费100RMB加入VIP会员即可全部无限制使用,详情请咨询客服QQ407776353 所有MQL5 EA产品,付费100RMB加入VIP会员即可全部无限制使用,详情请咨询客服QQ407776353
FREE
如果产品有任何问题或者您需要在此产品上添加功能,请联系我 Contact/message me if you encounter any issue using the product or need extra feature to add on the base version. Session TakeProfit StopLoss is basically helping to set the take profit and stop loss in dollar for the total open orders (session). Once the total profit is greater than session_tp or less than session_sl, the EA will help to close all open orders acting similarly to a take profit/stop loss for a single order. Inputs session_tp: session take profit ses
FREE
所有MQL5 EA产品,付费100RMB加入VIP会员即可全部无限制使用,详情请咨询客服QQ407776353 所有MQL5 EA产品,付费100RMB加入VIP会员即可全部无限制使用,详情请咨询客服QQ407776353 所有MQL5 EA产品,付费100RMB加入VIP会员即可全部无限制使用,详情请咨询客服QQ407776353 所有MQL5 EA产品,付费100RMB加入VIP会员即可全部无限制使用,详情请咨询客服QQ407776353 所有MQL5 EA产品,付费100RMB加入VIP会员即可全部无限制使用,详情请咨询客服QQ407776353 所有MQL5 EA产品,付费100RMB加入VIP会员即可全部无限制使用,详情请咨询客服QQ407776353 所有MQL5 EA产品,付费100RMB加入VIP会员即可全部无限制使用,详情请咨询客服QQ407776353
FREE
By applying this expert onto any char window, you are able to force download the historical data upon all time-frame (PERIOD_M1, PERIOD_M5, PERIOD_M15, PERIOD_M30, PERIOD_H1, PERIOD_H4, PERIOD_D1, PERIOD_W1, PERIOD_MN1) of 28 major pairs. The 28 major pairs are the combination of the 8 major currencies. 8 major currencies "USD", "EUR", "GBP", "JPY", "AUD", "NZD", "CAD", "CHF" 28 pairs "AUDCAD","AUDCHF","AUDJPY","AUDNZD","AUDUSD","CADCHF","CADJPY" "CHFJPY","EURAUD","EURCAD","EURCHF","EURGBP","E
FREE
如果产品有任何问题或者您需要在此产品上添加功能,请联系我 Contact/message me if you encounter any issue using the product or need extra feature to add on the base version. Dashboard Super Candle is an intuitive, and handy graphic tool to help you to: Have 28 pairs under control with one dashboard. Monitor candle direction, identify possible price movement and trend. Provide trading signals based on the candle direction selected by you. Automatically manage order once signal are generated. Have the ability to select which p
如果产品有任何问题或者您需要在此产品上添加功能,请联系我 Contact/message me if you encounter any issue using the product or need extra feature to add on the base version. There is Demo version of this panel Dashboard Super MA RSI CCI Demo in my product list, pls try it out to get familiar with all functionalities free . Dashboard Super MA RSI CCI is an intuitive, and handy graphic tool to help you to: Have 28 pairs under control with one dashboard Monitor price movement, identify possible trend based on MA, RSI, and CCI i
如果产品有任何问题或者您需要在此产品上添加功能,请联系我 Contact/message me if you encounter any issue using the product or need extra feature to add on the base version. Critical Support and Resistance is an intuitive, and handy graphic tool to help you to monitor and manage critical support and resistance price point easily with one glance to know status of all important S&R. Price is likely to pullback or breakout at important support and/or resistance. This indicator is designed to help you monitor these critical supp
如果产品有任何问题或者您需要在此产品上添加功能,请联系我 Contact/message me if you encounter any issue using the product or need extra feature to add on the base version. Dashboard Super Currency Strength is an intuitive, and handy graphic tool to help you to: Have 28 pairs under control with one dashboard. Monitor price movement, identify possible trend based on currency strength gap of two currency on 3 timeframe. Provide trading signals based on the CSM (currency Strength Meter) selected. Manage order automatically onc
如果产品有任何问题或者您需要在此产品上添加功能,请联系我 Contact/message me if you encounter any issue using the product or need extra feature to add on the base version. To access the free demo version, please re-direct to this LINK . To access the single pair version, please re-direct to this LINK . Price is likely to pullback or breakout at important support and/or resistance. This dashboard is designed to help you monitor these critical support and resistance area. Once price moves close to these important support and
如果产品有任何问题或者您需要在此产品上添加功能,请联系我 Contact/message me if you encounter any issue using the product or need extra feature to add on the base version. Please re-direct to LINK for free demo version. There are two critical components in a profitable trading system, one is entry (place an order), and another one is exit (close an order). You can exit by time: closing order after London Close for example. You can also exit by position: closing an order when price reaches a certain support/resistance level
如果产品有任何问题或者您需要在此产品上添加功能,请联系我 Contact/message me if you encounter any issue using the product or need extra feature to add on the base version. There are two critical components in a profitable trading system. One is entry (placing an order) and another one is exit (closing an order). You can exit by time: closing order after London Close, for example. You can also exit by position: closing an order when price reaches a certain support/resistance level. Easy RR Monitor Panel is an intuitive, and
Contact/message me if you encounter any issue using the product or need extra feature to add on the base version. There is a demo version of this panel Dashboard Trading Made Simple Demo in my product list, please try it out to get familiar with all functionalities free, LINK . This system basically utilizes TDI as the main indicator to generate trading signal mainly on H1 and H4 timeframes. The signal will be further filtered and trimmed. Stochastic; Heiken Ashi candle direction and candle siz
如果产品有任何问题或者您需要在此产品上添加功能,请联系我 Contact/message me if you encounter any issue using the product or need extra feature to add on the base version. There is a Demo version of this panel Dashboard Currency Strength Meter AdvancedDemo in my product list, please try it out to get familiar with all functionalities free, LINK . The Dashboard Currency Strength Meter Advanced gives you a quick visual guide to which currencies are strong, and which ones are weak over the customized 4 time-frames and period.
如果产品有任何问题或者您需要在此产品上添加功能,请联系我 Contact/message me if you encounter any issue using the product or need extra feature to add on the base version. There is Demo version of this panel Dashboard Super Three MA Demo in my product list, please try it out to get familiar with all functionalities free, LINK . This system basically utilizes PA and three adjustable Moving Average as the main indicator set to generate trading signal. With the feature that all MA_timeframe, MA_period, MA_applied_price are ad
如果产品有任何问题或者您需要在此产品上添加功能,请联系我 Contact/message me if you encounter any issue using the product or need extra feature to add on the base version. There is Demo version of this panel Dashboard Timeframe 15 Demo in my product list, please try it out to get familiar with all functionalities free, LINK . This system basically utilizes TDI as the core indicator to generate trading signal mainly on time-frame M15. The signal will be further filtered and trimmed by 1) 200 EMA and Price; 2) 10 EMA and Hei
如果产品有任何问题或者您需要在此产品上添加功能,请联系我 Contact/message me if you encounter any issue using the product or need extra feature to add on the base version. There is Demo version of this panel Dashboard Genesis Matrix Trading Demo in my product list, please try it out to get familiar with all functionalities free, LINK . This system basically utilizes Genesis Indi Set (TVI, CCI, GannHilo, and T3) as the core indicators to generate trading signal mainly on time-frame M15. The signal will be further filtered a
如果产品有任何问题或者您需要在此产品上添加功能,请联系我 Contact/message me if you encounter any issue using the product or need extra feature to add on the base version. There is Demo version of this panel Dashboard Symphonie Trader System Demo in my product list, please try it out to get familiar with all functionalities free, LINK . This system basically utilizes Symphonie Indicator Set (Extreme, Emotion, Trend, and Sentiment) as the core indicators to generate trading signal mainly on time-frame M15. The signal will b
如果产品有任何问题或者您需要在此产品上添加功能,请联系我 Contact/message me if you encounter any issue using the product or need extra feature to add on the base version. There is Demo version of this panel Dashboard Extreme TMA System Demo in my product list, please try it out to get familiar with all functionalities free, LINK . This system basically utilizes 4 TMA (Triangular Moving Average) slope indicators on 4 time-frame and TMA Band as the core indicators to generate trading signal mainly on time-frame M15. The sig
如果产品有任何问题或者您需要在此产品上添加功能,请联系我 Contact/message me if you encounter any issue using the product or need extra feature to add on the base version. DIBS = Daily Inside Bar Setup This system basically utilizes the popular candle pattern Inside Bar to generate trading signal mainly on time-frame H1. To facilitate you to understand and trade this system quickly and effectively, the collection of PDF manuals and tips are provided in my latest comment of this product. For who cannot access Google Drive,
如果产品有任何问题或者您需要在此产品上添加功能,请联系我 Contact/message me if you encounter any issue using the product or need extra feature to add on the base version. This system basically utilizes two simple moving averages (10 SMA and 197 SMA) over 2 hours before Tokyo Open to generate trading signal mainly on timeframe H1. The signal will be further filtered by 1) M15 and M5 Fractals; 2) Stochastic To facilitate you to understand and trade this system quickly and effectively, the collection of PDF manuals and tips
如果产品有任何问题或者您需要在此产品上添加功能,请联系我 Contact/message me if you encounter any issue using the product or need extra feature to add on the base version. There is Demo version of this panel Dashboard Babon Scalping System Demo in my product list, please try it out to get familiar with all functionalities for free, LINK . This system basically utilizes TDI, Heiken Ashi Trend, Price Trend on H1 time-frame and TMA on H1&H4 time-frame to generate the trend (big picture). Then the system will zoom in to genera
This indicator helps to visualize the Bollinger Band status of 28 pairs. With the feature of color panel, alert, and notification features, user can catch the potential Bollinger Bounce opportunities from 28 main pairs on one Dashboard quickly. Dashboard Bollinger Band is an intuitive and handy graphic tool to help you to monitor all 28 pairs and provide trading signals based on the Bollinger Bounce Rules (Overbought/Oversold and Bollinger Band Cross). COLOR LEGEND: clrOrange: price is above the
This indicator helps to visualize the Stochastic status of 28 pairs. With the feature of color panel, alert, and notification features, user can catch the potential buy and sell opportunities when the 28 main pairs cross the oversold/overbought area on one Dashboard quickly. Dashboard Stochastic is an intuitive and handy graphic tool to help you to monitor all 28 pairs and provide trading signals based on the Stochastic Classic Rules (Overbought/Oversold and Stochastic Cross). COLOR LEGEND: cl
This indicator helps to visualize the RSI status of 28 pairs. With the feature of color panel, alert, and notification features, user can catch the potential buy and sell opportunities when the 28 main pairs cross the oversold/overbought area on one Dashboard quickly. Dashboard RSI is an intuitive and handy graphic tool to help you to monitor all 28 pairs and provide trading signals based on the RSI Rules (Overbought/Oversold and Stochastic Cross). COLOR LEGEND: clrOrange: RSI signal is above th
This indicator helps to visualize the MACD status of 28 pairs. With the feature of color panel, alert, and notification features, user can catch the potential buy and sell opportunities when the 28 main pairs’ fast EMA cross the slow EMA on one Dashboard quickly. Dashboard MACD is an intuitive and handy graphic tool to help you to monitor all 28 pairs and provide trading signals based on the MACD Rules (Fast EMA Cross Slow). COLOR LEGEND: clrRed: MACD fast EMA down cross MACD slow EAM and MACD f
筛选:
无评论
回复评论