Dashboard Super Currency Strength MT5
- ユーティリティ
-
Wang Yu
 Providing quick Developments and Conversion of MT4/MT5 EAs, Indicators, Scripts, and Tools. If you are looking for an Dashboard EA to turn your trading strategy into auto trading algo and to manage multi trades in one chart with visualizing tool, come and visit http://www.ex4gzs.com/en for more
 - バージョン: 1.1
- アップデート済み: 23 11月 2021
- アクティベーション: 5
如果产品有任何问题或者您需要在此产品上添加功能,请联系我
Contact/message me if you encounter any issue using the product or need extra feature to add on the base version.
There is Demo version of this panel Dashboard Timeframe 15 Demo in my product list, please try it out to get familiar with all functionalities free, LINK.
To facilitate you to understand and trade this system quickly and effectively, the collection of PDF manual and all indicators are provided in my first comment of this product.
For who cannot access Google Drive, please find these resources in the thread or PM me.
- PDF Manual
- Two Indicators: place them under /MQL4/Indicators/
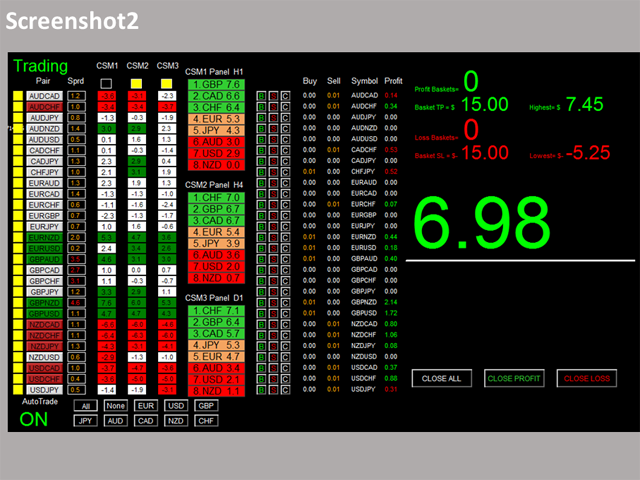
Dashboard Timeframe 15 is an intuitive and handy graphic tool to help you to:
- Have 28 pairs under control with one dashboard.
- Monitor all 28 pairs and provide trading signals based on the Timeframe15 system rules (see screenshot 1, 2, 3, and 4).
- Manage order automatically once signal are generated.
- Monitor your positions easily with one glance to know status of all trading pairs.
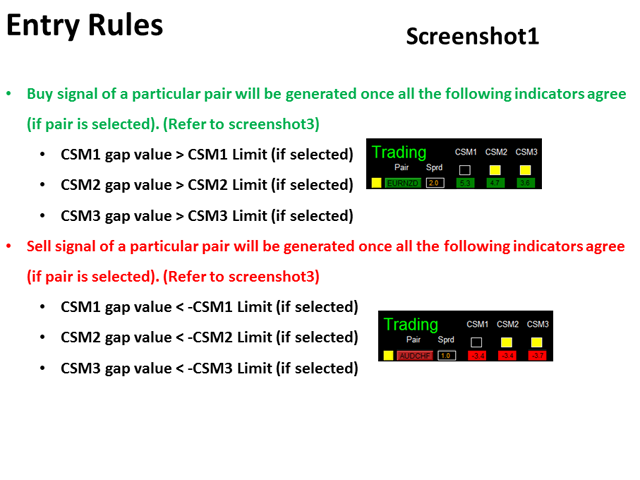
Entry Rules
Refer to screenshot 1, 2, 3, and 4
Important Action Items before Using Dashboard
- Download historical data of all 28 pairs. Use this free tool to download historical data by simple one-drag, link.
- Make sure you have all 28 symbols in Symbol window.
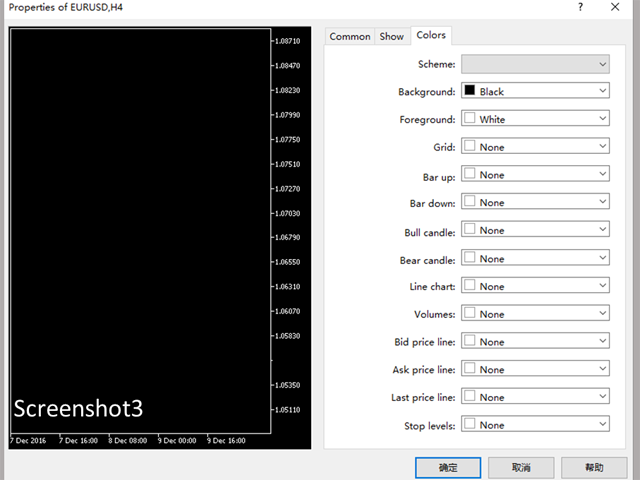
- To make your dashboard looks clear and neat, it’s better to apply the black template. Please refer to screenshot 6.
Input Parameters
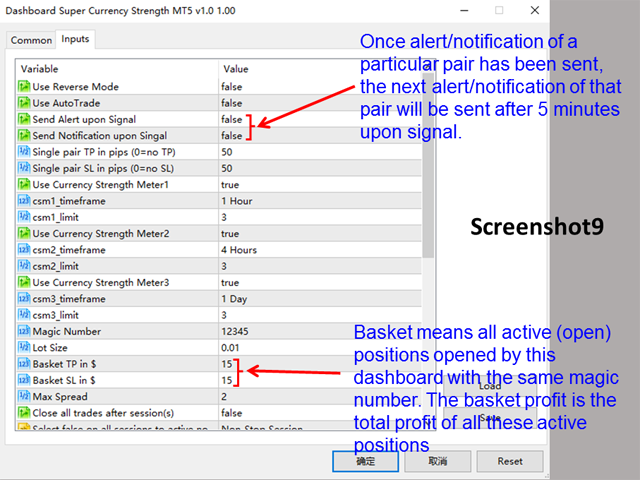
- Use AutoTrade
- Send Alert upon Signal (Refer to entry rule)
- Send Notification upon Signal (Refer to entry rule)
- Single pair TakeProfit in pips
- Single pair StopLoss in pips
- Use TDI Base Line
- Use TDI Momentum Indi
- TDI Momentum TH
- Use TDI over bought/sell Limit
- TDI overbought limit
- TDI oversold limit
- 200 EMA Period
- 10 EMA Period
- Use Round Number
- Round Number Limit
- Magic Number
- Lot Size:
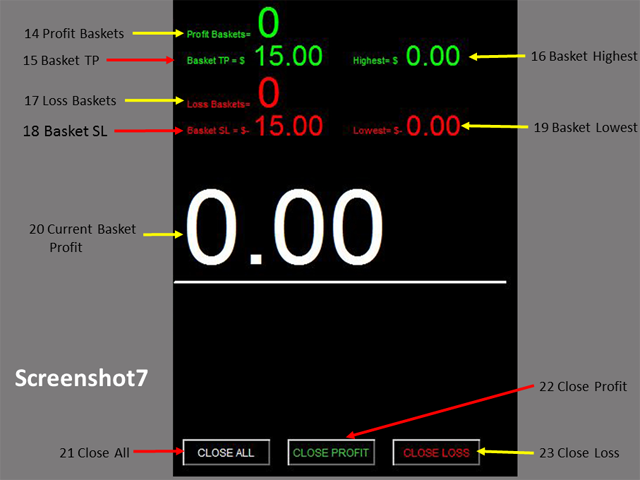
- Basket TakeProfit in $:(see explanation in Note1)
- Basket StopLoss in $
- Max Spread
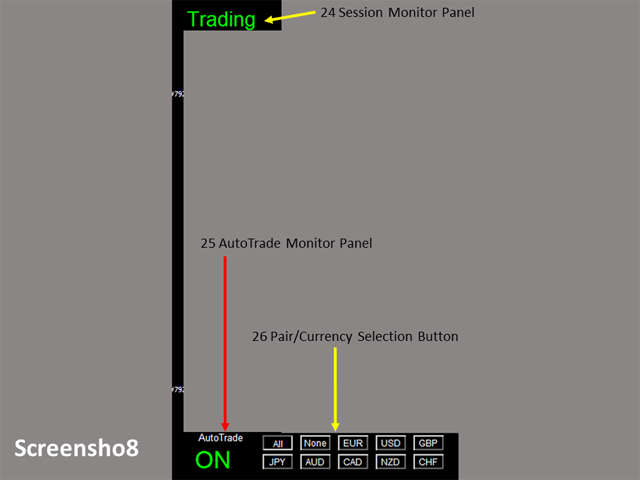
- Trading Session, if time is out of session, no order will be sent
- Close all trades after session(s)
- Note that: starting and ending time is your computer/local time, not server time
- Session Input, pls refer to other dashboard product description (Dashboard Super Currency Strength)
- Time-frame of new chart
- Suffix
- X_axis
- Y_axis
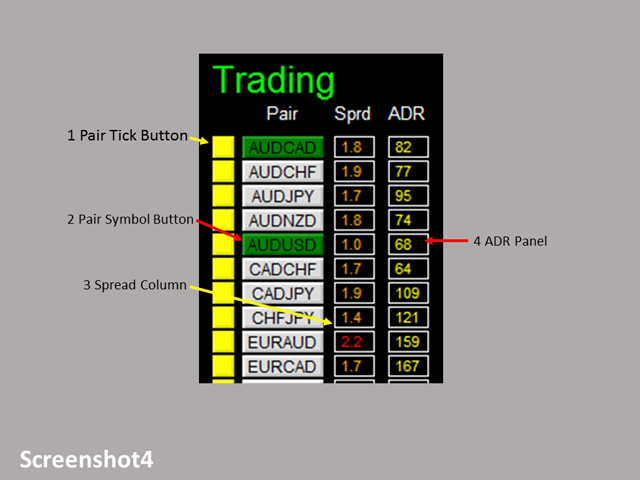
Dashboard Objects
Please refer to screenshot 7 to 11.
- Pair Tick Button
- Black->de-active
- Yellow->active
- Pair Symbol Button:
- Click on button to open a corresponding new window chart
- Spread column: show current spread of each pair.
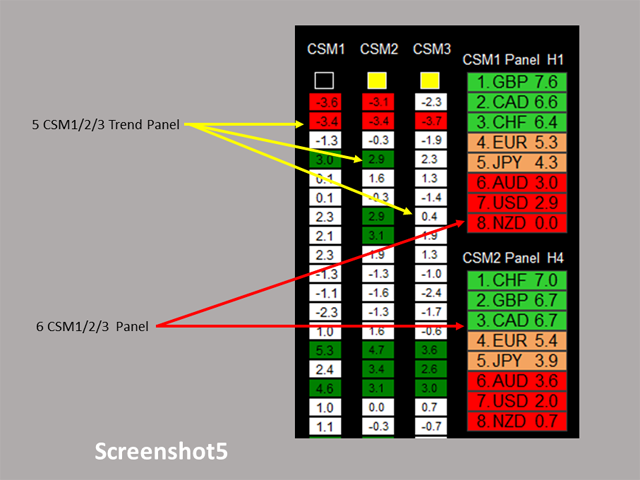
- Current and Previous TDI green vs red status Panel:
- TDI green>TDI red -> panel green
- TDI red>TDI green -> panel red
- Indicator Status Panel: indicates which indicator is selected to generate signal
- TDI Base Panel
- TDI price>=TDI base ->panel green
- TDI price<TDI base -> panel red
- TDI Momentum Panel:
- TDI momentum>Momentum limit -> panel green
- TDI momentum<(-Momentum limit) -> panel red
- Otherwise -> panel white
- TDI Price Panel
- Value>TDI overbought limit -> panel red ->sell only
- Value<TDI oversold limit -> panel green ->buy only
- Otherwise -> panel orange ->both
- 200 EMA Value
- Current Price
- 200 EMA Signal Panel
- Current Price>=200 EMA: panel green
- Current Price <200 EMA: panel red
- 10 EMA Value
- HA Close Value
- 10 EMA Signal Panel
- HA Close>=10 EMA ->panel green
- HA Close<10 EMA ->panel red
- Round Number Panel
- (100-RN_limit) < Last two digit < upper 100 ->panel red
- Lower 00 < Last two digit < RN_limit -> panel greed
- Otherwise ->panel orange
- For the rest objects description, please refer to other Dashboard product description (Dashboard Super Currency Strength), they are the same.
If you have any customized request and/or suggestion, please feedback to me.