Moonveil Survivors

# 月幕幸存者 (Moonveil Survivors) · MT5 原生像素割草生存游戏

> **交易盯盘闲暇时的终极解压利器!在 MetaTrader 5 图表上畅享纯正的肉鸽(Roguelike)像素割草与策略构筑体验。**

---

### 🌟 游戏概述

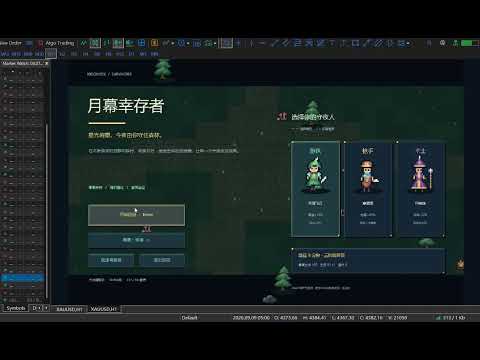
《月幕幸存者》(Moonveil Survivors)是一款专为 MetaTrader 5 平台深度定制的原生独立二维像素生存动作游戏。您将化身隐秘森林中的守夜人,在无尽涌现的虚空魔物狂潮中穿梭走位。武器全自动索敌轰炸,拾取经验晶石提升等级,在数十种武器与符文羁绊中自由构筑流派,达成超武进化,迎战史诗级阶段首领,最终直面虚空君主!

**真正做到 0 DLL 依赖、0 外部图片、0 交易风险!** 游戏完全基于 MT5 原生底层图形光栅化渲染,不读取任何行情数据、不连接账户、不发送任何订单,陪伴您度过每一个漫长而枯燥的盯盘时光。

---

### 🔥 核心特色

1. **纯原生图表渲染 (Pure Chart Canvas)**
   - 采用 MT5 原生 `<Canvas\Canvas.mqh>` 独立双缓冲光栅化引擎,画面采用 1152×720 逻辑高画质与自适应最近邻缩放。
   - 内置纯手绘像素精灵系统(Pixel Art),地表、水面、树木、角色与弹幕全内置预解算,无需安装任何外部资源文件或字体。

2. **三大风格迥异的守夜人角色**
   - **月刃游侠 (Nightblade Ranger)**:初始配备环绕飞刃,基础生命 100,移动速度 +10%,暴击率额外 +8%,近身贴脸走位收割型。
   - **星辉枪手 (Starlight Gunner)**:初始配备穿透弹,基础生命 100,基础伤害 +12%,经验拾取半径 +18px,超远距离贯穿杀伤型。
   - **雷纹术士 (Storm Arcanist)**:初始配备闪电链,基础生命 85,技能冷却缩减 12%,群体连锁减速控场型。

3. **五大自动武器与六级强化系统**
   - **环绕飞刃 (Orbiting Blades)**:环绕角色飞速旋转的贴身护体利刃。
   - **穿透弹 (Piercing Shots)**:直线高速穿甲弹,采用线段防穿模判定。
   - **星辉激光 (Starlight Beam)**:宽屏贯穿光束,毁灭路径上的一切敌人。
   - **闪电链 (Chain Lightning)**:在敌群间高频跳跃的雷电电弧,附带减速效果。
   - **范围火焰 (Flame Sanctum)**:在敌群脚下生成持续燃烧的灼烧火海。

4. **五大超武羁绊进化 (Weapon Evolutions)**
   无需看运气等待神秘宝箱!只要武器与副武器达到等级,系统**自动激活并永久生效**:
   - ⚡ **雷刃星环** = 飞刃 Lv4 + 闪电链 Lv2(飞刃数量增加,命中概率触发连锁闪电)
   - 💥 **爆炎穿甲弹** = 穿透弹 Lv4 + 火焰 Lv2(穿透子弹命中剧烈爆炸并生成火场)
   - 🌟 **三棱星轨** = 激光 Lv4 + 穿透弹 Lv2(激光进化为三向散射,大范围清屏)
   - ⛈️ **天罚火雨** = 闪电链 Lv4 + 火焰 Lv2(每一处雷击落点均引发持续烈焰轰炸)
   - ☀️ **日冕领域** = 火焰 Lv4 + 飞刃 Lv2(保留远程火场,额外生成随身移动的烈阳灼烧环)

5. **深度肉鸽流派构筑 (Roguelike Build)**
   - **8 种被动符文**:锋芒刻印 (伤害提升)、迅捷咏唱 (冷却缩减)、扩域符文 (范围扩大)、逐风之靴 (移速与冲刺)、生命枝芽 (血量上限)、月石磁核 (吸晶半径)、鹰眼徽记 (暴击爆伤)、复苏露珠 (秒回生命)。
   - **地图随机探索**:每局固定刷新 4 个强化宝箱与 4 座月泉祭坛(靠近即可使用,回血 30% 并全图吸取经验)。
   - **卡牌升级系统**:常规、稀有、史诗三档品质,自带重抽(Reroll)机会。

6. **三阶段史诗首领与无尽模式 (Endless Mode)**
   - 随时间推进遭遇动态兽潮冲击与精英突袭。
   - 在 30%、62% 时长遭遇“鹿角树王”,在 100% 时长直面终极首领“虚空君主”。
   - 击败首领后可解锁“无尽挑战”,血量回满,每 90 秒迎接一波全新魔物首领!

7. **动态帧率保护与高性能优化**
   - 采用 60 步/秒固定物理时间步进,内置对象池(Object Pooling)与空间网格碰撞优化。
   - 具备帧率自适应防护:当图表负载过重时,自动智能消减纯视觉粒子,确保战斗判定与操作绝不卡顿。

---

### 🎮 游戏操作指南

- **移动走位**:键盘方向键 `↑` `↓` `←` `→`(支持八向平滑移动,斜向速度已归一化校准)。
- **无敌冲刺**:`Shift` 键。朝当前移动方向快速翻滚冲刺,**冲刺期间完全无敌**,可瞬间穿透敌群与致命弹幕!
- **暂停 / 菜单**:`Ctrl` 或 `Esc` 键,或鼠标点击画面右上角的暂停图标 `[Ⅱ]`。
- **内置百科图鉴**:点击画面右上角问号图标 `[?]`,随时查看所有武器与超武合成公式(同时自动冻结战斗)。
- **升级选卡**:
  - 键盘 `←` `→` 选择卡牌,`Enter` 确认;亦可直接鼠标点击卡牌。
  - 按 `Ctrl` 消耗机会进行卡牌刷新(重抽)。
- **角色与难度选择**:主菜单中使用方向键切换角色与难度,按 `Enter` 开启征程。

> **💡 操作贴士**:运行脚本前请先在游戏图表上点击一次鼠标以获取窗口焦点;切换窗口前建议先按 `Ctrl` 或 `Esc` 暂停。

---

### ⚙️ 详细参数配置 (Input Parameters)

| 参数名称 | 默认值 | 取值范围 | 参数功能详解 |
| :--- | :---: | :---: | :--- |
| `InpTargetFPS` | 40 | 20 ~ 60 | **显示帧率上限**。固定 60 步/秒战斗逻辑下渲染的最大帧率。 |
| `InpMaxEnemies` | 280 | 100 ~ 480 | **同屏活动敌人硬上限**。老旧电脑建议设为 150~200。 |
| `InpEffects` | 2 | 0 ~ 2 | **粒子特效级别**。0 为精简、1 为均衡、2 为丰富极致。 |
| `InpAutoEffects` | true | true / false | **自适应特效降级**。持续低帧率时自动减少非必要粒子,绝不削弱武器伤害。 |
| `InpScreenShake` | true | true / false | **屏幕打击震动**。开启后在受到重击或击杀首领时提供打击震感。 |
| `InpSound` | false | true / false | **终端音效**。开启后在升级与关键事件触发 MT5 终端自带提示音。 |
| `InpRunMinutes` | 8 | 5 ~ 20 分钟 | **单局远征时长**。达到设定时间后终极首领虚空君主降临。 |
| `InpDifficulty` | 2 | 1 ~ 3 | **初始难度设定**。1 休闲、2 标准、3 噩梦(主菜单中可随时切换)。 |
| `InpMaxScale` | 1.5 | 0.75 ~ 2.0 | **最大画面缩放倍率**。自动根据图表可用窗口比例适配。 |
| `InpSeed` | 0 | 整数 | **随机序列种子**。0 为完全随机,固定正整数可重玩完全相同的随机路线。 |

---

### 🛡️ 安全与环境声明 (100% Safe)

- **无外部依赖**:不调用任何 Windows DLL,不需要开启“允许 DLL 导入”。
- **无交易行为**:本程序为独立展示/娱乐脚本,不读取账户资金,不读取任何行情 Tick,不开仓不平仓。
- **环境自愈恢复**:退出游戏(点击退出或删除脚本)时,图表背景色、坐标轴、滚动条、快捷键设置将自动 100% 还原,不残留垃圾图形对象。
- **推荐分辨率**:推荐图表可用空间在 **1152 × 720** 以上;窗口过小(低于 864 × 540)时会自动暂停并提示调整窗口。
推荐产品
If you've ever stared at a gold chart, done the math in your head three times, and still second-guessed your lot size right before entry - this tool was built for you. Current price: $39 - increases by $10 after every 20 purchases until reaching the final price of $89 . Next price: $49 . Complete Buyer Kit: 34 Professional Resources included at no additional cost. MT5 Presets, PDF Guides, Checklists, Mindmaps, Reference Cards, and Excel Workbooks - built from 8 years of developing structured XAU
Tick Volume Chart(跳动量图表) - 一款在 MetaTrader 5 中基于跳动量创建图表的独特工具。 借助 Tick Volume Chart ,您可以构建每根K线不是按时间,而是按设定的跳动量(tick数量)来形成的图表。这为您带来了标准时间图表无法提供的、分析市场活跃度的极致精度。您可以使用任何支持自定义交易品种的指标和EA交易。处理生成的图表就如同操作标准图表一样便捷。 与标准工具不同, Tick Volume Chart 让您能够依据真实交易强度而非时间间隔来分析市场。 Tick Volume Chart 的优势 支持每根BAR包含 固定跳动量 的图表。 借助内置的跳动量数据库,实现历史数据的 即时加载 。 数据实时更新, 与常规图表同步且无延迟 。 能够同时创建 多个跳动量图表 。 Tick Volume Chart 非常适用于哪些场景? 分析跳动量的积累与分配。 精准的进场和出场交易。 基于跳动量数据测试交易策略。 跳动量设置 默认设置包含以下数值: 50、100、200、300、400、500、600、700、800、900、1000 tick。 您可
Here   our more valuable tools SMC Trend Trading   ,  Easy SMC Trading  ,  Institutional SMC Architect Volume Analysis Tools  ,  Volume flow Profile  ,  Market volume profile  , FVG with Volume  , Liquidity Heatmap Profile  ,  Volume Spread Analysis Key Features 1.  Total Immersion UI (The "Blackout") Chart Masking:   Upon loading, the tool turns the background, grid, and candles pitch black. This hides the noise of the market ticks, allowing you to focus purely on your performance data withou
The utility displays the order book, as well as increases its depth, remembering the location of applications that have gone beyond the current "window" view. With the utility user can perform quick trading actions in one click - placing/cancelling/editing of explicit and hidden orders, and also opening/editing positions. Utility features The orders book display works only on those trading symbols for which it is broadcast by the broker. To reset the information about the rows that were recorde
Trade Manger
Israr Hussain Shah
Here   our more valuable tools SMC Trend Trading   ,  Easy SMC Trading  ,  Institutional SMC Architect Volume Analysis Tools  ,  Volume flow Profile  ,  Market volume profile  , FVG with Volume  , Liquidity Heatmap Profile  ,  Volume Spread Analysis You Give an Instruction: When you run the script, a window pops up with a dropdown menu. You choose exactly what you want it to do from the list (e.g., "Close Profit Only" or "Delete Pending Orders"). It Scans Your Positions: The script then reads
Expert TP SL v04 - Professional Trading Assistant with AI Motivation System Advanced manual trading tool with automatic risk management, overtrading protection, and intelligent psychological support for disciplined trading. PRODUCT OVERVIEW Expert TP SL v04 is a comprehensive trading assistant designed for manual traders who want to maintain emotional discipline while automating risk calculations. This isn't just another order placement tool - it's a complete trading psychology system that pr
PnL Manager Pro
Enechojo Victor Ayegba
PNL MANAGER PRO —    Automatic Exit Manager with Smart Risk Control Set your entry, walk away. PNL Manager Pro sets your stop loss and take-profits automatically, locks in profit in stages, moves you to breakeven, and trails the rest — all while keeping your risk inside the limit you set. Try Before You Buy: You can download and test the Pnl MANAGER  free demo version  on a demo acc
Order Type Ledger 读取的是本账户的挂单历史——而不是成交历史,统计的是每一笔发出的订单最终发生了什么。它不预测,也不建议。它从不查看交易结果,只统计结果类型:已成交、已取消、已过期、已拒绝。 为什么需要它:大多数交易工具只回顾已经成交的交易。一笔未被触及就过期的限价单、一笔被拒绝的止损单、一笔等了好几个小时才成交的订单——这些都不会出现在成交历史汇总中,因为它们从未成为一笔交易。订单历史标签会把它们一条条列出,但没有人把它们加总。"上个月挂出的限价单中有37%从未成交"——这是这个账户已经拥有的事实,只是从来没有被统计过。 设置步骤: 1. 将该EA拖到任意图表上。品种和周期都无关紧要——它读取的是账户的整个挂单历史,而不仅仅是它所运行的那张图表。 2. 面板出现在左上角,并根据本账户自身的挂单历史逐步填充。 3. 只有当订单数量发生变化时才会重新计算,检测周期为每60秒一次。不需要启动或配置任何东西。 4. 不需要其他任何操作。没有需要调整的数值设置。 输入参数(共四项,按此顺序): InpShowPanel(默认 true)——显示或隐藏面板。 InpPan
Blahtech Market Profile MT5
Blahtech Limited
5 (10)
Was: $249  Now: $99   Market Profile defines a number of day types that can help the trader to determine market behaviour. A key feature is the Value Area, representing the range of price action where 70% of trading took place. Understanding the Value Area can give traders valuable insight into market direction and establish the higher odds trade. It is an excellent addition to any system you may be using. Inspired by Jim Dalton’s book “Mind Over Markets”, this indicator is designed to suit the
SmartRAL
Jemy Yeferson Dimu Ludji
SmartRAL (Smart Risk Auto-Lot EA) SmartRAL: The Ultimate Risk & Lot Management Expert Advisor (EA) SmartRAL is an essential tool for traders who demand precise risk management and automated position sizing in MetaTrader 5. Stop guessing your lot size and let the algorithm handle the calculations. This EA allows you to trade with confidence by guaranteeing your risk exposure on every single trade, while offering absolute flexibility in setting your Stop Loss (SL). Key Features & Benefits Guarante
The Expert Advisor is used to create Renko chart, realtime updates, easy for technical analysis. Backtest your strategy with all indicators with Renko chart in MetaTrader 5. Parameters Box Size : input the number of box size. Show Wicks : if true , draw a candle with high/low. History Start: input the date to creat first candle. Maximum Bars: limit number of bars on renko chart How to use Attach the Expert Advisor to a chart (timeframe M1), for which you want to create a renko. Input box size a
Trading Utility for Forex Currency Pairs Only not for Gold  Functions Auto Lot Calculation based on Risk Auto stoploss  Auto TakeProfit Breakeven Auto Close Half % Close in percentage with respect to the PIPs Pending Orders BuyLimit Sell Limit with distances BuyStop Sell Stop    with distances Trading Informations Risk in percentage For Multiple trades Combine Takeprofit and Combine Stoplosses
StrategyDeck — a cockpit for manual, discretionary trading. StrategyDeck draws and measures. It does not decide, and it never sends an order on its own. What it draws on the chart Opening range boxes for the Asia, Europe and US sessions, a linear regression channel, previous-day high and low with the day's open, and key candlestick patterns. Each drawing layer can be turned off, set to drawing only, or set to signal — and the signal position exists only where a measured scope is available.
Bastion is a monitor-and-close-only risk manager for prop-firm traders. It watches your account against your firm's daily-loss and maximum-drawdown limits in real time and force-closes your open positions BEFORE you cross a line. It never opens a trade of its own, so it stays fully within the tools allowed by FTMO, FundedNext, The5ers, FTUK and FXIFY. Why traders fail challenges A large share of failed evaluations end on a single daily-loss breach: a moment of inattention, a news spike, one tra
Quick deals EA
Aleksandr Slavskii
Горячие клавиши плюс клик левой кнопки мыши на графике. Советник открывает сделки, выставляет лимитные и стоповые ордера, удаляет ордера и закрывает позиции, также  делает реверс  открытых позиций, выставляет прописанные в настройках стоп лосс и тейк профит. (реверс только на неттинговых счетах) При запуске советника можно посмотреть подсказку как действует советник при нажатии клавиши + клик на графике. Правее последнего бара, ниже цены Ctrl+ЛКМ  - OpenSell Правее последнего бара, выше цены C
Apex Signal Stream – Trade Panel Version 2.43 | For MetaTrader 5 Overview Apex Trade Panel is a fully on-chart trading panel with two modes: Manual — precise control over every order, from lot sizing and SL/TP logic to trailing methods and batch close filters; and SignalStream auto-trade — the panel polls the Apex Signal Stream server over HTTPS and executes incoming signals behind 10 safety gates, reporting every outcome back. One panel, two ways to trade — and nothing enters your account that
该指标建立当前报价,可以与历史报价进行比较,并在此基础上进行价格走势预测。指示器有一个文本字段,用于快速导航到所需日期。 选项: 符号 - 选择指标将显示的符号; SymbolPeriod - 选择指标从中获取数据的时段; IndicatorColor - 指示器颜色; HorisontalShift - 由指标绘制的报价移动指定的柱数; Inverse - true 反转引号,false - 原始视图; ChartVerticalShiftStep - 图表垂直移动(键盘上的向上/向下箭头); 接下来是文本字段的设置,您可以在其中输入日期,您可以通过按“回车”立即跳转到该日期。 接下来是文本字段的设置,您可以在其中输入日期,您可以通过按“回车”立即跳转到该日期。
Trade History By Magic Indicator Unlock Your Trading Insights with Trade History By Magic! Enhance your MetaTrader 5 experience with this powerful indicator designed for traders who demand precision and clarity. Trade History By Magic provides a clear, real-time display of your trading history, organized by magic numbers, directly on your chart. Perfect for both automated and manual traders, this tool helps you track performance effortlessly. Key Features: Organized Trade Tracking : Displays tra
Painel Nelogica ChartTrading
Tiago Silvano Souza Felipe
Painel Profit is an operational trading panel for MetaTrader 5 created to make manual execution and visual order management easier directly on the chart. The operating principle is simple: the trader selects the symbol, timeframe, volume, entry type, and exit strategy. Based on these commands, the panel sends or organizes the trade through the interface, displaying the entry, take profit, and stop loss levels on the chart for visual monitoring. This product is not a signal robot and does not mak
Here   our more valuable tools SMC Trend Trading   ,  Easy SMC Trading  ,  Institutional SMC Architect Volume Analysis Tools  ,  Volume flow Profile  ,  Market volume profile  , FVG with Volume  , Liquidity Heatmap Profile  ,  Volume Spread Analysis The    Liquidity Heatmap   is a sophisticated institutional trading tool designed to reveal where over-leveraged traders are trapped. By calculating estimated liquidation levels based on volume spikes and leverage, this indicator draws a dynamic "h
Risk Ruler
AL MOOSAWI ABDULLAH JAFFER BAQER
Risk Ruler Plan every trade with precision before you enter the market. Risk Ruler is a professional on-chart position sizing and risk management tool for MetaTrader that helps traders calculate the optimal trade size based on their predefined risk. By simply dragging the Entry, Stop Loss, and Take Profit lines directly on the chart, all essential trading calculations update instantly, allowing you to make informed decisions before placing a trade. Designed for both manual and professional trade
SL Risk Manager Auto SL System SL Risk Manager Auto SL System 是一款简单实用的工具,可以帮助交易者在 开仓前和开仓后轻松管理止损(Stop Loss) 。 使用本工具,您可以在开仓之前提前设置止损水平。特别是在交易 黄金(XAU) 时,您可以根据 美元金额 设置止损,从而更加直观地控制每笔交易的风险。 您还可以通过控制面板,根据自己设定的比例和参数 自动开仓 。 对于已经开仓的交易,您可以随时快速更新止损水平。止损可以按照以下方式进行管理: 美元金额止损 点数(Pip)止损 此外,本工具也支持对**挂单(Pending Orders)**进行止损管理。您可以在订单成交之前提前设置和调整风险控制水平。 我们的控制面板设计得 简单、清晰、实用 ,无需复杂的操作。您可以在任何时候根据市场情况快速更新止损水平。 主要功能 开仓前设置止损 支持黄金(XAU)美元金额止损 支持点数(Pip)止损管理 更新已有持仓的止损 管理挂单的止损 根据设定的参数自动开仓 简洁易用的控制面板 快速灵活的风险管理 简单。实用。灵活。 使用 SL Ris
What if you could finally SEE where the market really wants to go? Most traders watch price. Pros watch VOLUME — where the money was actually traded. Volume Profile Fibo Confluence puts that reading right in front of you, in plain language, no jargon. WHAT YOU SEE ON YOUR CHART • The POC, the most-traded price: the market's natural magnet • The value area (VAH / VAL): the "house" where price spends its time • Automatic Fibonacci retracement + the golden pocket • Low-volume nodes
BoxChart MT5
Evgeny Shevtsov
5 (7)
The market is unfair if only because 10% of participants manage 90% of funds. An ordinary trader has slim changes to stand against these "vultures". This problem can be solved. You just need to be among these 10%, learn to predict their intentions and move with them. Volume is the only preemptive factor that faultlessly works on any timeframe and symbol. First, the volume appears and is accumulated, and only then the price moves. The price moves from one volume to another. Areas of volume accumu
BTC Trading Assistant EA (MT5) Manual trading assistant that helps place and manage trades with automated risk and stop management. Overview BTC Trading Assistant EA is a utility Expert Advisor for MetaTrader 5 intended for manual traders. It provides a chart interface to execute BUY/SELL/CLOSE actions and automates selected trade management functions such as position sizing, initial SL/TP placement, break-even, trailing stop and optional partial profit taking. This EA does not generate trade si
Order Book, known also as Market Book, market depth, Level 2, - is a dynamically updated table with current volumes of orders to buy and to sell specific financial instument at price levels near Bid and Ask. MetaTrader 5 provides the means for receiving market book from your broker, but in real time only, without access to its history. The indicator OrderBook Cumulative Indicator accumulates market book data online and visualizes them on the chart. In addition, the indicator can show the market
SwiftEdge Scalper 具有完全手动控制的专业跳动点剥头皮EA 剥头皮交易需要瞬间决策、精确的风险管理和无缝的订单执行。在观察价格走势的同时管理盈亏平衡计算、追踪止损和多个仓位,没有合适的工具是难以应付的。 SwiftEdge Scalper是为活跃的剥头皮交易者和日内交易者设计的专业交易助手。通过一键点击或键盘快捷键执行交易,而EA自动处理盈亏平衡、追踪止损和仓位管理。这不是自动交易机器人——只有当您决定时才会交易。 了解更多: 完整设置指南和文档 (English) 限时优惠: 前50次下载免费!之后该产品将变为付费。立即下载以获取免费副本。 主要功能 一键交易: 通过面板按钮或可自定义的键盘快捷键(B/S/A/C/E/M)即时执行买入/卖出 智能盈亏平衡: 包含点差和佣金的成本感知BE计算——永不因交易成本亏损 激进追踪: 自动追踪止损,随着价格朝有利方向移动逐跳锁定利润 双重TP/SL模式: 选择固定点数或基于ATR的动态水平以适应市场波动 剥头皮模式: 相反方向键立即平仓——完美适用于快速反转 扩展功能: 在强势趋势中即时放大您的TP/SL 可拖动面板: 完全可自
Volume flow Profile
Israr Hussain Shah
大师版是一款专业级的分析工具,旨在通过成交量和资金流向的视角来可视化市场结构。与标准的成交量指标不同,该工具直接在图表上显示每日成交量分布,让您准确看到价格发现发生的位置以及“聪明钱”的定位。 此大师版专为清晰度和速度而设计,具有独特的自动主题同步系统,加载后即刻美化您的图表布局。 主要特点: 真实资金流向计算: 超越标准的跳动量。启用“Use Money Flow”时,成交量按价格加权,揭示了特定价格水平的实际资金投入。 价值区域 (VA) 可视化: 自动计算价值区域(默认为成交量的70%)。 VA填充: 为价值区域背景着色,以便即时识别控制区域。 关键水平: 清晰标记控制点 (POC)、价值区域高点 (VAH) 和价值区域低点 (VAL)。 专业标记系统: 扫描概况结构以识别关键交易区域: HVN (高成交量节点): 接受和盘整区域(支撑/阻力)。 LVN (低成交量节点): 拒绝区域或“快速通过”区域。 所有标记均向右绘制延长线,便于监控。 Delta 背离(左侧直方图): 左侧直方图可视化每个级别的买卖压力对比。这有助于识别隐藏的背离——即价格可能上涨,但卖家在这些水平上激进打
VM Auto SLTP Basic
Van Minh Nguyen
5 (1)
VM Auto SLTP Basic - Intelligent Trade Management for Scalpers Enhance your scalping strategy to a higher level. VM Auto SLTP Basic automatically manages Stop Loss and Take Profit for orders that are opened manually or by other Expert Advisors. This tool does not open trades on its own, allowing you to maintain full control while enjoying precise risk management. Full documentation available in the product blog:   [User Guide] Key Features SL/TP based on ATR or fixed price Automatic SL move to B
FREE
CosmiCLab FIBO
Kirils Subins
CosmiCLab SMC FIBO CosmiCLab SMC FIBO is a professional trading indicator designed for traders who use Smart Money Concepts (SMC), market structure analysis and Fibonacci retracement levels. The indicator automatically detects market swings and builds Fibonacci levels based on the latest impulse movement. It also identifies market structure changes such as BOS (Break of Structure) and CHOCH (Change of Character), helping traders understand the current market direction. CosmiCLab SMC FIBO also pr
该产品的买家也购买
Trade Assistant MT5
Evgeniy Kravchenko
4.43 (215)
它有助于计算每笔交易的风险,容易安装新的订单,具有部分关闭功能的订单管理, 7 种类型的追踪止损和其他有用的功能。   附加材料和说明 安装说明   -   应用程序说明   -   模拟账户应用程序的试用版 线条功能  - 在图表上显示开仓线、止损线、止盈线。 有了这个功能,就可以很容易地设置一个新的订单,并在开仓前看到它的附加特性。   风险管理  - 风险计算功能在考虑到设定的风险和止损单的大小的情况下,计算新订单的成交量。它允许你设置任何大小的止损,同时观察设定的风险。 批量计算按钮 - 启用 / 禁用风险计算。 在 " 风险 " 一栏中设置必要的风险值,从 0 到 100 的百分比或存款的货币。 在 " 设置 " 选项卡上选择风险计算的变量: $ 货币, % 余额, % 资产, % 自由保证金, % 自定义, %AB 前一天, %AB 前一周, %AB 前一个月。   R/TP 和 R/SL - 设置止盈和止损的关系。 这允许你设置相对于损失的利润大小。 例如, 1 : 1 - 这决定了 TP = SL 的大小。 2 : 1 - 这意味着 TP 是 SL 的两倍。 RR -
欢迎来到 Trade Manager EA——这是一个终极风险管理工具,旨在使交易变得更直观、精准和高效。它不仅仅是一个下单工具,而是一个用于无缝交易计划、仓位管理和风险控制的全面解决方案。不论您是新手交易员、资深交易员,还是需要快速执行的剥头皮交易员,Trade Manager EA 都可以满足您的需求,适用于外汇、指数、大宗商品、加密货币等各种市场。 借助 Trade Manager EA,复杂的计算已成过去。只需分析市场,在图表上用水平线标记入场、止损和止盈,设置您的风险水平,Trade Manager 就会立即计算出理想的头寸规模,并实时显示以点、账户货币计价的止损和止盈。每笔交易都得以轻松管理。 主要功能: 头寸规模计算器 :根据定义的风险瞬间确定交易规模。 简单的交易计划 :在图表上用可拖动的水平线直接计划交易,设置入场、止损和止盈。 实时显示 SL 和 TP :以账户货币、点或分显示止损和止盈,便于分析。 高级保护工具 盈亏平衡选项 : 基本盈亏平衡 :当您的交易达到设定水平时自动保护利润。 多级盈亏平衡 :设置多达 4 个级别以逐步保护利润。 尾随止损选项 : 基本尾随
Local Trade Copier EA MT5
Juvenille Emperor Limited
4.94 (148)
Local Trade Copier EA MT5 是一款快速、灵活的交易复制工具,用于在同一台 Windows 电脑或 Windows VPS 上的多个 MetaTrader 5 账户之间复制和管理交易。 它将本地交易同步与 Receiver 端的手数管理、风险管理、交易过滤、品种映射、交易管理和账户保护功能结合在一起。 只需约 1 分钟 即可完成 Transmitter 和 Receiver 终端的设置,并可在同一经纪商或不同经纪商的账户之间复制手动交易或 EA 交易。在合适的条件下,本地 MetaTrader 终端之间的交易信息可以在 0.5 秒以内 完成同步。实际交易执行速度取决于经纪商延迟、网络状况、电脑/VPS 性能以及终端负载。 购买前先试用免费演示版 您可以在 MT5 模拟账户上测试 功能完整的 Local Trade Copier EA MT5 免费演示版 ,每次可使用 4 小时 : 下载 Local Trade Copier EA MT5 免费演示版 将下载的文件放入: MT5 → 文件 → 打开数据文件夹 → MQL5 → Experts 然后重新启动 MT
================================================================================ POC BREAKOUT - V20.72. Full Professional Grade Toolkit ================================================================================ POC Breakout is a full MetaTrader 5 trading dashboard for discretionary traders who want breakout signals, Point of Control (POC) context, volume profiles, order flow, market structure, news, alerts, and advanced trade planning in one professional workspace. Attached directly to you
TradePanel MT5
Alfiya Fazylova
4.88 (168)
交易面板是一款多功能交易助手。该应用包含超过50种手动交易功能,并允许您自动执行大多数交易任务。 应用程序说明 + 视频教程: https://www.mql5.com/zh/blogs/post/772452 用于模拟账户的应用程序试用版: https://www.mql5.com/zh/blogs/post/762579 如何安装应用程序: https://www.mql5.com/zh/blogs/post/762580 如何在可视化模式下测试应用程序: https://www.mql5.com/zh/blogs/post/770278 如何在VPS MetaTrader上安装应用程序: https://www.mql5.com/zh/blogs/post/770196 贸易. 只需单击一下即可执行交易操作: 打開掛單和頭寸,並自動計算風險。 一鍵打開多個訂單和頭寸。 打開訂單網格。 按組別關閉掛單和頭寸。 反轉頭寸方向(關閉買入>打開賣出,關閉賣出>打開買入)。 鎖定頭寸(通過開啟缺少的頭寸,使買入和賣出頭寸的數量相等)。 一鍵部分關閉所有頭寸。 將所有頭寸的止盈和止損設置在同
Telegram to MT5 Multi-Channel Copier   可将您 Telegram 频道中的交易信号自动复制到 MetaTrader 5。无需机器人、无需浏览器扩展、无需手动复制。信号一到 Telegram,EA 几秒内就在您的终端开仓。 在复制某个频道之前,内置回测器还能告诉您该频道在您的账户上会有怎样的表现。 产品包含两个组件:一个监听您 Telegram 频道的 Windows 应用程序,以及在 MT5 终端执行信号的本 EA。同时提供 MT4 版本   点此 . 设置指南与应用下载:   https://www.mql5.com/en/blogs/post/768988 当前价格将来会上调。 工作原理 Windows 应用通过您自己的 API 凭据连接 Telegram——不是机器人。这意味着它可以读取您订阅的任何频道、群组或话题,包括私有和 VIP 频道。您还可以把直接给您发消息的信号机器人、私聊,甚至自己的"收藏夹"(Saved Messages)用作信号来源。检测到信号后,应用会解析并交给 EA。EA 按您的经纪商解析品种名称,按您的风险设置计算手数并
Farmed Hedge Yield Farming | All Markets (Manual - Hybrid - Semi/Automated EA) VERIFIED TRADING RESULTS - Farmed Hedge Yield Axi Copy:  https://www.mql5.com/en/signals/2356376 - Farmed Hedge Yield Exn Copy:   https://www.mql5.com/en/signals/2356404 - Farmed Hedge Yield V Copy:  https://www.mql5.com/en/signals/2357156 IMPORTANT NOTICE: FarmedHedge is a MANUAL-FOCUSED TRADING UTILITY ,not a fully automated EA. Results shown on this Signal include manual trades and overall strategic management.
按照自己的交易规则复制 Telegram 信号 Telegram to MT5 Signal Trader 可将 Telegram 公开及私密频道和群组中的文字交易信号自动复制到 MetaTrader 5。通过一个桌面应用管理多个信号提供者和 MT5 账户,并为 每个提供者单独设置风险和交易参数 。 复制信号无需 Telegram 机器人,也无需配置 API。 只需通过手机号或二维码登录您自己的 Telegram 账户,然后选择您已加入的频道或群组。您无需创建机器人,也无需提供 Telegram API 令牌、API ID 或 API hash。 自行选择仓位大小,将平仓分配到多个止盈价位,并自动执行保本止损和移动止损。在跟随信号提供者的同时,掌握信号的实际交易方式。 本产品由这款 MT5 EA 和必须配合使用的 Windows 桌面应用组成。请参阅 安装指南及应用下载 。 管理多个信号提供者和账户 为每个提供者单独设置: 为每个频道设置专属的仓位计算方式、入场规则、止损、止盈和交易管理参数。 灵活分配至不同账户: 将同一提供者的信号复制到多个已连接的 MT5 账户,并为每个账户使用不
Strategy Ledger Pro
Abdullah Uygar Tuna
5 (2)
Strategy Ledger Pro 是一个面向 MetaTrader 5 的只读账户分析面板。它按 EA、策略、品种和魔术号分别呈现账户结果。 详细 手册 ,逐项说明每个功能。 MetaTrader 只显示整个账户的一个余额。当多个 EA 同时交易时,这个余额无法显示各自的贡献。Strategy Ledger Pro 读取账户历史,重建已平仓的持仓,将它们归属到各个策略,并在一个面板中呈现结果。 本产品不会开仓、修改或平仓。它不包含任何交易策略,不创建指标,也不读取图表价格。 主要功能 按 EA、单个策略、品种或魔术号统计结果。 预设周期和自定义日期范围。 已实现与浮动结果、持仓敞口、交易统计、点数、回撤和净值曲线。 佣金、隔夜利息、成本占比,以及入场和出场滑点估算与合计。 基于固定规则的表现评级、文字总结和状态标记。 交易组:同时开立的持仓在置信指标中算作一次决策。 账户和每一行的实时净值回撤跟踪。 交互式命名、分组、移动、隐藏、恢复、展开和排序。 身份:将一个魔术号声明为一个或多个策略;把魔术号或手数从面板上移除,并报告它们的价值。 固定手数模式:以统一手数回放每一笔交易,
Telegram To MT5 Ultra
Mirel Daniel Gheonu
5 (5)
Telegram To MT5 — 信号复制器 将您的 Telegram 频道中的交易信号变成真实的 MT5 订单 — 自动执行,可用于任意数量的账户,风险与规则完全由您掌控。 Telegram To MT5 将您已在 Telegram 关注的 VIP / 信号频道连接到您的 MetaTrader 5 终端。一个免费的配套桌面应用读取消息(即使是禁止机器人的频道),而本 EA 在您的账户上执行这些信号 — 应用您自己的风险设置、品种映射、止盈处理、交易时段与新闻过滤。 它是一个信号复制器,而非黑箱策略:由您决定信任哪些频道,以及每笔交易如何计算手数和管理。 分步设置与配套应用安装指南 工作原理 [您的 Telegram 频道] -> [配套桌面应用] -> [MT5 + 本 EA] -> 订单 配套桌面应用(免费,已包含)使用您的 Telegram 账户登录并监视您所选择的频道。即使是禁止机器人的 VIP 频道也能正常工作,它通过一个私有、加密的本地桥接转发每条消息。 本 EA 挂在一个图表上,在 MT5 接收这些信号,并按照您的规则开仓 / 管理交易。 应用与 EA 之间的连接是位于
Premium Trade Manager - 内置交易导师的图表面板 Premium Trade Manager 将一位交易导师嵌入您的图表,并在其下搭载完整的执行引擎。像往常一样建立交易,然后让您的 AI 交易导师 Max 读取这笔具体的交易,结合您的实时账户给出直接判断,再由您决定是否下单:止损是否符合纪律化交易的要求、风险规模是否合理、高影响新闻事件是否即将发布、您是否接近资金盘限额。其下是完整的执行引擎,负责点击之后的一切:一键按风险下单、您在图表上拖动规划且交易进行中仍可随时调整的计划、最多四个分批止盈级别、七种移动止损方式、实时资金盘合规检查、新闻屏蔽保护,以及对自身成本进行评级的点差功能。决策由您做出。Max 给出第二次审视。面板负责此后的一切。 购买前先亲手体验。 直接在浏览器中点击实时面板,这是在购买前感受其工作方式的最快途径。 stein.investments/products/premium-trade-manager Max 是您的一对一 AI 交易导师,他直接内置于面板之中。  他了解您的账户、您的设置和您的规则,用您自己的语言回答,并在每笔交易下单前进
EA Overfitter
Stephen J Martret
5 (1)
回测看起来很漂亮。但它明天、下周、下个月还能继续赚钱吗? EA Overfitter 让您的 EA 在 100 段它从未见过的价格历史上重新运行。一个分数告诉您这个优势是否真实。 回测告诉您的,是 EA 在某一段价格历史上的表现——那段恰好发生过的历史。您无法从中判断,这个结果有多少来自策略本身,又有多少只是那一条特定路径带来的。 EA Overfitter 回答的正是这个问题。它构建最多 100 段您的 EA 从未交易过的合成价格历史,让策略在全部这些历史上重新运行,并展示它所产生的完整结果区间。您得到的不再是一条幸运或不幸路径上的单个数字,而是一幅真实的图景:策略在陌生数据上多久能赚钱、典型结果是什么样(而不是最好的那一次),以及您的回测离它有多远。 这些世界是由您自己的近期历史重建而成,因此这不是预测——任何从历史数据出发的检验都不可能是预测。它告诉您的是:这个优势是否依赖于价格的某一种特定排列,以及回测数字距离典型结果有多远。在投入资金之前,这才是值得回答的问题。 三个步骤 1. 构建。在图表上选择时间区间和世界数量,然后按 Build。EA Overfitter 会
Astro Trade MT5
Indra Maulana
5 (7)
25% discount on the release of the tool: only for the next 3 buyers Send a message to receive a demo version. AstroTrade Trading Assistant AstroTrade is a comprehensive multi-functional trading utility developed for the MetaTrader 5 platform. It integrates essential tools for trade execution, risk management, and technical monitoring into a single unified interface. The application is designed to assist traders in managing their daily operations through a visual and structured environment. Vi
Exp COPYLOT CLIENT for MT5
Vladislav Andruschenko
3.97 (35)
适用于 MetaTrader 5 的专业交易复制器 快速、专业、稳定可靠的 交易复制器 ,适用于 MetaTrader 。 COPYLOT 可在 MT4 和 MT5 终端之间复制 Forex 交易,并支持 Hedge 和 Netting 账户。 COPYLOT 的 MT5 版本支持: - MT5 Hedge → MT5 Hedge - MT5 Hedge → MT5 Netting - MT5 Netting → MT5 Hedge - MT5 Netting → MT5 Netting - MT4 → MT5 Hedge - MT4 → MT5 Netting MT4 版本 完整说明 + DEMO + PDF 如何购买 如何安装 如何获取日志文件 如何测试和优化 Expforex 的所有产品 您也可以将交易复制到 MT4 终端(MT4 → MT4,MT5 → MT4): COPYLOT CLIENT for MT4 COPYLOT 是一款专业的交易和持仓复制器,可同时与 2、3 甚至 10 个终端协同工作。 支持从 模拟账户和投资者账户 复制,也支持同时在多个终端上运行。 您可以使
Welcome to ENTRY IN THE ZONE WITH SMC MULTI TIMEFRAME Entry In The Zone and SMC Multi Timeframe is a real-time market analysis tool based on Smart Money Concepts (SMC), designed to analyze market structure, price direction, and key trading zones. It supports both Single-Timeframe Analysis and Multi-Timeframe Analysis, providing a clearer view of the overall market structure across multiple timeframes, with real-time BUY / SELL signals that do not repaint. It is designed to help filter trading op
Trade Copier Ultimate
Janitha Sandaruwan Amaradasa Wickramasingha Arachchilage
5 (5)
Trade Copier Ultimate - Telegram 到 MT5 信号复制器 Trade Copier Ultimate 可将 Telegram 交易信号自动复制到 MetaTrader 5。EA 能读取信号消息,识别交易品种、订单类型、入场价格、止损、止盈目标以及部分更新指令,然后根据您设置的手数和风险参数,在 MT5 中执行或管理交易。 它不只是一款基础的 Telegram 到 MT5 跟单工具。TCU 还支持 Telegram Bot API 和用户账户 Bridge 工作流程、Discord 信号路由、本地 MT5 到 MT5 跟单、将 MT5 交易广播到 Telegram 或 Discord、图片信号识别、最多 TP5 的多止盈执行、TP OPEN 跑单仓位、虚拟多止盈模式、入场区间处理、挂单、经纪商交易品种匹配以及 Prop Firm 风险控制。 其他资料与使用说明 下载免费演示版  -  快速设置与使用手册  -  下载 NTS Bridge    点击这里测试您的信号格式 --->>> 免费演示版:   购买前可在模拟账户上测试完整的 EA 和 Brid
HINN MagicEntry Extra
ALGOFLOW OÜ
4.74 (19)
HINN MAGIC ENTRY – the ultimate tool for entry and position management! SIMPLE. FASTEST. INTUITIVE. MAX AUTOMATED. Place orders by selecting a level directly on the chart! full description   ::  demo-version  :: 60-sec-video-description Key features: - Market, limit, and pending orders - Automatic lot size calculation - Automatic spread and commission accounting - Unlimited partitial take-profits  - Breakeven and trailing stop-loss and take-profit  functions - Invalidation leves - Intuitive, a
The product will copy all telegram signal to MT5 ( which you are member) , also it can work as remote copier.  Easy to set up, copy order instant, can work with almost signal formats, image signal,  s upport to translate other language to English Work with all type of channel or group, even channel have "Restrict Saving Content", work with  multi channel, multi MT5 Work as remote copier: with signal have ticket number, it will copy exactly via ticket number. Support to backtest signal. How to s
Footprint Chart Pro — Professional OrderFlow EA for MetaTrader 5 Version 6.34 | Professional tool for real traders | Institutional-Grade Visualization DEMO USERS - PLEASE SELECT EVERY TICK / REAL TICK WHEN TESTING AND YOU HAVE DOWNLOADED HISTORICAL DATA. IF YOU SEE A WAITING SCREEN AND IT IS NOT DOWNLOADING, IT MEANS YOU HAVE LOW HISTORICAL DATA. TRY 1 MIN AND 5 MIN FIRST ON 1 DAY DATA. ONE DAY DATA SHOULD BE THE NEWEST AND MOST CURRENT DATE. PLEASE WAIT UNTIL THE MARKET HAS ROLLED OVER PERIOD.
Signal TradingView to MT5 Pro Automator TradingView 与 MetaTrader 5 之间的即时专业执行 使用最强大的桥梁,将 TradingView 警报与 MT5 中的实际执行连接起来,实现交易策略的自动化。这款 Expert Advisor 专为要求速度、灵活性和完美风险管理的交易者设计,可将任何警报消息转化为精确的市价或限价订单。 优势与特点 通用解析引擎(专有): 先进技术,能够自动识别并提取任何警报格式中的数据。您不再受限于单一的死板格式;系统会自动理解交易品种(Symbol)、操作(Action)、价格(Price)、止损(SL)和止盈(TP)。 实时执行: 极速轮询技术(低于 1 秒),经过优化可将延迟降至最低。接收到信号后,订单将在毫秒内执行。 机构级风险管理: 基于以下方式自动精确计算手数: 净值/余额百分比(% of Equity/Balance): 每笔交易承担固定账户百分比的风险。 风险金额(Risk Amount): 设定在触发止损时损失的固定货币金额(例如:100 美元)。 固定手数(Static Lots)
Trade Dashboard MT5
Fatemeh Ameri
4.94 (133)
疲于复杂的订单下达和手动计算?Trade Dashboard 是您的解决方案。凭借其用户友好的界面,订单下达变得轻而易举,只需点击一下,您就可以开设交易、设置止损和止盈水平、管理交易手数,并计算风险回报比,让您只需专注于您的策略。告别手动计算,使用 Trade Dashboard 简化您的交易体验。 立即下载演示版本 。 您可以在这里找到仪表盘功能和特性的详细信息 。 加入 Telegram 频道 。 购买后请给我发消息以获取支持。如果您需要添加更多功能,可以在产品的评论区留下您的想法,我愿意听取任何建议,希望您能在使用我的产品时获得最佳体验 。 这是 MT4 版本。 风险管理:使用 Trade Dashboard,可以将您的风险设置为账户余额或权益的百分比,或将风险设置为总金额。在图表上直观地定义您的止损,让工具准确计算每个货币对的适当手数。该工具还可以根据您期望的风险回报比自动设置止盈水平。它甚至可以在手数计算中涵盖佣金和点差费用。此外,您的止损和止盈可以转变为虚拟水平,隐藏于经纪商。通过 Trade Dashboard 的高级风险管理功能,掌控风险,保护您的资本。 交易线
FUTURES ORDERFLOW FOOTPRINT CHART Professional OrderFlow EA for MetaTrader 5 Version 1.01| Professional tool for real traders | Institutional-Grade Visualization STRATEGY TESTER USERS - PLEASE SELECT EVERY REAL TICK WHEN TESTING AND YOU HAVE DOWNLOADED HISTORICAL DATA. IF YOU SEE A WAITING SCREEN AND IT IS NOT DOWNLOADING, IT MEANS YOU HAVE LOW HISTORICAL DATA. TRY 1 MIN AND 5 MIN FIRST ON 1 DAY DATA. ONE DAY DATA SHOULD BE THE NEWEST AND MOST CURRENT DATE. PLEASE WAIT UNTIL THE MARKET HAS ROL
Grid Manual MT5
Alfiya Fazylova
4.73 (22)
Grid Manual是一个交易面板,用于处理订单网格。 该实用程序是通用的,具有灵活的设置和直观的界面。 它不仅可以在亏损方向上设置订单网格,还可以在盈利方向上设置订单网格。 交易者不需要创建和维护订单网格,实用程序会这样做。 打开一个订单就足够了,Grid manual会自动为它创建一个订单网格,并伴随它直到非常关闭。 完整说明和演示版 此處 。 该实用程序的主要特性和功能: 伴隨以任何方式打開的訂單,包括從移動終端打開的訂單。 適用於兩種類型的網格:“限制”和“停止”。 使用兩種方法計算網格間距:固定和動態(基於 ATR 指標)。 允許您更改未結訂單網格的設置。 顯示圖表上每個網格的盈虧平衡水平。 顯示每個網格的利潤率。 允許您一鍵關閉網格中的盈利訂單。 讓您一鍵關閉每個訂單網格。 允許您對訂單網格應用追踪止損功能。 允許您在訂單網格上應用將訂單網格的止損轉移到盈虧平衡水平的功能。 相對於訂單網格的盈虧平衡水平自動重新排列止盈(僅在限價網格模式下,距離取決於所選的計算類型:“保守”或“激進”)。 最多可管理 20 個訂單網格,每個網格最多可包含 100 個訂單。 計算初始手數時,
Timeless Charts
Samuel Manoel De Souza
5 (8)
Timeless Charts is an all-in-one trading utility for professional traders. It combines custom chart types such as Seconds Charts and Renko with advanced order flow analysis using Footprints , Clusters , Volume Profiles , VWAP studies, and anchored analysis tools for deeper market insight. Trading and position management are handled directly from the chart through an integrated trade management panel , while Market Replay and Virtual Accounts provide environments for practicing trading skills and
MT5 to Telegram Signal Provider 是一个易于使用且完全可自定义的工具,它允许向 Telegram 的聊天室、频道或群组发送 指定 的信号,将您的账户变为一个 信号提供商 。 与大多数竞争产品不同,它不使用 DLL 导入。 [ 演示 ] [ 手册 ] [ MT4 版本 ] [ Discord 版本 ] [ Telegram 频道 ]  New: [ Telegram To MT5 ] 设置 提供了逐步的 用户指南 。 不需要了解 Telegram API;开发者提供了您所需的一切。 关键特性 能够自定义发送给订阅者的订单详情 您可以创建分层的订阅模型,例如铜、银、金。其中金订阅获得所有信号等。 通过 id、符号或评论过滤订单 包括执行订单的图表截图 在发送的截图上绘制已关闭的订单,以便额外核实 延迟发送新订单消息的可能性,以便在发送前对位置进行调整 订单详情完全透明: 新的市场订单*带截图 订单修改(止损、获利) 已关闭的订单*带截图 部分关闭的订单** 新的挂单 修改的挂单(进场价格) 挂单激活(作为新的市场订单附加) 已删除的挂单 历史订单报告
Seconds Chart MT5
Boris Sedov
4.61 (18)
秒级图表 (Seconds Chart) - 一款专为 MetaTrader 5 设计的独特工具,用于创建秒级时间框架的图表。 通过 秒级图表 ,您可以构建以秒为单位的时间框架图表,获得标准分钟或小时图表无法提供的极致灵活性和分析精度。例如,时间框架 S15 表示每根蜡烛图持续15秒。您可以使用任何支持自定义交易品种的指标和EA交易系统。操作它们就像在标准图表上交易一样方便。 与标准工具不同, 秒级图表 让您能够在超短时间框架下进行高精度交易,无延迟干扰。 免费演示版: Seconds Chart v2.29 Demo.ex5 下载免费演示版,亲自体验: 功能齐全 - 所有功能均可使用 24小时测试 - 足够评估准确性和便利性 仅限模拟账户 - 大多数经纪商均可轻松开立 仅限GBPCAD图表 - 大多数终端均可使用 这些限制仅适用于演示版。完整版适用于任何账户类型(真实、演示、竞赛)和任何图表(XAUUSD、EURUSD 等),无任何限制。 如何安装演示版 通过上方链接下载演示文件 打开MetaTrader -> 文件 -> 打开数据文件夹 -> MQL5 -> Experts 将下
Trade Indicator Assistant   is a powerful MT5 utility designed to turn indicators into automated trading systems. Its main feature is the ability to automatically detect an indicator’s   BUY and SELL signal buffers , without requiring you to know the buffer numbers, search through indicator settings, or modify the indicator source code. Bonus Indicator:   After purchasing Trade Indicator Assistant, contact me to receive   Trade Signal Pro   completely free as a bonus indicator. [Download Demo V
Trade copier MT5
Alfiya Fazylova
4.6 (55)
Trade Copier 是一种专业实用程序,旨在复制和同步交易账户之间的交易。 复制发生从供应商的帐户/终端到收件人的帐户/终端,安装在同一台计算机或 vps 上。 促销活动 - 如果您已经购买了“Trade copier MT5”,您可以免费获取“Trade copier MT4”(用于 MT4 > MT5 和 MT4 < MT5 的复制)。欲了解更多详细条款,请通过私人消息与我们联系! 在购买之前,您可以在演示帐户上测试演示版本。 演示 这里 。 完整说明 这里 。 主要功能和优点: 支持复制MT5>MT5、MT4>MT5、MT5>MT4,包括МТ5 netting账户。 供应商和收件人模式在同一产品中实现。 简单直观的界面,允许您直接从图表中实时控制复制。 连接中断或终端重新启动时不会丢失设置和位置。 允许您选择要复制的符号,也可以替换接收者的符号,例如 EURUSD> USDJPY。 允许为每个符号设置个性化的复制设置。 支持回拷贝。 能够仅复制某些订单。 允许您设置开仓交易价格的最大差异和最大时间延迟。 正确复制部分订单关闭的执行。 计算复制手数的几种方法。 同步止盈和止损
Anchor Trade Manager
Kalinskie Gilliam
5 (9)
Your EAs cannot see each other, but Anchor can. Anchor gives you one place to coordinate your EAs, manage risk, and decide when trading is allowed. It works alongside the trading bots you already use without any changes to them. The Problem One EA opens a trade. Then another starts trading. The next thing you know, you wake up to multiple grids built across your account. Each EA may be doing exactly what it was designed to do, but together they can place far more risk on your account than you in
Trade Manager DashPlus
Henry Lyubomir Wallace
4.85 (13)
DashPlus 是一款先进的交易管理工具,旨在提升您在 MetaTrader 5 平台上的交易效率和效果。它提供一整套功能,包括风险计算、订单管理、先进的网格系统、基于图表的工具和绩效分析。 主要功能 1. 恢复网格 实施一个平均和灵活的网格系统,以在不利的市场条件下管理交易。 允许设置战略性进出点,以优化交易恢复。 2. 叠加网格 通过在强劲的市场波动中增加仓位,最大化有利交易的潜在回报。 帮助您通过扩展获利交易来利用趋势市场。 3. 盈亏线 在图表上直接提供潜在利润和损失场景的可视化表示。 调整设置并拖动盈亏线,以在执行之前评估各种交易结果。 4. 篮子模式 简化同一交易品种的多仓位管理,将它们合并为一个聚合仓位。 基于平均价格,便于监控和应用止损、止盈以及其他订单修改。 5. 图表上的新闻 将预定的经济新闻事件整合到您的交易图表中。 帮助您随时掌握可能影响市场波动的即将发生的事件,从而更好地规划交易。 6. 警报 设置基于时间或价格的警报,通知会显示在 MT5 中,或通过 MT5 应用发送到您的移动设备。 对监控关键价格水平或重要的交易时段非常有用。 7. 绩效统计 提供详细的
作者的更多信息
This product can be used to synchronize multiple Charts, and each Chart can be set to a different sync mode. With this product you can better view and manipulate charts: different time frames for a single Symbol, the same time frame for multiple Symbols... and more. PS: The link below is the FreeDemo product, you can use it on EURUSD/XUAUSD/USDCNH symbol: https://www.mql5.com/en/market/product/38557 Feature: Chart settings  can be synchronized, including : background, indentation, size, etc. M
Do you think it's a bit cumbersome when you need to switch symbols or timeframes with mouse click? 1. What is this? This is a program that can switch symbols and timeframes with direction keys. Fast switching, very convenient, no mouse click required. For traders, one symbol with multi-timeframe charts are usually added,  you can change symbol on those charts easily. For multi-currency traders, different symbol charts are usually added, you can also change those timeframes easily. I wrote this p
1.这是什么         上涨波动和下降波动是不一样的,无论是学术研究还是实际检验都说明了这一点。         原始的ATR指标是把上涨波动和下降波动放在一起进行计算。本指标则是把上涨波动和下降波动分开进行计算,这样能更好的帮助你研究市场。 2.指标说明         本指标的计算有两种模式,如下表所示: 0 1 2 3 4 5 波动方向 + - + + - + TR 15 20 17 5 16 8 原始ATR (15+20+17+5+16+8)/6=13.5 模式1 不以0填充位置,周期数改变 模式1上涨TR 15 17 5 8 模式1下跌TR 20 16 模式1上涨ATR (15+17+5+8)/4=11.25 模式1下跌ATR (20+16)/2=18 模式2 以0填充位置,周期数不变 模式2上涨TR 15 0 17 5 0 8 模式2下跌TR 0 20 0 0 16 0 模式2上涨ATR (15+0+17+5+0+8)/6=7.5 模式2下跌ATR (0+20+0+0+16+0)/6=6         如上表。比如周期为6的序列中,有4个上涨2个下跌。模式1不
1.这是什么: 下载Market Watch中所有的Symbol数据到系统。PS:不是把数据输出到文档。 2.为什么要用这个: 如果系统中没有数据:网络链接不好的时候,用MT5看一个Symbol需要等待很长时间;在不同Symbol或不同TimeFrame切换,如果系统没有数据也需要等待很久;如果进行长时间回测,系统没有数据,需要下载很长时间。 所以提前把历史数据下载到系统中,能提高工作效率。 3.怎么使用: parameters: input bool bool_usualtimeframe=true; //true-系统默认TimeFrames; || false-所有的TimeFrames. input bool bool_allSymbol=true; //true-Market Watch中所有品种; || false-根据你的输入 input string input_Symbol=NULL; //上面参数为false时,输入你的Symbol名称 input datetime time_Start=D'2017.01.01'; //默认数据下载开始时间 input int s
Do you think it's a bit cumbersome when you need to switch symbols or timeframes with mouse click? 1. What is this? This is a program that can switch symbols and timeframes with direction keys. Fast switching, very convenient, no mouse click required. For traders, one symbol with multi-timeframe charts are usually added,  you can change symbol on those charts  easily . For multi-currency traders, different symbol charts are usually added, you can also change those timeframes easily. I wrote thi
According to trading experience: Some symbols are easy to reverse on certain days, such as Monday, or afternoon, and so on. So comparing the current price with the corresponding historical moment price is valuable. If the price coordinate system uses a logarithmic price, you will get a lot of valuable information. 1. What is this? This program can convert the symbol price and add it to your Chart. You can compare it with your major chart. The DEMO version Link: https://www.mql5.com/en/market/pr
What is this: Violent trading: means sending a large number of orders to your brokerage server,  it can conduct a stress test of the trading. In this program you can run a variety of trading tests.  Now you can trade at high speed, For example 1000 orders in an instant. The Demo version's link:  https://www.mql5.com/en/market/product/38431/ Why to use: Whether manual trading or EA trading,  the status of the broker server is very important. So it is beneficial to conduct a trading stress test on
1. Why did I develop this series of indicators I found that most traders need to use multiple time frame indicators. They usually switch time frame to see indicators. However, once the timeframe is switched, you cannot see the  corresponding relationship  between  the price in the smaller timeframe  and  the indicator in the larger timeframe . For example: if your price chart is in H1 timeframe, you can see H4, D1 and W1 indicators in H1 timeframe Chart. This is more helpful for you to find th
筛选:
无评论
回复评论