Multi Chart Synchronization MT4

5
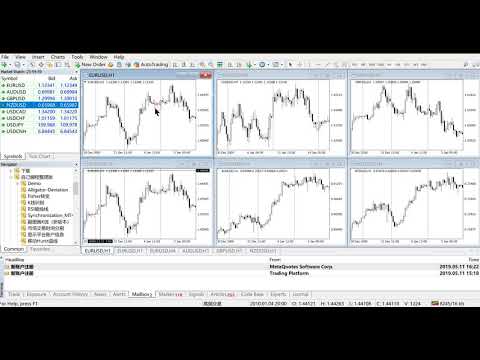
This product can be used to synchronize multiple Charts, and each Chart can be set to a different sync mode. With this product you can better view and manipulate charts: different time frames for a single Symbol, the same time frame for multiple Symbols... and more.

PS: The link below is the FreeDemo product, you can use it on EURUSD/XUAUSD/USDCNH symbol:

https://www.mql5.com/en/market/product/38557

Feature:

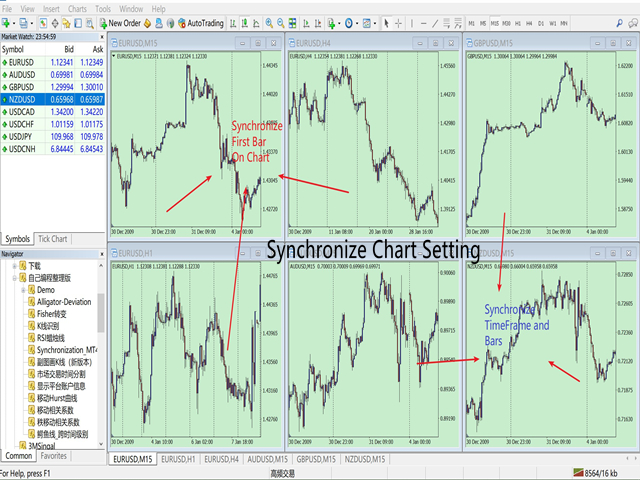
  • Chart settings can be synchronized, including : background, indentation, size, etc.
  • Multiple Chart window start times or end times can be synchronized.
  • Multiple Chart time frames can be synchronized.
  • MT4 can only run one EA/Script for a Chart. This product is compiled in the form of Indicator and does not affect the superposition of other EAs/Scripts.
How To Use:
  • Your first open Chart is your operation Chart,  you need to load the program into other Charts,  please do not load this program into your operation Chart.
  • " Your first open Chart " means :  When your Chart is empty,  Your first open Symbol Chart. (Sometimes you open a lot of Symbol charts, and you dragged the Chart in the Chart List, which causes your leftmost chart is not your first.)
    Parameter:
    • IsChartSynchronize=true;              // Whether to synchronize chart settings of Chart, including window start time.
    • IsTimeFrameSynchronize=true;     // Whether to synchronize the timeframe of the Chart
    • SynRefreshMillisecond=100;          // Set the millisecond frequency of synchronization
    • IsLockShift=true;                          // Is Lock Chart Start_Times And ChartScale
      • ---true  : the default setting just like previous version. 
        ---false : after synchronize to the first chart, you can drag your other charts, and change ChartScale. If you operate the first chart again, Sync again.   
      • This feature makes synchronization flexible, You can also operate other charts while retaining the sync function. 
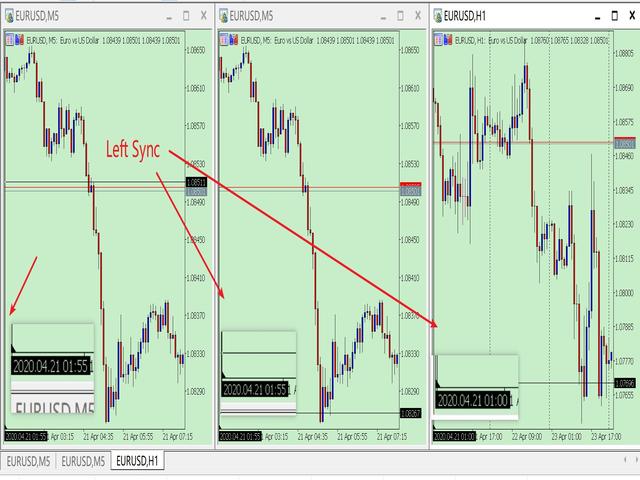
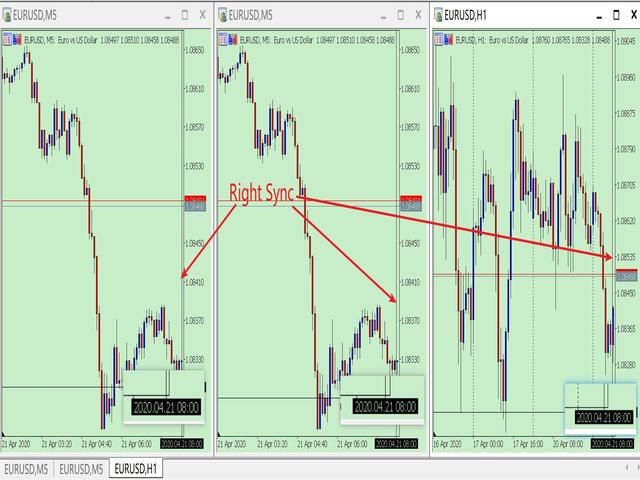
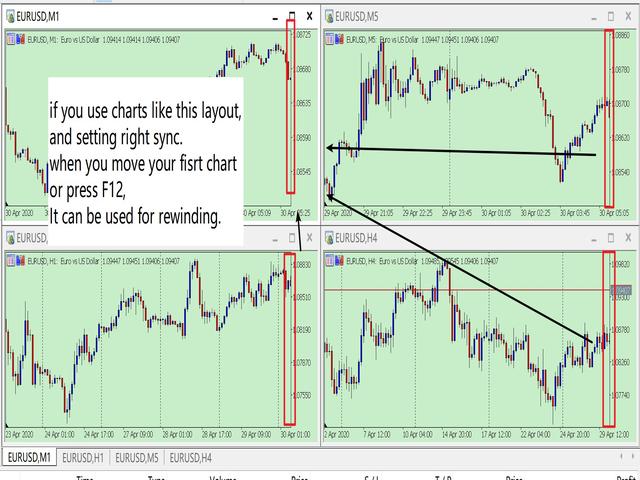
    • LeftSyn=true; //true: left synchronized / false: right synchronized
      • If you setting right sync, this function can be used for rewinding.

      Thanks for using my program.

      Multi Chart Synchronization On MT5 has more function, It supports synchronization of system Indicators,  which may be useful if you use the MT5 platform. That is the link:  https://www.mql5.com/en/market/product/35700


      评分 5
      Stephenpt
      100
      Stephenpt 2022.02.26 09:00 
       

      Just bought, and testing it. When i am not so sure, Yu Zhang always there to help me. Thank you!

      推荐产品
      Chart Button is a very useful indicator that allows you to navigate all charts with a simple click. This tool has been designed to work both vertically and horizontally. The particularity of this navigator is that you can change more charts simultaneously setting the input value. This tool will give you the ability to optimize your navigation and speed up all your analyzes. Input Values Direction (the direction of symbols buttons) Horizontal Vertical 32 SYMBOLS Forex_Suffix_Symbols (add Forex S
      Slide Trend is a simple indicator that shows a trend and allows for easy and fast navigation between charts. It was designed for quick analysis and aids you to scroll very fast through all the charts in the inputs list. The minimalist graphic allows receiving data on trend on D1, W1 and MN timeframes. The Trend feature (in the inputs) allows you to filter and view only the most powerful symbols. In this case, the circles are all of the same color. This indicator is a utility that speeds up navig
      脚本关闭 MT4 的所有正订单     - 将允许您快速关闭您账户上的所有盈利订单。 该脚本 适用 于 您需要快速关闭所有盈利订单 的时刻。 该脚本具有用于设置 Profit_in_pips 的唯一参数 - 您可以在其中指定订单上应该有多少利润点,以使其符合平仓条件。 该脚本非常易于使用 ,只需将脚本拖放到图表上即可完成工作。 推荐的机器人黄牛 -   测试 它。 订阅我的 页面 ,我还有很多其他有用的产品。 如果您喜欢该脚本 ,请留下评论,它将进一步激励我免费分享有用的产品。 如果您有任何问题,可以在讨论部分写出来。 交易愉快。 感谢您选择本产品。 我将努力继续以有用和高质量的产品取悦您。 如果您有任何问题,请随时与我们联系! 如果您有任何问题,请随时与我们联系! 使用愉快!
      SwitchRefresh
      Ahmet Metin Yilmaz
      Switch & Refresh Charts This Script shows all the charts open on your MT4 platform in sequence with a delay of the second you specify, and refreshes the displayed charts if desired. When it comes to the first chart you started, it waits for the minute you specify and starts the same cycle again. The file you downloaded is located in the 'Scripts' section and when you come to the graphic you started to finalize, it should be removed from the chart as seen in the screenshot.
      MultiChartSync4 - Multi-Chart Auto-Sync Tool  Program Overview MultiChartSync4 is a professional MetaTrader 4 multi-chart synchronization tool that enables automatic timeline alignment and synchronized navigation across multiple chart windows, significantly improving efficiency for multi-instrument and multi-timeframe analysis. Core Features 1. Intelligent Chart Synchronization Automatic Chart Alignment : All secondary charts automatically align with the master chart's candlestick timeline Re
      Buy Sell Multiple Panel - Execute Bulk Orders in a Single Click! Description: Save time and seize market opportunities instantly. This powerful panel allows you to place multiple buy or sell orders simultaneously, each with custom lot sizes, take-profit, and stop-loss levels. Perfect for sophisticated entry strategies and managing complex trades efficiently. Key Features: Bulk Order Execution:   Open multiple market orders at once with just one click. Flexible Lot Sizing:   Set individual lot
      【关于投资问题】 问题1:        当市场机会来临时,一般投资者都会疯狂下单。 疯狂下单,你无法知道是否会爆仓。唯一的 参考就是预付款比例,但 预付款比例无法准确判断你是否会 爆仓。 如果订单数量多,或者产品订单数量更多时,你是无法进行统计损失与盈利。如果能有一款工具能统计止损止盈及盈亏比,哪么就可以更好控制仓位及是否重仓博弈 。 哪么恭喜你,你找到了Fibo Trading Assistant MT4能帮你解决这个问题 。 问题2 :        如果你是一个高级的交易员,可能你会在某些关键位置进行布局挂单。通过手工挂单,图表可能没有位置给你挂单了。如果有 一款工具能帮你均匀布局订单就非常理想。 哪么恭喜你,你找到了 Fibo Trading Assistant MT4能帮你解决这个问题  ,并且是一键操作 。 问题3:        在 等 待机会时,可能你会先挂上一些挂单,同时设置好止损。手工操作这些挂单止损止盈都是不好设置的。 如果能有一款工具能帮批量挂好订单并设置好止损止盈。哪是该多好呀。 哪么恭喜你,你找到了 Fibo Trading Assistant MT4
      FREE
      This indicator is a supporting tool which helps you draw/update any chart object once. The additions or changes are automatically synchronized to all linked chart windows of the same instrument. Setup is simple. Open all required charts you want to work on, attach the indicator to each chart window and start using it. Its only allowed to attach one indicator to each chart. Once attached, you can draw on any chart (as long as it has this tool attached as indicator) and the drawing will show up o
      A script to open and Close  charts of  multiple pairs instantly with custom template $30 for the next 25 downloaders, next price: $45 Features: Chart Opener : Open chart(s) of multiple pairs simultaneously Template Opener : Load any User specified template (.tpl) to the opened chart(s) Chart Closer : Close chart(s) of multiple pairs simultaneously Disclaimer: Any loss involving this trading tool is the sole responsibility of the User, and not the responsibility of the Creator of this trading
      Every trader is watching over his account over and over.... trying to anlayse every system he or she has. With this tool you are able to  export your complete history of every account export withdrawls / deposits / rebates to a separate file export account status with balance / equity / current drawdown recalculate micro to standard lots / profits ...  export decimal by "." or ","  combine a series of Magic Numbers to one unique Magic Number   filter to ignore OrderComments.
      METATRADER4 This program is designed to monitor and evaluate the market performance of 21 minor currency pairs by tracking key metrics such as maximum spread and the time of occurrence. For each selected currency pair, the program calculates the current spread and compares it against the highest recorded spread. If a new maximum spread is detected, it updates the maximum value and logs the time. The spread information is  dynamically displayed. Additionally, every hour, the program prints out t
      Automatically closes orders when profit per lot or total profit reaches your specified level Per a lot : The amount of wins per lot in the selected symbol. Each orders is calculated as 1 lot. Example: If EURUSD total lot is 2.05 and earnings per lot is $ 100, then 100 * 2.05 = 205 $. Orders will be closed when EURUSD has a total profit of $ 205. When the total of all orders on the selected symbol reaches the specified amount, it closes all orders belonging to the symbol. For example: There are 3
      Basic Trade Buttons is a tool to help you to quickly open and close trades, place take profit and stop loss points by clicking on the button of each job that you preferred. Once you attached this tool to mt4 chart, the program will calculate a trade volume(Lots size) automatically to prepare to send to the trade server when you click on 'Buy' or 'Sell' button. Click on 'TP', 'SL' or 'Close' button to place take profit, stop loss based on the predefined levels or to close all open positions respe
      Trade History Exporter automatically exports trade history to a CSV (comma separated values) file. Trade History Exporter: - automatically exports trade history every time a trade is closed - allows you to manually force an export by using the "W" key on your keyboard - can use Order Comments as Magic Numbers - useful for instance when using a Trade Copier - calculates the Net Profit per trade
      Description The Panel is designed to select top signals from the terminal database and the MQL5.community website. To allow web requests for the program, you need to enable the "Allow WebRequest for the following URL" option in the terminal settings and explicitly manually specify URL https://www.mql5.com/ . Parameters The terminal tab — selecting signals form the terminal data base. sorting — choose a sorting field to select the best signals from the data base: NONE RATING DATESTART DRAWDOWN G
      This utility can compare simultaneously time frames of different instruments and keep under control   the nine major time frames  of an instrument. It is composed by two changers, a crosshair and some additional components : the  multicharts time frames changer   is designed to  compare  simultaneously  up to thirty time frames  of different symbols with the  keyboard or the button the multicharts symbols changer can  link up to nine charts and control simultaneously the nine major time frame b
      This indicator is useful for monitoring the performance of individual strategies or even everything of the entire portfolio of strategies directly on your MT4. In this way you can view the equity line and the balance line directly on the chart. In addition, you can set a line based on the percentage number of DD Max that the individual strategy can reach. Try it.
      Trade Info
      Johannes Schoeman
      Trade and Account Information Panel The Trade Info Panel allows you to easily see the status of you trading by pair and account. Minimise the panel by clicking on it to reduce the display area. Easily Identify loosing pairs/ instruments traded by the change of header colour. The HEADER change colour should the months losses exceed the months gains. Displayed information: General Account information Account Leverage Spread Bar Time remaining Account Balance  Account Equity Margin Free Margin Acc
      This EA represents an interactive panel with adjustable parameters destined for installation and deletion of pending orders (orders grid generator). You can place the panel anywhere on the screen or hide it into a dot clicking on the button in the upper left part of the chart (it will be shown after clicking on it for the second time). Number and step of orders, lot size, vertical shift for limit orders - all these things make your work easier. There are functions for restoring according to pend
      半自动交易面板,一键点击成交直接设置好止损与止盈,自动计算单量或者修改订单。下好单后仍可继续手动调整订单。 1 。交易时点击红色按钮为做空绿色按钮为做多, “ /K ” 即以前几根 K 线的最高点或者最低点为止损点。 “Buy1 , Buy2 , Buy3 , Buy4” 下方输入框为每单最大允许亏损值,四舍五入计算,点击 BUY 或者 SELL 即下单。 2 。绿色 “B-pips” 为多单买入进场,下方输入框为允许的亏损值,四舍五入计算, “*spread” 为入场价距离止损价的点差倍数,如 3*spread ,即为以当前价位进程,止损价为 3 倍点差,红色 S-pips 为空单进程按钮。 3 。绿色 “B-Modify” 为修改多单按钮,下方输入框以前 N 根 K 线为止损 K 线修改,默认 3 ,即前 3 根 K 线的最低点为止损价修改订单;红色 “S-Modify” 则为空单修改按钮。 4 。绿色 “B-even” 为修改多单止损价为入场价,即不允许订单止损为负值,点击修改订单时仅当实时价格大于入场点时才会修改。红色 “S-even” 为空单修改按钮。 5 。绿色 “trai
      Chart State Saver for MT4 is utility which helps to save states of all your charts even if they will be closed. And then all saved charts' states can be easily loaded back to charts. It stores templates for each particular currency pair and automatically applies them to charts once they will be opened at next time. Also they can be applied to the charts by your own needs. Thus you can close any chart at your MT4 without scaring to lose chart's data like drawls, messages, chart styling and so o
      Forex Candle High/Low Alert Indicator Overview: Forex Candle High/Low Alert Indicator, designed to provide real-time insights and alerts for major currency pairs. This custom-built tool displays key High and Low values over a chosen number of candles and time frame, ensuring you stay informed about critical price movements and trends. (The candles observed are from the 1st candle back - The amount of the chosen number of candles) Key Features: Real-Time High/Low Tracking : The indicator dynamica
      MagicExcel
      Alessandro Brunelli
      MagicExcel will allow you to extrapolate, from your trades, reports split down by Expert Advisor. The generated reports allow you to quickly compare statistics of trades data from different Expert Advisors, different symbols and also the behavior of an Expert Advisor against different symbols. Additionally, if selected, a report will be created that shows the behavior of the Expert Advisor over time. This is a very useful tool for a trader who works with many Expert Advisors at the same time. R
      EA Target MM Dollar
      Raudhah Hayatun Nufus
      It's very easy, you only need to enter the amount of profit you want to get, then when your account has grown this EA will close the order, even though you are not monitoring the chart. Now you don't need to worry if the profit you have achieved turns into a loss because you don't use this EA, because this EA will help you whenever, wherever you are. Good luck trying it, hopefully you will become a very profitable trader
      Telegram Ultimate Manager MT4 Use Cases: Manager Order (open, close, modify order) Publish open and close order to Telegram Channel Open trade based on Forex Factory News Requirement: Telegram Chat ID Telegram Bot API Token Telegram Channel ID Please read the guide This tools can not be backtested Free n8n workflow template to : 1. Import Forex Factory news to Google Calendar 2. Send chat to Telegram bot about news release. Is it good or bad for the currency Inputs: Telegram Bot Token : your T
      This utility tool help you to close all orders which is having loss immediatly with only ONE CLICK, its work is very fast. You can choose which symbol you want or close all symbols so it will helpful for you in your trading to manage trading faster. If you want it work on all symbols, you just need to leave symbol parameter blank (like in default setting). If you want it work on 1 symbol only (for example EURUSD orders) you need to put symbol =EURUSD (see screenshot below). This is a script, so
      You can: observe the price chart inside the chart of a different price evaluate correlation and relationships observe the difference in charts in the form of a histogram Opportunities: "Auto" mode - auto-adjust the chart for another chart "multiplier" - you can multiply the chart by any number shift up / down the chart by value shift the chart to the left "invert" - mirror flip of the chart Important: only charts added to MarketWatch are used Version for MetaTrader 5 -  https://www.mql5.com/e
      SymbolsSwich
      Oleksii Novykov
      Symbol Syncyro Switch - is a utility that allows you to switch a trading symbol on several charts at the same time. If you use several charts of the same symbol with different timeframes for analysis and want to change the symbol of a trading instrument, then this tool is just for you! With one click on the button with the inscription of the trading symbol, you can easily change it using this utility.
      "Support or Resistance Alert Broken" is a simple and very intuitive tool that allows you to create or eliminate horizontal and trend supports and / or resistances with a simple click. When the support or resistance line is broken by the closing price at the end of the current candle, the "Support or Resistance Alert Broken" tool will send an alert with sound, as well as a notification to the MT4 or MT5 mobile application. This tool can send alerts from multiple pairs at the same time. Utility
      该产品的买家也购买
      Local Trade Copier EA MT4
      Juvenille Emperor Limited
      4.96 (104)
      通过 Local Trade Copier EA MT4 获得非常快速的交易复制体验。它的简单1分钟设置,使您可以在同一台Windows计算机或Windows VPS上在多个MetaTrader终端之间复制交易,具有闪电般快速的复制速度,低于0.5秒。 无论您是初学者还是专业交易者, Local Trade Copier EA MT4 都提供了广泛的选项,可根据您的特定需求进行自定义。对于任何希望增加利润潜力的人来说,这都是终极解决方案。 今天就尝试一下,看看为什么它是市场上最快、最简单的贸易复印机! 提示: 您可以在您的模拟账户中下载并试用 Local Trade Copier EA MT4 模拟版: 这里 将下载的免费演示文件粘贴到您的 MT4 >> 文件 >> 打开数据文件夹 >> MQL4 >> 专家文件夹并重新启动您的终端。  免费演示版本每次可在 4 小时内发挥全部功能,仅限演示帐户。 要重置试用期,请转至 MT4 >> 工具 >> 全局变量 >> Control + A >> 删除。 请仅在非关键模拟账户上执行此操作,不要在挑战道具公司账户中执行此操作。 Local
      Trade Assistant MT4
      Evgeniy Kravchenko
      4.42 (192)
      它有助于计算每笔交易的风险,容易安装新的订单,具有部分关闭功能的订单管理, 7 种类型的追踪止损和其他有用的功能。 附加材料和说明 安装说明 - 应用程序说明 - 模拟账户应用程序的试用版 线条功能  - 在图表上显示开仓线、止损线、止盈线。 有了这个功能,就可以很容易地设置一个新的订单,并在开仓前看到它的附加特性。   风险管理  - 风险计算功能在考虑到设定的风险和止损单的大小的情况下,计算新订单的成交量。它允许你设置任何大小的止损,同时观察设定的风险。 批量计算按钮 - 启用 / 禁用风险计算。 在 " 风险 " 一栏中设置必要的风险值,从 0 到 100 的百分比或存款的货币。 在 " 设置 " 选项卡上选择风险计算的变量: $ 货币, % 余额, % 资产, % 自由保证金, % 自定义, %AB 前一天, %AB 前一周, %AB 前一个月。   R/TP 和 R/SL - 设置止盈和止损的关系。 这允许你设置相对于损失的利润大小。 例如, 1 : 1 - 这决定了 TP = SL 的大小。 2 : 1 - 这意味着 TP 是 SL 的两倍。 RR - 它禁用比率。  
      欢迎来到 Trade Manager EA——这是一个终极风险管理工具,旨在使交易变得更直观、精准和高效。它不仅仅是一个下单工具,而是一个用于无缝交易计划、仓位管理和风险控制的全面解决方案。不论您是新手交易员、资深交易员,还是需要快速执行的剥头皮交易员,Trade Manager EA 都可以满足您的需求,适用于外汇、指数、大宗商品、加密货币等各种市场。 借助 Trade Manager EA,复杂的计算已成过去。只需分析市场,在图表上用水平线标记入场、止损和止盈,设置您的风险水平,Trade Manager 就会立即计算出理想的头寸规模,并实时显示以点、账户货币计价的止损和止盈。每笔交易都得以轻松管理。 主要功能: 头寸规模计算器 :根据定义的风险瞬间确定交易规模。 简单的交易计划 :在图表上用可拖动的水平线直接计划交易,设置入场、止损和止盈。 实时显示 SL 和 TP :以账户货币、点或分显示止损和止盈,便于分析。 高级保护工具 盈亏平衡选项 : 基本盈亏平衡 :当您的交易达到设定水平时自动保护利润。 多级盈亏平衡 :设置多达 4 个级别以逐步保护利润。 尾随止损选项 : 基本尾随
      Copy Cat More Trade Copier MT4 (复制猫MT4) 不仅仅是一个简单的本地交易复制工具;它是一个为当今交易挑战而设计的完整风险管理与执行框架。从 prop firm 挑战到个人账户管理,它都能通过强大的执行力、资本保护、灵活配置以及先进的交易处理来适应各种情况。 该复制器同时支持 Master(发送端) 和 Slave(接收端) 模式,能够实时同步市价单与挂单、交易修改、部分平仓以及 Close By 操作。它兼容模拟账户与真实账户,支持交易或投资者密码,并通过持久交易记忆系统(Persistent Trade Memory)确保即使 EA、终端或 VPS 重启后也能恢复。可同时管理多个 Master 与 Slave,并通过前缀/后缀自动调整或自定义符号映射来处理跨平台或跨经纪商差异。 使用手册/设置: Copy Cat Trading Copier 使用手册 Copy Cat More MT5: https://www.mql5.com/en/market/product/139088 加入频道: https://www.mql5.com/en/cha
      With this Expert Advisor, you can seamlessly integrate various channel, arrow, and reversal indicators. It offers the flexibility to use all popular channel trading strategies, while also providing powerful tools to customize your trading conditions and risk management system.   The Expert Advisor opens orders when the price crosses the channel boundaries. Multiple crossing conditions are available for customization: Price touches boundary on re-entry into the channel Price touches boundary on
      TradePanel MT4
      Alfiya Fazylova
      4.84 (89)
      交易面板是一个多功能的交易助手。该应用程序包含超过 50 个用于手动交易的交易功能,并允许您自动化大多数交易操作。 注意,该应用程序在策略测试器中不起作用。购买之前,您可以在模拟帐户上测试演示版本。演示版 这里 。 完整说明 这里 。 贸易。 让您一键执行交易操作: 通过自动风险计算打开挂单和仓位。 一键打开多个订单和仓位。 打开订单网格。 按组关闭挂单和持仓。 头寸反转(关闭买入并打开卖出或关闭卖出并打开买入)。 锁定头寸(开立额外头寸,以平衡买入和卖出头寸的交易量)。 一键部分平仓所有仓位。 为同一价格水平的所有头寸设置止盈和止损。 将所有头寸的止损设置为该头寸的盈亏平衡水平。 开单建仓时,您可以应用以下功能: 计算交易量的多个订单或仓位之间的分布(一键开仓多个订单或仓位时)。 图表上未来订单交易水平的可视化。 设置开仓时允许的最大点差大小。 止盈和止损之间的自动比率。 虚拟止损和止盈。 根据当前点差的大小自动增加止损和止盈的大小。 根据 ATR 指标的读数计算止盈和止损。 设置挂单的到期日期。 挂单设置为“追踪”(挂单自动跟随当前价格移动指定距离)。 管理通过移动终端(手机)开立
      VirtualTradePad mt4 Extra
      Vladislav Andruschenko
      4.86 (58)
      一键交易的交易面板。处理头寸和订单!通过图表或键盘进行交易 交易小组进行人工交易。您可以从图表(图表窗口)或键盘进行交易。打开和关闭,反向和锁定。处理职位和订单! МetaТrader4中主要订单的交易控制面板:买入,卖出,买入,买入,卖出,卖出限制,收盘,删除,修改,追踪止损,止损,止损。 MT5版本 详细描述   +DEMO +PDF 如何购买 如何安装     如何获取日志文件     如何测试和优化     Expforex 的所有产品 从符号窗口交易并从键盘交易! 您正在为MetaTrader 4终端提供一个独特的插件 - 虚拟控制面板VirtualTradePad。 Description on English 注意!如果您想学习如何交易 策略测试器  ,请查看我们的免费 TesterPad 实用程序 VirtualTradePad在“  MQL5语言最佳图形面板  ”竞赛中 获得二等奖 。 工作标签 职位标签   -使用职位: 开/关买入和卖出, 冲销所有头寸, 锁定一个共同的立场, 更改止损/获利, 设定一般的止损/获利的位置, 启用追踪止损, 实现盈亏平衡 只平
      The product will copy all telegram signal to MT4   ( which you are member  ) , also it can work as remote copier.  Easy to set up, copy order instant, can work with almost signal formats, image signal, s upport to translate other language to English Work with all type of channel or group, even channel have "Restrict Saving Content", work with  multi channel, multi MT5 Work as remote copier: with signal have ticket number, it will copy exactly via ticket number. Support to backtest signal. How to
      跟单->方便快捷的界面交互,用户上手即用       ->>>> 推荐在windows电脑,或者VPS Windows上使用 特色功能: 多样化个性跟单设置: 1.对不同的信号源可以设置不同的手数模式 2.不同的信号源分别设置正向反向跟单 3.信号分别设置注释 4.是否根据合约手数校准手数 多样化个性跟单设置2: 1.对不同的品种可以设置不同的手数模式 2.不同的品种分别设置正向反向跟单 3.信号分别设置注释 4.是否根据合约手数校准手数 注释过滤,MAGIC过滤,信号手数过滤,本地品种过滤 净持仓模式(该模式下手数计算仅支持倍率) 工作时间设置 反向同步接收端的平仓 订单绑定功能:任意订单可以绑定到设置信号源订单上 (双击表格更改) 账户风险控制  基本功能: 跟单正常交互速度0.5s以下 自动检测信号源,并显示信号源账号列表 自动匹配品种,不同平台常用交易品种(后缀不同等特殊情况)95%自动匹配,基本无需手动设置,品种映射表可随意双击更改对应品种.(映射表具有快速搜索品种功能) 4种手数计算模式(1.倍率 2.固定手数 3.自适应资金风险 4.源账户资金比例风险) 特殊手数模式
      MT4 至 Telegram 信号提供者 是一款易用、可完全自定义的工具,它使发送信号到 Telegram 成为可能,将您的账户变成信号提供者。 消息的格式 可以完全自定义! 但是,为了简便使用,您也可以选择一个预设模板,并能够启用或禁用消息的特定部分。 [ 演示 ]  [ 手册 ] [ MT5 版本 ] [ Discord 版本 ] [ Telegram 频道 ]  New: [ Telegram To MT5 ] 设置 可通过 用户指南 获取逐步说明。 无需了解 Telegram API;开发者提供所需的一切。 主要特性 自定义发送给订阅者的订单详情的能力 您可以创建分层订阅模型,例如铜牌、银牌、金牌。金牌订阅可获得所有信号等。 按订单号、符号或备注过滤订单 包括执行订单的图表的屏幕截图 在发送的屏幕截图上绘制已关闭的订单,以便额外验证 推迟发送新订单消息的可能性,以便在发送前对位置进行调整 订单详情的全透明度: 新的市场订单 *附带屏幕截图 订单修改(止损、获利点) 已关闭订单 *附带屏幕截图 部分关闭订单 ** 新的挂起订单 修改的挂起订单(进场价格) 挂起订单激活(
      Risk/Reward Tool是一款专业级EA(智能交易系统),旨在彻底改变您在MetaTrader 4中规划、可视化和执行交易的方式。无论您是重视精确风险管理的自主交易者,还是需要直观测试交易设置的策略开发者,这款工具都能在一个优雅直观的界面中提供您所需的一切。 与基础的仓位计算器不同,Risk/Reward Tool将可视化交易规划与即时执行功能、实时盈亏监控和全面的交易管理功能相结合。该工具与MT4策略测试器完全兼容,让您能够练习交易策略并完善方法,无需冒真实资金的风险。 完整使用手册请访问: https://www.mql5.com/en/blogs/post/766244 主要功能 可视化交易规划 可拖拽调整的入场、止损和止盈线 随交易参数调整实时更新的彩色风险/收益区域 基于ATR的自动止损计算,实现波动率调整的仓位管理 可配置的风险收益比,带可视化显示 支持市价单和挂单(限价单/止损单),根据入场线位置自动判断 智能仓位计算 以账户余额百分比或固定金额设置风险 实时手数计算,随止损移动自动更新 可通过上下按钮或直接输入调整风险 自动按经纪商规格标准化手数 一键交易执行
      Exp COPYLOT CLIENT for MT4
      Vladislav Andruschenko
      4.69 (65)
      MetaTrader 4 的交易复制器。     它从任何账户复制外汇交易、头寸、订单。 它是最好的贸易复印机之一     MT4 - MT4,MT5 - MT4     为了   复制 MT4     版本(或     MT4 - MT5 MT5 - MT5     为了   复制MT5     版本)。 MT5版本 详细描述   +DEMO +PDF 如何购买 如何安装     如何获取日志文件     如何测试和优化     Expforex 的所有产品 复印机 版本       MetaTrader 5 终端 (   МТ5 - МТ5, МТ4 - МТ5   )-   Copylot 客户端 MT5 独特的复制算法将所有交易从主账户准确复制到您的客户账户。 该产品还以其高运行速度而著称,并且具有强大的错误处理能力。 一组强大的功能。 该程序可以在多个终端绑定上运行。 使用它作为您在一个账户上交易的多个账户的交易 的同步器 , - COPYLOT 会将您的交易复制到其他终端。 从已关闭的账户中复制 Invest 密码; 部分关闭仅从 mt4 到 mt4 从模拟账户复制到
      X2 Copy MT4
      Liubov' Shkandrii
      探索革命性的X2 Copy MT4,体验即时交易复制。仅需10秒设置,您将获得一个强大的工具,以前所未有的速度(低于0.1秒)在单台Windows计算机或VPS上的MetaTrader终端之间同步交易。 无论您是在管理多个账户、跟随信号还是扩展策略,X2 Copy MT4都能以无与伦比的精确度和控制力适应您的工作流程。停止等待 — 以市场领先的速度和可靠性开始复制。立即下载 试用版 。 *重要提示:使用MT5终端需要单独的X2 Copy MT5版本 X2 Copy MT4/5 设置和功能说明 | 如何安装 X2 Copy 试用版 功能特点 高速复制 — 交易传输时间少于0.1秒 支持所有复制类型的通用支持:MT4>MT4, MT4>MT5, MT5>MT4, MT5>MT5 直观界面,10秒内即时设置 7/24 稳定运行 — 与Windows PC和Windows VPS完全兼容 灵活的账户间复制:真实 > 真实,真实 > 模拟,模拟 > 真实,模拟 > 模拟,适用于所有经纪商 多通道复制 — 能够从一个或多个发送方账户复制到一个或多个接收方账户 安全复制 (read-only) —
      Ultimate Extractor - Professional Trading Analytics for MT4 Ultimate Extractor transforms your MetaTrader 4 trading history into actionable insights with comprehensive analytics, interactive charts, and real-time performance tracking. Ability to combine multiple accounts and MT4 and MT5 into a single dashboard. What It Does Automatically analyzes your MT4 trading history across all Expert Advisors and generates detailed HTML reports with interactive visualizations. Tracks live performance metric
      Trade Dashboard MT4
      Fatemeh Ameri
      4.96 (53)
      疲于复杂的订单下达和手动计算?Trade Dashboard 是您的解决方案。凭借其用户友好的界面,订单下达变得轻而易举,只需点击一下,您就可以开设交易、设置止损和止盈水平、管理交易手数,并计算风险回报比,让您只需专注于您的策略。告别手动计算,使用 Trade Dashboard 简化您的交易体验。 立即下载演示版本 。 您可以在这里找到仪表盘功能和特性的详细信息 。 加入 Telegram 频道 。 购买后请给我发消息以获取支持。如果您需要添加更多功能,可以在产品的评论区留下您的想法,我愿意听取任何建议,希望您能在使用我的产品时获得最佳体验 。 这是 MT5 版本。 风险管理:使用 Trade Dashboard,可以将您的风险设置为账户余额或权益的百分比,或将风险设置为总金额。在图表上直观地定义您的止损,让工具准确计算每个货币对的适当手数。该工具还可以根据您期望的风险回报比自动设置止盈水平。它甚至可以在手数计算中涵盖佣金和点差费用。此外,您的止损和止盈可以转变为虚拟水平,隐藏于经纪商。通过 Trade Dashboard 的高级风险管理功能,掌控风险,保护您的资本。 交易线
      ManHedger MT4
      Peter Mueller
      5 (1)
      THIS EA IS A SEMI-AUTO EA, IT NEEDS USER INPUT. Manual & Test Version Please   DON'T BUY   this product before   TESTING  and watching my video about it. Contact me for user support or bug reports, or if you want the MT5 version! MT5 Version I do not guarantee any profits or financial success using this EA. With this Expert Advisor, you can: Implement your own   Zone Recovery   strategy to capitalize on trending markets. Create   Grid   trading strategies, to profit from ranging markets. Place
      News Filter EA: Advanced Algo Trading Assistant News Filter EA is an advanced algo trading assistant designed to enhance your trading experience. By using the   News Filter EA , you can integrate a Forex economic news filter into your existing expert advisor, even if you do not have access to its source code. In addition to the news filter, you can also specify   trading days   and   hours   for your expert. The News Filter EA also includes   risk management   and   equity protection   features
      The Ultimate Drawdown Recovery & Trade Protection EA for MT4! Your Trades Deserve a Second Chance. Give Them This Soldier. Struggling with floating losses or sudden drawdowns that threaten your account? Stop watching your trades drown in red and let the Ultimate Drawdown Recovery EA (UDR) recover, protect, and empower your trading strategy automatically. What Is UDR? UDR is an ultra-smart, lightning-fast MT4 Expert Advisor designed to recover drawdowns, secure break-even exits, manage trades wi
      Candlestick Pattern Scanner is a multi-timeframe and multi-symbol dashboard and alert system that checks all timeframes and currency pairs for different candlestick patterns that are formed in them. Scanner is integrated with support and resistance zones so you can check the candlestick patterns in the most important areas of the chart to find breakout and reversal patterns in the price chart. Download demo version   (works on M30,D1,W1 timeframes and 20 symbols of Market Watch window) Read the
      Telegram To MT4 Receiver
      Levi Dane Benjamin
      4.2 (5)
      将信号从您所属的任何渠道(包括私人和受限渠道)直接复制到您的 MT4。 该工具在设计时充分考虑了用户的需求,同时提供了管理和监控交易所需的许多功能。 该产品采用易于使用且具有视觉吸引力的图形界面。 自定义您的设置并在几分钟内开始使用该产品! 用户指南 + 演示  |     MT5版本  |     不和谐版本 如果您想尝试演示,请参阅用户指南。 Telegram To MT4 接收器在策略测试器中不起作用! Telegram 至 MT4 功能 一次复制多个通道的信号 从私人和受限频道复制信号 不需要机器人令牌或聊天 ID(如果出于某种原因需要,您仍然可以使用这些) 使用风险百分比或固定手数进行交易 排除特定符号 选择复制所有信号或自定义要复制的信号 配置单词和短语以识别所有信号(默认值应适用于 99% 的信号提供商) 配置时间和日期设置以仅在需要时复制信号 设置一次打开的最大交易量 交易和头寸管理 使用信号或自动设置的管理 通过设置每月、每周、每天、每小时或每分钟的最大交易次数,停止过度交易和报复性交易。 支持市价订单和挂单 每日最大利润目标(以美元为单位)以确保头寸并停止过度
      一旦您確定了要進行交易的關鍵區域,就會自動交易支撐和阻力或供需區域。該 EA 允許您只需單擊即可繪製買入和賣出區域,然後將它們準確地放置在您預期價格轉向的位置。然後,EA 會監控這些區域,並根據您為這些區域指定的價格行為自動進行交易。一旦進行初始交易,EA 就會在您放置的相反區域(即目標區域)獲利。然後,您有兩種選擇,要么關閉交易並繪製新的區域進入,要么獲利退出並立即反向反向交易,創建「始終在」的市場風格策略。 包含輸入和策略的完整手冊位於: https://www.mql5.com/en/blogs/post/760256 該 EA 專為在市場上不使用固定或硬止損的頭寸交易者或美元成本平均交易策略而設計。相反,它的目的是透過在下一個可用支撐或阻力區域以相同方向進行新交易來縮小不正確的交易,並調整您在市場中頭寸的平​​均價格。如果需要的話,還有備用退出標準,形式為每筆交易的最大損失金額或基於時間的退出。 只需按下按鈕即可繪製準備放置在感興趣等級的區域。 關閉按鈕和關閉最舊的按鈕可退出所有交易,或僅退出舊交易(如果它們跌幅過大而無法立即調整您的平均頭寸)。 適用於任何時間範圍內的
      Take a Break
      Eric Emmrich
      5 (30)
      The most advanced news filter on MQL market - free demo available Take a Break has transformed from a basic news filter into a comprehensive account protection solution. It seamlessly pauses any other Expert Advisors during news events or based on your custom filters, all while safeguarding your EA settings - restoring them automatically when trading resumes for complete peace of mind. Typical use cases: A single news filter for all your EAs. Stop trading during news/high volatility (+ close all
      Telegram to MT4 Coppy
      Sergey Batudayev
      3.57 (7)
      Telegram 到 MT4: 终极信号复制解决方案 使用 Telegram 转 MT4 简化您的交易流程,这款先进的实用程序旨在将交易信号直接从 Telegram 频道和聊天复制到您的 MetaTrader 4 平台,无需 DLL 文件。这款强大的解决方案确保信号执行的无缝衔接,拥有无与伦比的精度和丰富的自定义选项,从而节省您的时间并提高您的效率。 [ Instructions and DEMO ] 主要特点 直接 Telegram API 集成 通过电话号码和安全码进行身份验证。 使用用户友好的 EXE 桥轻松获取和管理聊天 ID。 添加、删除和刷新多个频道/聊天以同时复制信号。 使用高级过滤器进行信号解析 跳过包含自定义例外词(例如“报告”、“摘要”)的不需要的信号。 支持灵活的 SL 和 TP 格式:价格、点数或点数。 当信号指定点而不是价格时自动计算入场点。 订单定制和灵活性 使用多种模式定制订单规模:固定手数、动态手数(% 风险)或特定符号手数。 使用信号数据或自定义参数调整 SL/TP。 配置滑点、挂单到期和重试设置以实现完美执行。 综合符号管理 排除特定符号或匹配自定义
      秒级图表 (Seconds Chart) — 一款专为 MetaTrader 4 设计的独特工具,用于创建秒级时间框架的图表。 通过 秒级图表 ,您可以构建以秒为单位的时间框架图表,获得标准分钟或小时图表无法提供的极致灵活性和分析精度。例如,时间框架 S15 表示每根蜡烛图持续15秒。您可以使用任何指标、智能交易系统和脚本,操作方式与标准图表同样便捷。 与标准工具不同, 秒级图表 让您能够在超短时间框架下进行高精度交易,无延迟干扰。 秒级图表的优势 支持 1至900秒 的时间框架图表。 即时加载 历史数据,通过从MT5终端导入Tick数据库。 要导入tick数据,首先需要在MT5终端中启动 Tick Database 工具。 数据实时更新, 无延迟或滞后 。 可同时创建 多个秒级图表 。 秒级图表的理想应用场景 剥头皮交易 和高频交易。 精确的入场和出场时机。 在短时间框架下测试交易策略。 时间框架设置 默认设置包含以下时间框架: S1、S2、S3、S4、S5、S6、S10、S12、S15、S20、S30、S40 。 你可以轻松设置你的秒级时间框架,从 1 到 900 秒 。 可配置参
      The product will copy all  Discord  signal   to MT4   ( which you are member  ) , also it can work as remote copier.  Easy to set up. Work with almost signal formats, support to translate other language to English Work with multi channel, multi MT4. Work with Image signal. Copy order instant, auto detect symbol. Work as remote copier: with signal have ticket number, it will copy exactly via ticket number. How to setup and guide: Let read all details about setup and download Discord To MetaTrader
      Trade Manager MT4 DaneTrades
      Levi Dane Benjamin
      4.09 (11)
      交易管理器可帮助您快速进入和退出交易,同时自动计算风险。 包括帮助您防止过度交易、报复性交易和情绪化交易的功能。 交易可以自动管理,账户绩效指标可以在图表中可视化。 这些功能使该面板成为所有手动交易者的理想选择,并有助于增强 MetaTrader 4 平台。多语言支持。 MT5版本  |  用户指南+演示 交易经理在策略测试器中不起作用。 如需演示,请参阅用户指南 风险管理 根据%或$自动调整风险 可选择使用固定手数或根据交易量和点自动计算手数 使用 RR、点数或价格设置盈亏平衡止损 追踪止损设置 最大每日损失百分比,在达到目标时自动平仓所有交易。 保护账户免遭过多提款并阻止您过度交易 最大每日损失(以美元为单位)在达到目标时自动关闭所有交易。 保护账户免遭过多提款并阻止您过度交易 一键实现所有交易的盈亏平衡 自动计算从手机/电话发送的交易的风险 OCO 在设置中可用 交易和头寸管理 通过设置每月、每周、每天、每小时或每分钟的最大交易次数,停止过度交易和报复性交易。 高级挂单管理。 调整何时关闭挂单的规则 追踪挂单 支持市价订单和挂单 每日最大利润目标(以美元为单位)以确保头寸并停止
      The Expert Advisor will help you forward all pop-up alert with screenshot from  MetaTrader 4 to Telegram channel/ group, also forward all notifications to Telegram. Parameters  -  Telegram Bot Token - create bot on Telegram and get token.  -  Telegram Chat ID  - input your Telegram user ID,  group / channel ID  -  Forward Alert - default true, to forward alert.  -  Send message as caption of Screenshot - default false, set true to send message below Screenshot  How to setup and guide  - Telegram
      EchoTrade Telegram to MT4 Copier
      Perpetual Chinemerem Vincent
      5 (2)
      EchoTrade Telegram to MT5 Copier Seamless, Instant, and Reliable Signal Copying - Direct from Telegram to MetaTrader 4! The product does not run in the strategy tester but you can get free trial version   here  for testing before purchase. Tired of manually executing trades from Telegram signals? EchoTrade automates the process, instantly copying trades from any Telegram channel or group directly into your MT5 account—accurately, efficiently, and without delay. Key Features: Universal Compatib
      EasyInsight AIO MT4
      Alain Verleyen
      4 (2)
      EASY Insight AIO – 全能智能交易一站式解决方案 概述 想象一下,您可以在几秒钟内扫描整个市场——外汇、黄金、加密货币、指数,甚至股票——无需手动筛选图表、繁琐安装或配置指标。 EASY Insight AIO 是您专为 AI 交易打造的即装即用数据导出工具。它将整个市场快照一次性输出为简洁的 CSV 文件,直接支持 ChatGPT、Claude、Gemini、Perplexity 等各类 AI 平台的即时分析。 无需窗口切换,无需图表叠加,也没有任何杂乱。只需纯净、结构化的数据自动导出,让您专注于基于数据的高效决策,无需再盯盘耗时。 为什么选择 EASY Insight AIO? 真正的一体化 • 无需设置,无需安装指标,无图表叠加。只需安装、运行并导出——就是这么简单。 多资产全覆盖 • 扫描分析外汇、金属、加密货币、指数、股票——您的券商所能提供的一切市场。 AI 专属数据导出 • 高度结构化、针对 AI 优化的 CSV 文件,直接适配主流智能工具和平台。 完整导出内容: • 三个可选周期的货币强度分析 • 净多头头寸变化体现市场情绪 • 成交量变化、
      The News Filter
      Leolouiski Gan
      5 (25)
      这个产品在新闻时间过滤所有的专家顾问和手动图表,因此您不必担心突然的价格波动会破坏您的手动交易设置或其他专家顾问输入的交易。此产品还带有完整的订单管理系统,可在任何新闻发布前处理您的持仓和挂单。一旦您购买了 The News Filter ,您将不再需要依赖以后的专家顾问内置的新闻过滤器,因为这个产品可以从此过滤它们所有。 新闻选择 新闻来源于Forex Factory的经济日历。 选择可以基于任何一种货币,如USD,EUR,GBP,JPY,AUD,CAD,CHF,NZD和CNY等。 选择也可以基于关键识别,例如Non-Farm (NFP),FOMC,CPI等。 能够选择新闻影响级别的筛选,从低、中、到高影响。 自动模式只选择与图表相关的新闻。 新闻来源每小时自动刷新,以确保最新的新闻数据。 为每个新闻影响级别提供单独的输入,以确定您要过滤掉的新闻发布前后的分钟数。 订单管理选项 在新闻发布前关闭未平仓头寸的选项,并在新闻发布后恢复它们。 在新闻发布前删除挂单的选项,并在新闻发布后恢复它们。 在新闻发布前移除止损和止盈水平的选项,并在新闻发布后恢复它们。 在新闻发布前移动止损和止盈
      作者的更多信息
      Do you think it's a bit cumbersome when you need to switch symbols or timeframes with mouse click? 1. What is this? This is a program that can switch symbols and timeframes with direction keys. Fast switching, very convenient, no mouse click required. For traders, one symbol with multi-timeframe charts are usually added,  you can change symbol on those charts easily. For multi-currency traders, different symbol charts are usually added, you can also change those timeframes easily. I wrote this p
      1.这是什么         上涨波动和下降波动是不一样的,无论是学术研究还是实际检验都说明了这一点。         原始的ATR指标是把上涨波动和下降波动放在一起进行计算。本指标则是把上涨波动和下降波动分开进行计算,这样能更好的帮助你研究市场。 2.指标说明         本指标的计算有两种模式,如下表所示: 0 1 2 3 4 5 波动方向 + - + + - + TR 15 20 17 5 16 8 原始ATR (15+20+17+5+16+8)/6=13.5 模式1 不以0填充位置,周期数改变 模式1上涨TR 15 17 5 8 模式1下跌TR 20 16 模式1上涨ATR (15+17+5+8)/4=11.25 模式1下跌ATR (20+16)/2=18 模式2 以0填充位置,周期数不变 模式2上涨TR 15 0 17 5 0 8 模式2下跌TR 0 20 0 0 16 0 模式2上涨ATR (15+0+17+5+0+8)/6=7.5 模式2下跌ATR (0+20+0+0+16+0)/6=6         如上表。比如周期为6的序列中,有4个上涨2个下跌。模式1不
      1.这是什么: 下载Market Watch中所有的Symbol数据到系统。PS:不是把数据输出到文档。 2.为什么要用这个: 如果系统中没有数据:网络链接不好的时候,用MT5看一个Symbol需要等待很长时间;在不同Symbol或不同TimeFrame切换,如果系统没有数据也需要等待很久;如果进行长时间回测,系统没有数据,需要下载很长时间。 所以提前把历史数据下载到系统中,能提高工作效率。 3.怎么使用: parameters: input bool bool_usualtimeframe=true; //true-系统默认TimeFrames; || false-所有的TimeFrames. input bool bool_allSymbol=true; //true-Market Watch中所有品种; || false-根据你的输入 input string input_Symbol=NULL; //上面参数为false时,输入你的Symbol名称 input datetime time_Start=D'2017.01.01'; //默认数据下载开始时间 input int s
      Do you think it's a bit cumbersome when you need to switch symbols or timeframes with mouse click? 1. What is this? This is a program that can switch symbols and timeframes with direction keys. Fast switching, very convenient, no mouse click required. For traders, one symbol with multi-timeframe charts are usually added,  you can change symbol on those charts  easily . For multi-currency traders, different symbol charts are usually added, you can also change those timeframes easily. I wrote thi
      According to trading experience: Some symbols are easy to reverse on certain days, such as Monday, or afternoon, and so on. So comparing the current price with the corresponding historical moment price is valuable. If the price coordinate system uses a logarithmic price, you will get a lot of valuable information. 1. What is this? This program can convert the symbol price and add it to your Chart. You can compare it with your major chart. The DEMO version Link: https://www.mql5.com/en/market/pr
      What is this: Violent trading: means sending a large number of orders to your brokerage server,  it can conduct a stress test of the trading. In this program you can run a variety of trading tests.  Now you can trade at high speed, For example 1000 orders in an instant. The Demo version's link:  https://www.mql5.com/en/market/product/38431/ Why to use: Whether manual trading or EA trading,  the status of the broker server is very important. So it is beneficial to conduct a trading stress test on
      1. Why did I develop this series of indicators I found that most traders need to use multiple time frame indicators. They usually switch time frame to see indicators. However, once the timeframe is switched, you cannot see the  corresponding relationship  between  the price in the smaller timeframe  and  the indicator in the larger timeframe . For example: if your price chart is in H1 timeframe, you can see H4, D1 and W1 indicators in H1 timeframe Chart. This is more helpful for you to find th
      1. Why did I develop this series of indicators I found that most traders need to use multiple time frame indicators. They usually switch time frame to see indicators. However, once the timeframe is switched, you cannot see the  corresponding relationship  between  the price in the smaller timeframe  and  the indicator in the larger timeframe . For example: if your price chart is in H1 timeframe, you can see H4, D1 and W1 indicators in H1 timeframe Chart. This is more helpful for you to find th
      1. Why did I develop this series of indicators I found that most traders need to use multiple time frame indicators. They usually switch time frame to see indicators. However, once the timeframe is switched, you cannot see the  corresponding relationship  between  the price in the smaller timeframe  and  the indicator in the larger timeframe . For example: if your price chart is in H1 timeframe, you can see H4, D1 and W1 indicators in H1 timeframe Chart. This is more helpful for you to find th
      1. Why did I develop this series of indicators I found that most traders need to use multiple time frame indicators. They usually switch time frame to see indicators. However, once the timeframe is switched, you cannot see the  corresponding relationship  between  the price in the smaller timeframe  and  the indicator in the larger timeframe . For example: if your price chart is in H1 timeframe, you can see H4, D1 and W1 indicators in H1 timeframe Chart. This is more helpful for you to find th
      1. Why did I develop this series of indicators I found that most traders need to use multiple time frame indicators. They usually switch time frame to see indicators. However, once the timeframe is switched, you cannot see the  corresponding relationship  between  the price in the smaller timeframe  and  the indicator in the larger timeframe . For example: if your price chart is in H1 timeframe, you can see H4, D1 and W1 indicators in H1 timeframe Chart. This is more helpful for you to find th
      1. Why did I develop this series of indicators I found that most traders need to use multiple time frame indicators. They usually switch time frame to see indicators. However, once the timeframe is switched, you cannot see the  corresponding relationship  between  the price in the smaller timeframe  and  the indicator in the larger timeframe . For example: if your price chart is in H1 timeframe, you can see H4, D1 and W1 indicators in H1 timeframe Chart. This is more helpful for you to find th
      1. Why did I develop this series of indicators I found that most traders need to use multiple time frame indicators. They usually switch time frame to see indicators. However, once the timeframe is switched, you cannot see the  corresponding relationship  between  the price in the smaller timeframe  and  the indicator in the larger timeframe . For example: if your price chart is in H1 timeframe, you can see H4, D1 and W1 indicators in H1 timeframe Chart. This is more helpful for you to find th
      1. Why did I develop this series of indicators I found that most traders need to use multiple time frame indicators. They usually switch time frame to see indicators. However, once the timeframe is switched, you cannot see the  corresponding relationship  between  the price in the smaller timeframe  and  the indicator in the larger timeframe . For example: if your price chart is in H1 timeframe, you can see H4, D1 and W1 indicators in H1 timeframe Chart. This is more helpful for you to find th
      1. Why did I develop this series of indicators I found that most traders need to use multiple time frame indicators. They usually switch time frame to see indicators. However, once the timeframe is switched, you cannot see the  corresponding relationship  between  the price in the smaller timeframe  and  the indicator in the larger timeframe . For example: if your price chart is in H1 timeframe, you can see H4, D1 and W1 indicators in H1 timeframe Chart. This is more helpful for you to find th
      1. Why did I develop this series of indicators I found that most traders need to use multiple time frame indicators. They usually switch time frame to see indicators. However, once the timeframe is switched, you cannot see the  corresponding relationship  between  the price in the smaller timeframe  and  the indicator in the larger timeframe . For example: if your price chart is in H1 timeframe, you can see H4, D1 and W1 indicators in H1 timeframe Chart. This is more helpful for you to find th
      1. Why did I develop this series of indicators I found that most traders need to use multiple time frame indicators. They usually switch time frame to see indicators. However, once the timeframe is switched, you cannot see the  corresponding relationship  between  the price in the smaller timeframe  and  the indicator in the larger timeframe . For example: if your price chart is in H1 timeframe, you can see H4, D1 and W1 indicators in H1 timeframe Chart. This is more helpful for you to find th
      1. Why did I develop this series of indicators I found that most traders need to use multiple time frame indicators. They usually switch time frame to see indicators. However, once the timeframe is switched, you cannot see the  corresponding relationship  between  the price in the smaller timeframe  and  the indicator in the larger timeframe . For example: if your price chart is in H1 timeframe, you can see H4, D1 and W1 indicators in H1 timeframe Chart. This is more helpful for you to find th
      1. Why did I develop this series of indicators I found that most traders need to use multiple time frame indicators. They usually switch time frame to see indicators. However, once the timeframe is switched, you cannot see the  corresponding relationship  between  the price in the smaller timeframe  and  the indicator in the larger timeframe . For example: if your price chart is in H1 timeframe, you can see H4, D1 and W1 indicators in H1 timeframe Chart. This is more helpful for you to find th
      1. Why did I develop this series of indicators I found that most traders need to use multiple time frame indicators. They usually switch time frame to see indicators. However, once the timeframe is switched, you cannot see the  corresponding relationship  between  the price in the smaller timeframe  and  the indicator in the larger timeframe . For example: if your price chart is in H1 timeframe, you can see H4, D1 and W1 indicators in H1 timeframe Chart. This is more helpful for you to find th
      1. Why did I develop this series of indicators I found that most traders need to use multiple time frame indicators. They usually switch time frame to see indicators. However, once the timeframe is switched, you cannot see the  corresponding relationship  between  the price in the smaller timeframe  and  the indicator in the larger timeframe . For example: if your price chart is in H1 timeframe, you can see H4, D1 and W1 indicators in H1 timeframe Chart. This is more helpful for you to find th
      1. Why did I develop this series of indicators I found that most traders need to use multiple time frame indicators. They usually switch time frame to see indicators. However, once the timeframe is switched, you cannot see the  corresponding relationship  between  the price in the smaller timeframe  and  the indicator in the larger timeframe . For example: if your price chart is in H1 timeframe, you can see H4, D1 and W1 indicators in H1 timeframe Chart. This is more helpful for you to find th
      1. Why did I develop this series of indicators I found that most traders need to use multiple time frame indicators. They usually switch time frame to see indicators. However, once the timeframe is switched, you cannot see the  corresponding relationship  between  the price in the smaller timeframe  and  the indicator in the larger timeframe . For example: if your price chart is in H1 timeframe, you can see H4, D1 and W1 indicators in H1 timeframe Chart. This is more helpful for you to find th
      1. Why did I develop this series of indicators I found that most traders need to use multiple time frame indicators. They usually switch time frame to see indicators. However, once the timeframe is switched, you cannot see the  corresponding relationship  between  the price in the smaller timeframe  and  the indicator in the larger timeframe . For example: if your price chart is in H1 timeframe, you can see H4, D1 and W1 indicators in H1 timeframe Chart. This is more helpful for you to find th
      1. Why did I develop this series of indicators I found that most traders need to use multiple time frame indicators. They usually switch time frame to see indicators. However, once the timeframe is switched, you cannot see the  corresponding relationship  between  the price in the smaller timeframe  and  the indicator in the larger timeframe . For example: if your price chart is in H1 timeframe, you can see H4, D1 and W1 indicators in H1 timeframe Chart. This is more helpful for you to find th
      1. Why did I develop this series of indicators I found that most traders need to use multiple time frame indicators. They usually switch time frame to see indicators. However, once the timeframe is switched, you cannot see the  corresponding relationship  between  the price in the smaller timeframe  and  the indicator in the larger timeframe . For example: if your price chart is in H1 timeframe, you can see H4, D1 and W1 indicators in H1 timeframe Chart. This is more helpful for you to find th
      1. Why did I develop this series of indicators I found that most traders need to use multiple time frame indicators. They usually switch time frame to see indicators. However, once the timeframe is switched, you cannot see the  corresponding relationship  between  the price in the smaller timeframe  and  the indicator in the larger timeframe . For example: if your price chart is in H1 timeframe, you can see H4, D1 and W1 indicators in H1 timeframe Chart. This is more helpful for you to find th
      筛选:
      Agnaldo Donizete Prata
      701
      Agnaldo Donizete Prata 2022.12.12 21:01 
       

      用户没有留下任何评级信息

      Yu Zhang
      6836
      来自开发人员的回复 Yu Zhang 2022.12.13 06:20
      Hey, if the client has no data, its synchronization will be delayed until the corresponding data is available.
      Not add this tool to your first open chart, add it to other chart. Your First Open chart is your control chart, others will sync to it.
      Stephenpt
      100
      Stephenpt 2022.02.26 09:00 
       

      Just bought, and testing it. When i am not so sure, Yu Zhang always there to help me. Thank you!

      OwnThem89
      105
      OwnThem89 2020.01.09 00:12 
       

      用户没有留下任何评级信息

      [删除] 2019.05.12 12:14 
       

      用户没有留下任何评级信息

      [删除] 2019.05.12 10:37 
       

      用户没有留下任何评级信息

      回复评论