I am a senior practitioner in Fintech industry. And I have done a lot of academic research on financial markets. From 2012, I work as a Quant. Forex, stock and futures are my main trading varieties. I can use MQL4, MQL5, C++, MySql, and Python.
GDS Renko Adaptive - Adaptive Renko Chart Indicator for MetaTrader 5 GDS Renko Adaptive is a free adaptive Renko chart indicator for MetaTrader 5. It helps traders observe price movement through a more flexible Renko structure instead of relying only on one fixed brick-size view. The purpose of this tool is to support manual Renko analysis by making structure, movement rhythm and changing market conditions easier to observe. It does not predict the market and does not generate buy or sell signal
GDS Renko Matrix - Free Multi-Scale Renko Overview Indicator for MetaTrader 5 GDS Renko Matrix is a free multi-scale Renko overview indicator for MetaTrader 5. It helps traders monitor Renko structure, direction and chart context in a compact matrix-style view. The purpose of this tool is to provide a faster visual overview of Renko behavior without turning the chart into a signal system. It does not predict the market and does not generate buy or sell signals. What Renko Matrix Shows Renko char
Bonus when buying an indicator or an advisor from my list. Write to me in private messages to receive a bonus. Manual Assistant MT5 is a professional manual trading tool that will make your trading fast and comfortable. It is equipped with all the necessary functions that will allow you to open, maintain and close orders and positions with one click. It has a simple and intuitive interface and is suitable for both professionals and beginners.
The panel allows you to place buy and sell orders w
GDS Renko Ghost Free Renko Market Memory Visualization Indicator for MetaTrader 5 GDS Renko Ghost is a free MetaTrader 5 indicator for traders who use Renko charts and want to study how similar Renko structures behaved in the past. The indicator visualizes historical Renko memory: similar past structures, continuation paths, consensus behavior and uncertainty zones. It does not give buy or sell signals. It does not predict price movement. It is a visual research and context tool for manual Renko
Overview FiT Panel Pro is a professional-grade trade management panel designed for MetaTrader 5 traders who demand speed, precision, and full control over their trades. Built with a modern dark-theme UI, it combines one-click execution with advanced risk management, visual SL/TP drag lines, automatic Fibonacci-based levels, and comprehensive order management — all in a single, compact panel. Whether you are a scalper, day trader, or swing trader, FiT Panel Pro gives you the edge you need to exec
BTC Scalper - Automated RSI Breakout Strategy for BTCUSD Unlock the power of automated trading with BTC Scalper! This expert advisor is a fully autonomous trading strategy, designed to capitalize on fast-moving BTCUSD markets. It leverages a potent combination of RSI Breakouts and two Exponential Moving Averages (EMA) to find high-probability trade entries, ensuring optimal confluence for success. Key Features: Fully Automated Trading : Set it, forget it, and let BTC Scalper handle your trades 2
GDS Renko Pip ST Chart - Pip-Based Renko Chart Indicator for MetaTrader 5 GDS Renko Pip ST Chart is a pip-based Renko chart indicator for MetaTrader 5. It helps traders build and study cleaner Renko price movement using a practical fixed pip or point-based brick structure. This tool is designed as a Renko chart foundation for manual analysis. It does not predict the market, does not generate buy or sell signals and does not decide whether a trade should be opened. What Pip ST Chart Does Renko ch
GDS Renko Pip ST - Fixed Brick Renko Chart Tool for MetaTrader 5 GDS Renko Pip ST is a Renko chart tool for MetaTrader 5 designed for traders who want to build and study fixed brick Renko movement using a practical pip or point-based setup. The purpose of this tool is simple: create a cleaner Renko structure so the trader can observe direction, brick runs, pullbacks, support and resistance behavior without normal candle noise. This is not a signal indicator and it does not predict the market. It
This indicator creates a Renko-based custom symbol in MetaTrader 5. Renko charts are built using price movement only, not time, making them useful for analyzing trends and filtering noise. Features Customizable brick size in points. Option to calculate brick size using ATR (adaptive). Ability to show or hide wicks. Creates and updates a custom Renko chart symbol. Automatically opens the chart window (optional). Maintains a limited bar history for performance. Inputs BrickSizePoints – brick size
GDS Renko Anatomy Free Renko Structure and Movement Anatomy Indicator for MetaTrader 5 GDS Renko Anatomy is a free MetaTrader 5 indicator for traders who use Renko charts and want a clearer way to understand how brick-based movement is built. The indicator helps visualize Renko movement anatomy: structure, legs, pullbacks, pauses, continuation areas and weakening movement phases. It does not give buy or sell signals. It does not predict price movement. It is a visual context tool for manual Renk
GDS RiskLab TradeDesk Free Manual Trading Desk and Risk-Control Utility for MetaTrader 5 GDS RiskLab TradeDesk is a free chart-based utility for traders who want a cleaner manual trading workspace in MetaTrader 5. It is designed as a simple execution-support and risk-control panel. The goal is to keep the trading process more organized: review the chart, plan the trade, keep risk visible and execute manually with more structure. This tool does not generate buy or sell signals. It does not predic
Are you tired of drawing trendlines every time you're analyzing charts? Or perhaps you would like more consistency in your technical analysis. Then this is for you. This indicator will draw trend lines automatically when dropped on a chart. How it works Works similar to standard deviation channel found on mt4 and mt5. It has 2 parameters: 1. Starting Bar 2. Number of bars for calculation The starting bar is the bar which drawing of the trend lines will begin, while the number of bars for c
CosmiCLab SMC FIBO CosmiCLab SMC FIBO is a professional trading indicator designed for traders who use Smart Money Concepts (SMC), market structure analysis and Fibonacci retracement levels. The indicator automatically detects market swings and builds Fibonacci levels based on the latest impulse movement.
It also identifies market structure changes such as BOS (Break of Structure) and CHOCH (Change of Character), helping traders understand the current market direction. CosmiCLab SMC FIBO also pr
GLX1 Renko Builder Expert Advisor (EA) can create the Renko bar charts on any symbol. The Renko charts are generated as real-time custom symbol charts which can be further used for technical analysis with any MT5 compatible indicator.
Find the free GLX1 Renko Euro Expert Advisor from here. https://www.mql5.com/en/market/product/115074
Included Features:
Truly responsive Renko Charting on a custom symbol chart Accurate automatic live chart update Ability to attach any MT5 indicator Abi
================================================================ MATRIX CONDITION MONITOR Live Trade Condition Panel for MetaTrader 5 Fully Automatic -- Works with ALL Matrix EAs ================================================================
NEVER MISS A TRADE SETUP AGAIN
Matrix Condition Monitor is a free utility that attaches to any chart and automatically checks all 10 trade conditions in real time -- showing you exactly why a trade will or will not open, and alerting you the moment ever
This indicator allows to display Renko charts in the indicator window. Renko charts show only price movements that are bigger than the specified box size. It helps to eliminate noise and allows to focus on main trends.
Time is not a factor here. Only price movements are taken into account. That's why Renko chart is not synchronized with the main chart it is attached to. Indicator works in two modes: CLOSE - only close prices are taken into account while building the chart HIGH_LOW - only high/l
Introducing Order Blocks Breaker , a brand-new way to identify and leverage order blocks in your trading strategy. After developing multiple order block tools with unique concepts, I’m proud to present this tool that takes things to the next level. Unlike previous tools, Order Blocks Breaker not only identifies order blocks but also highlights Breaker Order Blocks —key areas where the price is likely to retest after a breakout. MT4 - https://www.mql5.com/en/market/product/124101/ This t
Recluse FX is the ultimate trading system for US30 on the H1 chart. With dedicated stop-loss and take-profit for each order, it guarantees optimal performance and risk management. Validated across over 1200 trades since 2021 with a 100% win rate, Recluse FX delivers unmatched stability and consistent gains under all market conditions. Its progressive pricing means that after 50 copies are sold, the system becomes exclusive to its owners. Purchase Recluse FX now and message for free access to th
Gold Trader Pro is an advanced analytical tool specifically engineered for professional trading on XAUUSD (Gold). It provides an immediate comprehensive overview of market structure across 7 different timeframes, allowing traders to identify flow direction and signal strength through a modern, draggable, and interactive interface.
Key Features
Multi-Timeframe Analysis: Real-time monitoring of M1, M5, M15, M30, H1, H4, and D1.
Two Operational Modes: MODE_SCALPING: Optimized for fast-paced analys
FREE Prop Firm Navigator EA - Advanced Trend-Following & Protection Developed by the EA Trading Academy team using Expert Advisor Studio , this free trading robot combines powerful trend-following indicators with a robust set of account protection features to secure your trading capital. You can find a detailed documentation about the properties and inputs on our knowledge base . Key Strategy Features: Uses Bulls Power and Awesome Oscillator indicators for precise entry signals Sophisticat
================================================================================ POC BREAKOUT - V20.72. Full Professional Grade Toolkit ================================================================================ POC Breakout is a full MetaTrader 5 trading dashboard for discretionary traders who want breakout signals, Point of Control (POC) context, volume profiles, order flow, market structure, news, alerts, and advanced trade planning in one professional workspace. Attached directly to you
Attention: You can view the program operation in the free version YuClusters DEMO . YuClusters is a professional market analysis system. The trader has unique opportunities to analyze the flow of orders, trade volumes, price movements using various charts, profiles, indicators, and graphical objects. YuClusters operates on data based on Time&Sales or ticks information, depending on what is available in the quotes of a financial instrument. YuClusters allows you to build graphs by combining da
Welcome to ENTRY IN THE ZONE WITH SMC MULTI TIMEFRAME Entry In The Zone with SMC Multi Timeframe is a professional trading indicator built on Smart Money Concepts (SMC), combining market structure analysis with a No Repaint BUY / SELL signal system in a single indicator. It helps traders understand market structure more clearly, identify key price zones, and focus on higher-quality trading opportunities. By combining Multi-Timeframe Analysis, Points of Interest (POIs), and real-time signals, t
Anchor: The EA Manager Run your full EA portfolio without conflicts, without stacked risk, and without watching every chart yourself. Anchor coordinates up to 64 Expert Advisors on a single account, including daily loss protection built for prop firm rules. Attach Anchor to any chart. Type your EA names and magic numbers in one line. Click OK. Anchor begins coordinating immediately. Built for portfolios. Built for prop firms. Built for discipline. The Problem Running multiple EAs on the same acc
Unlimited Trade Copier Pro MT5 is a tool to copy trade remotely to multiple MT4, MT5 and cTrader accounts at different computers/locations over internet. This is an ideal solution for you if you are a signal provider and want to copy your trades to other receivers globally on your own rules. One provider can copy trades to multiple receivers and one receiver can get trade from multiple providers as well. The provider can even set the subscription expiry for each receiver, so that receiver will n
LIMITED SUMMER SALE -40% ! ONLY $470 insead of $790! Maximum real discount! ONLY UNTIL 08/22 The core idea: using the user interface, you configure the parameters the chart must meet before entering a position (or positions), choose which entry models to use, and set the rules for when trading and planning should end. Lazy Trader handles the rest: it takes over all the routine chart watching and execution! full description :: 3 key videos [1] -> [2] -> [3]
What can it do?
- Understand
FUTURES ORDERFLOW FOOTPRINT CHART Professional OrderFlow EA for MetaTrader 5
Version 1.01| Professional tool for real traders | Institutional-Grade Visualization
STRATEGY TESTER USERS - PLEASE SELECT EVERY REAL TICK WHEN TESTING AND YOU HAVE DOWNLOADED HISTORICAL DATA. IF YOU SEE A WAITING SCREEN AND IT IS NOT DOWNLOADING, IT MEANS YOU HAVE LOW HISTORICAL DATA. TRY 1 MIN AND 5 MIN FIRST ON 1 DAY DATA. ONE DAY DATA SHOULD BE THE NEWEST AND MOST CURRENT DATE. PLEASE WAIT UNTIL THE MARKET HAS ROL
EA Auditor is an independent analysis tool for traders evaluating Expert Advisors and trading signals on MetaTrader 5. It audits backtest reports, reviews posted developer signals, and cross-verifies the two against each other to help traders assess strategies before committing capital.
The MQL5 market offers a wide range of Expert Advisors from many developers, with varying approaches, quality, and transparency. EA Auditor provides a consistent, data-driven framework for reviewing them, answer
THIS EA IS A SEMI-AUTO EA, IT NEEDS USER INPUT. Manual & Test Version Please TEST this product before BUYING and watch my video about it. The price of the ManHedger will increase to 250$ after 20 copies sold. Contact me for user support or bug reports or if you want the MT4 version! MT4 Version I do not guarantee any profits or financial success using this EA.
With this Expert Advisor, you can: Implement your own Zone Recovery strategy to capitalize on trending markets. Create Grid trading s
Timeless Charts is an all-in-one trading utility for professional traders. It combines custom chart types such as Seconds Charts and Renko with advanced order flow analysis using Footprints , Clusters , Volume Profiles , VWAP studies, and anchored analysis tools for deeper market insight. Trading and position management are handled directly from the chart through an integrated trade management panel , while Market Replay and Virtual Accounts provide environments for practicing trading skills and
The product will copy all telegram signal to MT5 ( which you are member) , also it can work as remote copier. Easy to set up, copy order instant, can work with almost signal formats, image signal, s upport to translate other language to English Work with all type of channel or group, even channel have "Restrict Saving Content", work with multi channel, multi MT5 Work as remote copier: with signal have ticket number, it will copy exactly via ticket number. Support to backtest signal. How to s
Footprint Chart Pro — Professional OrderFlow EA for MetaTrader 5
Version 6.34 | Professional tool for real traders | Institutional-Grade Visualization DEMO USERS - PLEASE SELECT EVERY TICK / REAL TICK WHEN TESTING AND YOU HAVE DOWNLOADED HISTORICAL DATA. IF YOU SEE A WAITING SCREEN AND IT IS NOT DOWNLOADING, IT MEANS YOU HAVE LOW HISTORICAL DATA. TRY 1 MIN AND 5 MIN FIRST ON 1 DAY DATA. ONE DAY DATA SHOULD BE THE NEWEST AND MOST CURRENT DATE. PLEASE WAIT UNTIL THE MARKET HAS ROLLED OVER PERIOD.
Quant AI Agents are independent trading Expert Advisors. Instead of trading using a fixed strategy like other conventional EAs, Quant AI Agents is a multi-agent AI trading framework that turns natural-language strategy prompts into live.
WANT THE SAME RESULTS AS MY LIVE SIGNAL? Use the exact same brokers I do: IC MARKETS , IC TRADING . Unlike the centralized stock market, Forex has no single, unified price feed. Every broker sources liquidity from different providers, creating un
Equity Protect Pro:全方位账户保护专家,让您的交易更安心 如果您正在寻找账户保护、净值保护、投资组合保护、多策略保护、利润保护、利润收割、交易安全、风控程序、自动风控、自动清仓、条件清仓、定时清仓、动态清仓、跟踪止损、一键关闭、一键清仓、一键还原等功能,Equity Protect Pro 就是您要找的程序。 它配置简单,当到达预设条件时,可关闭所有图表,同时支持关闭信号订阅(这意味着所有交易程序也将停止运行)。此时,将不再有新订单产生,最后再关闭所有订单,有效防止意外损失,让您在交易过程中高枕无忧。 Equity Protect Pro (Technical Manual) Equity Protect Pro Demo Version for yo u to test Equity Protect Pro MT4 Demo.ex4 Equity Protect Pro MT5 Demo.ex5 Equity Protect Pro 拥有 14 个核心功能,它们都是独立运行的。您可以根据您的交易策略,选择合适的功能组合使用。这些功能默认为关闭状态,
1. Why did I develop this series of indicators
I found that most traders need to use multiple time frame indicators. They usually switch time frame to see indicators. However, once the timeframe is switched, you cannot see the corresponding relationship between the price in the smaller timeframe and the indicator in the larger timeframe . For example: if your price chart is in H1 timeframe, you can see H4, D1 and W1 indicators in H1 timeframe Chart. This is more helpful for you to find th
This product can be used to synchronize multiple Charts, and each Chart can be set to a different sync mode. With this product you can better view and manipulate charts: different time frames for a single Symbol, the same time frame for multiple Symbols... and more. PS: The link below is the FreeDemo product, you can use it on EURUSD/XUAUSD/USDCNH symbol: https://www.mql5.com/en/market/product/38557
Feature: Chart settings can be synchronized, including : background, indentation, size, etc. M
Do you think it's a bit cumbersome when you need to switch symbols or timeframes with mouse click? 1. What is this? This is a program that can switch symbols and timeframes with direction keys. Fast switching, very convenient, no mouse click required. For traders, one symbol with multi-timeframe charts are usually added, you can change symbol on those charts easily. For multi-currency traders, different symbol charts are usually added, you can also change those timeframes easily. I wrote this p
Do you think it's a bit cumbersome when you need to switch symbols or timeframes with mouse click? 1. What is this? This is a program that can switch symbols and timeframes with direction keys. Fast switching, very convenient, no mouse click required. For traders, one symbol with multi-timeframe charts are usually added, you can change symbol on those charts easily . For multi-currency traders, different symbol charts are usually added, you can also change those timeframes easily. I wrote thi
According to trading experience: Some symbols are easy to reverse on certain days, such as Monday, or afternoon, and so on. So comparing the current price with the corresponding historical moment price is valuable. If the price coordinate system uses a logarithmic price, you will get a lot of valuable information. 1. What is this?
This program can convert the symbol price and add it to your Chart. You can compare it with your major chart. The DEMO version Link: https://www.mql5.com/en/market/pr
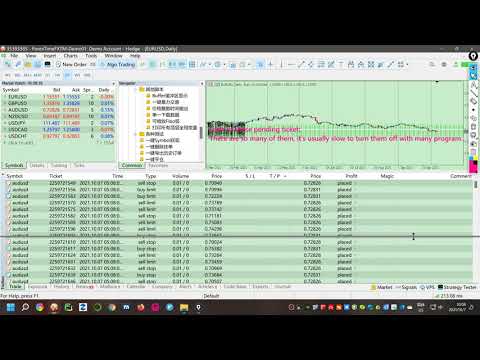
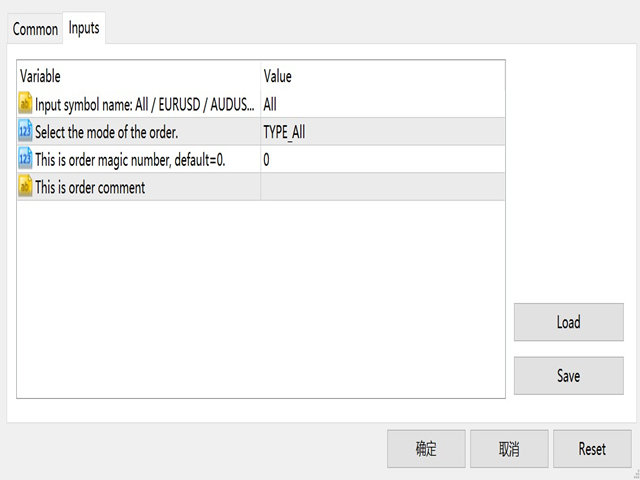
What is this: Violent trading: means sending a large number of orders to your brokerage server, it can conduct a stress test of the trading. In this program you can run a variety of trading tests. Now you can trade at high speed, For example 1000 orders in an instant. The Demo version's link: https://www.mql5.com/en/market/product/38431/ Why to use: Whether manual trading or EA trading, the status of the broker server is very important. So it is beneficial to conduct a trading stress test on
1. Why did I develop this series of indicators
I found that most traders need to use multiple time frame indicators. They usually switch time frame to see indicators. However, once the timeframe is switched, you cannot see the corresponding relationship between the price in the smaller timeframe and the indicator in the larger timeframe . For example: if your price chart is in H1 timeframe, you can see H4, D1 and W1 indicators in H1 timeframe Chart. This is more helpful for you to find th


用户没有留下任何评级信息