Trading Journal pro

Ultimate Trading Journal & Analytics Dashboard

This tool is not just a trade logger; it is a complete  Psychology and Performance Center.

It completely takes over your chart to provide a distraction-free environment focused entirely on your trading statistics, discipline, and daily habits.

Key Features

1.  Total Immersion UI (The "Blackout")

  • Chart Masking: Upon loading, the tool turns the background, grid, and candles pitch black. This hides the noise of the market ticks, allowing you to focus purely on your performance data without emotional distractions.

  • Smooth Rendering: The interface updates instantly without flickering or blinking, providing a premium software feel.

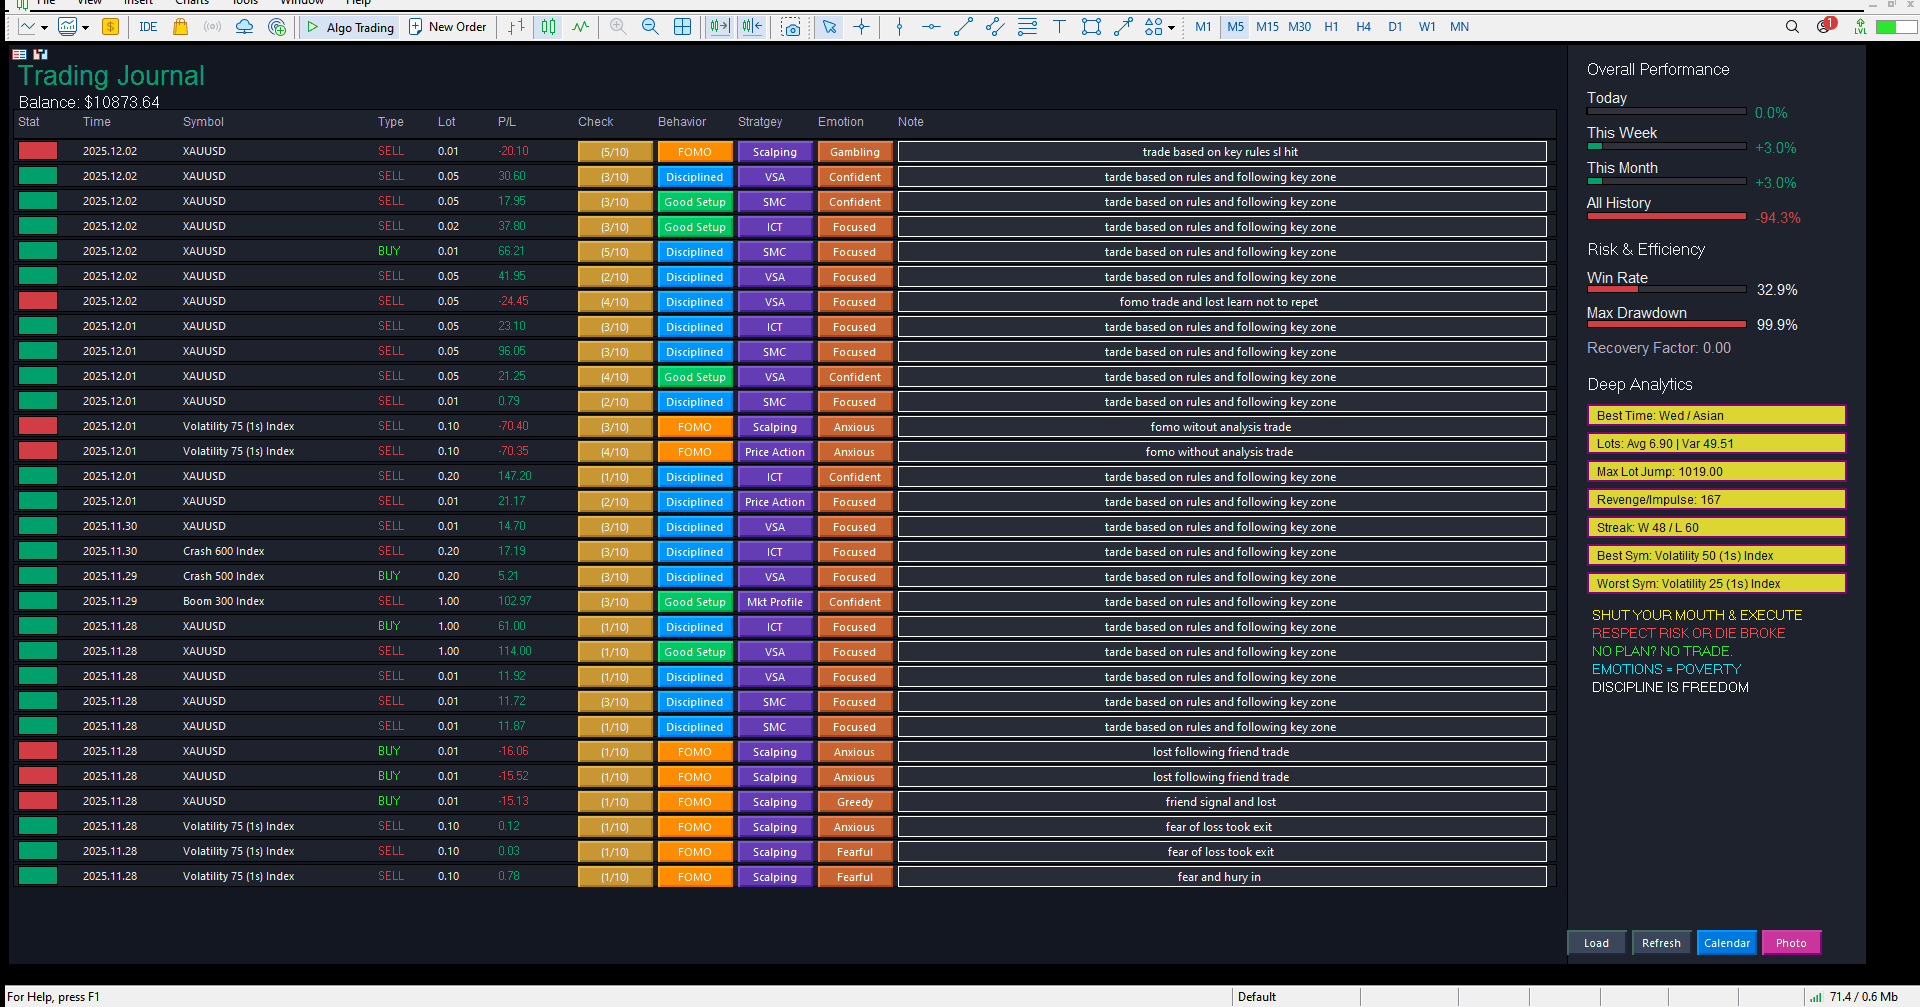
2.  Interactive Trade Journal (List View)

A table view of your trading history with interactive tagging features:

  • Automated Data: Auto-fills Date, Symbol, Type (Buy/Sell), Volume (Lots), and Profit/Loss.

  • Manual Tagging (Click-to-Cycle):

    • Behavior: Tag trades as  Disciplined, FOMO, Revenge, Hesitant, Good Setup.

    • Strategy: Tag trades by system (e.g.,  SMC, ICT, Price Action, Scalping).

    • Emotion: Record your state of mind ( Confident, Anxious, Greedy, Fearful).

  • 10-Point Checklist: Click the check button to open a popup window where you can confirm if you followed your rules (e.g.,  Trend Direction, Risk/Reward, Stop Loss in place).

  • Notes: A text box for every trade to type specific comments.

3.  Performance Calendar (Calendar View)

A visual monthly overview of your performance:

  • Daily Aggregation: Shows Total P/L, Total Lot Size, and Trade Count for each day.

  • Color Coded:

    • Matte Green: Profitable Day.

    • Matte Red: Losing Day.

    • Grey: Break-even or Neutral.

  • Smart Badges:

    • 🔵  Goal Reached: Appears if your daily profit exceeds your target (set in inputs).

    • 🔴  Max Loss Reached: Appears if your loss exceeds your daily limit (set in inputs).

  • Weekend Mode: Saturdays and Sundays display rotating educational tips (e.g.,  "Backtest Strategy",  "Rest & Reset") instead of empty space.

  •  Deep Analytics Sidebar

The right-hand panel provides advanced metrics displayed in a  Ribbon Style (Yellow/Gold background with Purple borders):

  • Best Time/Session: Analyzes if you trade better during Asian, London, or NY sessions.

  • Lot Consistency: Shows your Average Lot size and Variance (how much you deviate from your standard size).

  • Risk Detection (Max Lot Jump): Detects if you suddenly increased your lot size significantly (a sign of gambling/tilting).

  • Revenge/Impulse Monitor: Counts how many times you opened a trade less than 5 minutes after a loss.

  • Streaks: Tracks current winning and losing streaks.

  • Best/Worst Symbols: Identifies which assets make you money and which ones drain it.

5.  Glowing Golden Rules

To keep your psychology in check, the bottom of the sidebar features 5 strict trading rules.

  • Animation: The text slowly pulses/glows from dim to bright neon every few seconds.

  • Purpose: Catches your eye to remind you:  "Respect Risk or Die Broke" or  "Emotions = Poverty".

Configuration (Inputs)

When you attach the tool, you can configure:

  • Colors: Customize the Background, Win/Loss colors, and Ribbon colors.

  • DailyProfitGoal: Set this to your monetary target (e.g., $500). If you hit this in a day, the Calendar shows a blue badge.

  • DailyMaxLoss: Set this to your risk limit (e.g., $200). If you lose this much, the Calendar shows a red badge.

3. Using the List View

  • Reviewing Trades: Scroll through the list.

  • Tagging: Click the grey buttons under the Behavior, Strategy, or Emotion columns. Keep clicking to cycle through options (e.g., change "-" to "FOMO").

  • Checklist: Click the button that says (0/10). A popup appears. Check the boxes that applied to that trade. Click  Save. The button will update to (10/10) and turn green if perfect.

  • Notes: Click inside the text box on the right, type your note, and press Enter (or click away) to save.

4. Using the Calendar View

  • Click the  "Calendar" button at the bottom menu.

  • This gives you a bird's-eye view of the month.

  • Look for the  Red Badges ("Max Loss Reached"). If you see one, click back to "List" view for that date to analyze  why you failed (e.g., did you tag those trades as "Revenge"?).

5. Using the Buttons (Bottom Menu)

  • Load: Loads data from the saved CSV file (useful if you restarted MT5).

  • Refresh: Forces a re-scan of your account history to find new trades immediately.

  • List / Calendar: Toggles between the two main views.

  • Photo: Takes a screenshot of the dashboard and saves it to your MQL5/Files/ folder.

  • CSV (Blue Button in older versions): Exports your journal data to Excel format.


    推荐产品
    Pin Bars MT5
    Yury Emeliyanov
    Main purpose:   "Pin Bars"   is designed to automatically detect pin bars on financial market charts. A pin bar is a candle with a characteristic body and a long tail, which can signal a trend reversal or correction. How it works:   The indicator analyzes each candle on the chart, determining the size of the body, tail and nose of the candle. When a pin bar corresponding to predefined parameters is detected, the indicator marks it on the chart with an up or down arrow, depending on the directi
    FREE
    Server Clock
    Flavio Javier Jarabeck
    5 (5)
    Many friends asked me for a simple, non-obtrusive, resource-friendly clock to track the time during their trades. It seems pretty obvious, but it is a must-have for those trading the market manually, waiting for the Market News, or just to visually know what time it is... Trading is an absorbing endeavor! So, here it is... Totally configurable, including Font Type, Font Size and Chart Location: Upper Left/Center/Right OR Lower Left/Center/Right, with a little twist of adjusting the Offset, just
    FREE
    Donchian Breakout And Rsi
    Mattia Impicciatore
    4.5 (2)
    概述 本指标是经典 Donchian 通道 的增强版,增加了多种实用的交易功能。 除了标准的三条线(最高、最低和中线),系统能够检测 突破 ,并在图表上用箭头进行可视化标记,同时只显示 与当前趋势方向相反的那条线 ,让图表更加简洁。 功能包括: 可视化信号 :突破时在图表上绘制彩色箭头 自动通知 :弹窗、Push 推送和 Email 邮件 RSI 过滤 :根据市场相对强弱验证信号 个性化设置 :颜色、线条粗细、箭头符号、RSI 阈值等 工作原理 Donchian 通道计算: 上轨线 :最近 N 根已收盘 K 线的最高价 下轨线 :最近 N 根已收盘 K 线的最低价 中线 :最高价和最低价的平均值 看涨突破 :收盘价高于上轨线 看跌突破 :收盘价低于下轨线 指标会: 绘制三条 Donchian 通道线 仅在 方向变化后的首次突破 绘制箭头 隐藏顺应趋势方向的那条线(上涨趋势: 只显示红色下轨线;下跌趋势: 只显示绿色上轨线) 可选用 RSI 过滤突破信号,减少虚假突破 支持实时发送通知 参数说明 Donchian 通道设置 indPeriod :计算通道高低点的已收盘 K 线数量 Lin
    FREE
    Trendline mt5 indicator
    David Muriithi
    4 (2)
    Are you tired of drawing trendlines every time you're analyzing charts? Or perhaps you would like more consistency in your technical analysis. Then this is for you. This indicator will draw trend lines automatically when dropped on a chart. How it works Works similar to standard deviation channel found on mt4 and mt5. It has 2 parameters: 1. Starting Bar 2. Number of bars for calculation The   starting bar   is the bar which drawing of the trend lines will begin, while the   number of bars for c
    FREE
    Rainbow MT5
    Jamal El Alama
    4 (1)
    Description : Rainbow MT5 is a technical indicator based on Moving Average with period 34 and very easy to use. When price crosses above MA and MA changes color to green, then this is a signal to buy. When price crosses below MA and MA changes color to red, then this is a signal to sell. The Expert advisor ( Rainbow EA MT5 ) based on Rainbow MT5 indicator is now available here . MT4 version is available here .
    FREE
    MACD Enhanced
    Nikita Berdnikov
    5 (3)
    Introducing the MACD  Enhanced – an advanced MACD (Moving Average Convergence Divergence) indicator that provides traders with extended capabilities for trend and momentum analysis in financial markets. The indicator uses the difference between the fast and slow exponential moving averages to determine momentum, direction, and strength of the trend, creating clear visual signals for potential entry and exit points. Attention! To achieve the best results, it is recommended to adapt the indicator
    FREE
    Hi you, I need your help! Be my Patron, let's make it possible! https://www.patreon.com/joaopeuko https://github.com/Joaopeuko/Mql5-Python-Integration Channel: English version - Versão Inglês: https://www.mql5.com/en/channels/Mql5_Python_Integration_EN Portuguese version - Versão Português: https://www.mql5.com/en/channels/Mql5_Python_Integration_PT Paid version with 38 indicator: https://www.mql5.com/en/market/product/58056 I believe that development in PYTHON is easier and simpler
    FREE
    Candle Countdown Timer - Optimized Edition Overview Candle Countdown Timer is a lightweight, high-performance indicator that displays the exact time remaining until the current candle closes. Designed with efficiency as a top priority, this indicator provides traders with essential timing information without consuming unnecessary system resources. Whether you're a scalper watching every second on M1 charts, a day trader timing entries on H1, or a swing trader monitoring daily candles, this i
    FREE
    Arrows Cleaner
    Flavio Javier Jarabeck
    5 (4)
    For those who use the Trading Arrows on the chart for later study, but use the Triple Screen approach and got all those arrows everywhere on all additional charts, here it is: Arrows Cleaner! Just drop it on the chart and leave it there. When needed, just with 1-click you get rid of all those annoying arrows... SETTINGS You can position the little Button on any corner of the chart. Additionally you can displace it with the Offset settings. You can enlarge or shrink its size, as well as the text
    FREE
    Tabajara V5
    Flavio Javier Jarabeck
    4.83 (36)
    Metatrader 5 version of the famous Andre Machado's Tabajara indicator. If you don't know Andre Machado's Technical Analysis work you don't need this indicator... For those who need it and for those several friend traders who asked this porting from other platforms, here it is... FEATURES 8-period Moving Average 20-period Moving Average 50-period Moving Average 200-period Moving Average Colored candles according to the inflexion of the 20-period MA SETTINGS You can change the Period of all MA's
    FREE
    Renko Indicator MT5
    Mohammed Kaddour
    A Renko Tick chart based on continuously adjusting percentage. Live Renko bricks formed by tick data Adjustable brick width expert for indicator attached Scalp with a Renko, get weird. The settings can and will break the script if you turn them up too high. Turning off outline mode will not look as nice, but can potentially allow for a larger number of bricks.
    FREE
    Girassol Sunflower MT5 Indicator
    Saullo De Oliveira Pacheco
    3.86 (7)
    This is the famous Sunflower indicator for Metatrader5. This indicator marks possible tops and bottoms on price charts. The indicator identifies tops and bottoms in the asset's price history, keep in mind that the current sunflower of the last candle repaints, as it is not possible to identify a top until the market reverses and it is also not possible to identify a bottom without the market stop falling and start rising. If you are looking for a professional programmer for Metatrader5, please
    FREE
    LT Donchian Channel
    Thiago Duarte
    4.86 (7)
    Donchian Channel is an indicator created by Richard Donchian. It is formed by taking the highest high and the lowest low of the last specified period in candles. The area between high and low is the channel for the chosen period. Its configuration is simple. It is possible to have the average between the upper and lower lines, plus you have alerts when price hits one side. If you have any questions or find any bugs, please contact me. Enjoy!
    FREE
    Candle Countdown — MT5 精确K线倒计时 Candle Countdown 是一个简单且精确的工具,可在图表上显示 当前K线剩余时间 。 当交易入场依赖K线收盘时,即使几秒钟也非常关键。 该指标帮助您看到准确时间,从而在无需猜测或仓促决策的情况下进行交易。 用于精确控制K线收盘时间的工具。 指标显示内容: 当前K线剩余时间 服务器当前时间 点差(Spread) 止损最小距离(Stop Level) 该计时器独立于行情跳动(tick),通过平台内部定时器更新,即使在市场波动较低时也能保持稳定显示。 在低波动环境下依然可以获得平滑且稳定的倒计时效果。 所有信息显示在带背景的区域中,在任何图表配色下都清晰可见,并且不会影响图表分析。 随着K线接近收盘,计时器颜色会发生变化,帮助您快速判断当前状态。 提供 MT4 版本: Candle Countdown MT4 实际应用 使用该计时器可以提高入场时机和交易控制: 等待信号K线收盘 在新K线开始时同步入场 避免过早决策 指标可自然融入图表界面,不影响分析 : 不影响图表对象 切换周期时保持稳定 不会增加终端负担 计划更
    FREE
    Value Chart Candlesticks
    Flavio Javier Jarabeck
    4.57 (14)
    The idea of a Value Chart indicator was presented in the very good book I read back in 2020 , " Dynamic Trading Indicators: Winning with Value Charts and Price Action Profile ", from the authors Mark Helweg and David Stendahl. The idea is simple and the result is pure genius: Present candlestick Price analysis in a detrended way! HOW TO READ THIS INDICATOR Look for Overbought and Oversold levels. Of course, you will need to test the settings a lot to find the "correct" one for your approach. It
    FREE
    Free automatic Fibonacci is an indicator that automatically plots a Fibonacci retracement based on the number of bars you select on the BarsToScan setting in the indicator. The Fibonacci is automatically updated in real time as new highest and lowest values appears amongst the selected bars. You can select which level values to be displayed in the indicator settings. You can also select the color of the levels thus enabling the trader to be able to attach the indicator several times with differe
    FREE
    This indicator show the candle remaining time on the chart and/or in the corner of the window. It also display notificaton (popup and push) when a new candle is formed (optional). You configure the timer on candles and at chart corner. I don't need to explain the functions because are very simple. MT4 version:  https://www.mql5.com/en/market/product/38677 Any doubt or suggestion please contact us. Enjoy! This is a free indicator, but it took hours to develop. If you want to pay me a coffee, I a
    FREE
    Phoenix Delta Volume
    Nigel Nii Darku Narnor Darko
    This is the Phoenix Institutional SMC Dashboard (Emerald-Teal Edition). It is engineered to provide retail traders with the same "Volume-at-Price" clarity used by institutional desks. Below is a full breakdown of the benefits, the high-confluence logic for entries, and how to manage your trades using the current visual engine. Strategic Benefits to the User Sentiment over Price: Most indicators only look at where the price is. This dashboard tells you how much effort (Volume Delta) was required
    FREE
    SIMPLE AND QUICK CHART CLEANUP SCRIPT - FREE FOR ALL - EASY TO DRAG AND DROP ONTO THE CHART - A MUST HAVE IN MY EYES Everybody loves to draw on a chart! But cleaning is nobodies favor. Most of the time it will be faster to dump all and redraw the important part. Repetition makes you good! ALWAYS think about that! KEEP IT GROWING, ;-) I wish you a good day, Traders! If you need something, send me a message. Best wishes to you from Vienna!
    FREE
    Prior Cote
    Ricardo Rodrigues Lucca
    In this indicator you choice a data to be used from yesterday (high, low, open, close, etc) to automatically draw an line to be the zero. And, from that a percentage deviation ("Percentage to be used") is calculated and used to draw others line to both side until a limit be reached. Both sides can have diferrent colours as show in screenshots. Also, more than one indicator can be used at same time.
    FREE
    Symbol Watermark
    Flavio Javier Jarabeck
    4.57 (14)
    Another request from my brotherhood was putting the name of the Symbol being seen - a little bigger - on the Chart, just to get sure that they are seeing the correct one... Mistakes pay a high price on the market... It is a very effective, and almost resource-null-consuming indicator that displays the current Symbol Name and Timeframe in almost any position of your Chart, with any color, and any Font Size... And also you can change the divisor character that is presented between the Symbol Name
    FREE
    Big Player Candles
    Flavio Javier Jarabeck
    4.91 (23)
    If you heard about The Wyckoff Method, Volume Spread Analysis, etc... You are probably searching for the candlestick indicator that shows you the Volume spread all over the current bar, signaling every types of market status... You can control the several Market Levels with custom colors... It is up to you to decide how to use it. Our job is provide you with the indicator... If you like this indicator, all I am asking is a little Review (not a Comment, but a REVIEW! )...    This will mean A LO
    FREE
    Smart Super Trend
    Kokou Sodjine Aziagbedo
    Smart Super Trend Indicator (Free) Turn volatility into opportunity — Catch trends early and trade smarter The Supertrend Indicator is one of the most trusted tools in technical analysis, designed to help traders quickly identify the prevailing market trend and spot potential entry and exit points with precision. Built on price action and volatility, this trend-following indicator adapts dynamically to market conditions, making it a powerful companion for both beginners and experienced traders.
    FREE
    MSX Hybrid Heiken Scalper
    Som Prakash Gehlot
    5 (1)
    MSX Hybrid Heiken Scalper Elevate Your Scalping Precision with a Next-Generation Non-Repaint Heiken Ashi Indicator The MSX Hybrid Heiken Scalper is a scientifically designed, non-repainting Heiken Ashi indicator optimized for M5 to H1 scalping on MetaTrader 5. It introduces a robust closed-bar smoothing method that preserves trend clarity while filtering minor price noise — all without using traditional EMA/WMA/HMA smoothing that causes repainting. Reliable Closed Candle Logic Each candle’s
    FREE
    Friend of the trend
    Anderson De Assis
    Friend of the Trend: Your Trend Tracker Master the market with Friend of the Trend , the indicator that simplifies trend analysis and helps you identify the best moments to buy, sell, or wait. With an intuitive and visually striking design, Friend of the Trend analyzes price movements and delivers signals through a colorful histogram: Green Bars : Signal an uptrend, indicating buying opportunities. Red Bars : Alert to a downtrend, suggesting potential selling points. Orange Bars : Represent cons
    FREE
    Daily Support and Resistance Levels 是一款专业指标,基于经典枢轴点方法自动计算并显示日内交易关键价格水平。 主要功能: 自动计算枢轴点(PP) 三个阻力位(R1, R2, R3) 三个支撑位(S1, S2, S3) 显示前一天高点/低点 实时信息面板 市场趋势方向(多头/空头)提示 显示与最近价格水平的距离 完全自定义颜色与样式 每日自动更新 支持所有周期 计算方法:基于昨日最高价、最低价、收盘价的经典枢轴点算法。 交易用途: 支撑/阻力反弹交易 突破策略 区间震荡交易 市场方向判断 盈利目标设置 使用方法: 将指标加载到图表 自动生成水平线 价格 > PP = 多头倾向 价格 < PP = 空头倾向 S1-S3 = 支撑区域 R1-R3 = 阻力区域 自定义设置: 枢轴点/支撑/阻力颜色 线条宽度与样式 显示/隐藏价格标签 显示/隐藏信息面板 面板位置与字体大小 显示/隐藏前日高低点 优点: 专业界面 无重绘 资源占用低 支持所有经纪商 适合剥头皮与日内交易 免费用于展示我的MQL5能力 如果喜欢,请留下评价。
    FREE
    Candle by Seconds
    Marcelo Akio Iqueuti
    4.44 (45)
    它是专为日内操作而开发的,允许市场操作员创建非常规的烛台图,以逃避OHLC的传统点(开盘,最高价,最低价和收盘价)。 该EA交易在任何时间范围内以秒为单位组装定制蜡烛。您可以生成标准Metatrader 5时段中不可用的图表,例如:生成27秒非常规时间范围的图表,或者,如果要生成7分钟时间范围,只需键入“ 420秒”,输入11分钟“ 660秒”等等。 一些重要的准则 [1] 始终使用M1时间范围插入EA; [2]  CANDLE BY SECONDS将创建一个离线图表,根据M1时间范围的当前柱线开始您的柱线序列; [3] 复制从图表中插入日期起最近5天的历史记录; [4] 如果您想在EA创建第一个图表后打开同一时间段的更多图表,只需在Metatrader 5上单击“创建新图表”按钮,选择“自定义”选项,然后选择“时间图表” 。 您将看到创建的时间范围,因此只需选择一个新窗口即可。 对每个新副本重复此步骤。     设定 [ Candle Custom ]  Seconds =  以秒为单位设置任意数字以形成条形图的时间范围 [ Candle Custom ]  
    FREE
    FREE
    Position Selective Close MT5
    Francisco Manuel Vicente Berardo
    The Position Selective Close is a multi-symbol multi-timeframe script used to close simultaneously various positions.  General Description   The Position Selective Close   possesses   three operation modes (Intersection,   Union   and All) that control the way   as   four position features (symbol, magic number,   type   and profit) are used. The modes, available through the Selection Mode input parameter, relate to the features, available through the “Select by Feature” and “Feature” input pa
    FREE
    Weis Waves
    Flavio Javier Jarabeck
    2.83 (18)
    The original author is David Weis, an expert in the Wyckoff Method. The Weis Wave is a modern adaptation of the 1930's Wyckoff Method, another expert in Tape Reading techniques and Chart Analysis. Weis Waves takes market volume and stacks it into waves according to price conditions giving the trader valuable insights about the market conditions. If you want to learn more about this subject you can find tons of videos in YouTube. Just look for "The Wickoff Method", "Weis Wave" and "Volume Spread
    FREE
    该产品的买家也购买
    Trade Assistant MT5
    Evgeniy Kravchenko
    4.42 (211)
    它有助于计算每笔交易的风险,容易安装新的订单,具有部分关闭功能的订单管理, 7 种类型的追踪止损和其他有用的功能。   附加材料和说明 安装说明   -   应用程序说明   -   模拟账户应用程序的试用版 线条功能  - 在图表上显示开仓线、止损线、止盈线。 有了这个功能,就可以很容易地设置一个新的订单,并在开仓前看到它的附加特性。   风险管理  - 风险计算功能在考虑到设定的风险和止损单的大小的情况下,计算新订单的成交量。它允许你设置任何大小的止损,同时观察设定的风险。 批量计算按钮 - 启用 / 禁用风险计算。 在 " 风险 " 一栏中设置必要的风险值,从 0 到 100 的百分比或存款的货币。 在 " 设置 " 选项卡上选择风险计算的变量: $ 货币, % 余额, % 资产, % 自由保证金, % 自定义, %AB 前一天, %AB 前一周, %AB 前一个月。   R/TP 和 R/SL - 设置止盈和止损的关系。 这允许你设置相对于损失的利润大小。 例如, 1 : 1 - 这决定了 TP = SL 的大小。 2 : 1 - 这意味着 TP 是 SL 的两倍。 RR -
    欢迎来到 Trade Manager EA——这是一个终极风险管理工具,旨在使交易变得更直观、精准和高效。它不仅仅是一个下单工具,而是一个用于无缝交易计划、仓位管理和风险控制的全面解决方案。不论您是新手交易员、资深交易员,还是需要快速执行的剥头皮交易员,Trade Manager EA 都可以满足您的需求,适用于外汇、指数、大宗商品、加密货币等各种市场。 借助 Trade Manager EA,复杂的计算已成过去。只需分析市场,在图表上用水平线标记入场、止损和止盈,设置您的风险水平,Trade Manager 就会立即计算出理想的头寸规模,并实时显示以点、账户货币计价的止损和止盈。每笔交易都得以轻松管理。 主要功能: 头寸规模计算器 :根据定义的风险瞬间确定交易规模。 简单的交易计划 :在图表上用可拖动的水平线直接计划交易,设置入场、止损和止盈。 实时显示 SL 和 TP :以账户货币、点或分显示止损和止盈,便于分析。 高级保护工具 盈亏平衡选项 : 基本盈亏平衡 :当您的交易达到设定水平时自动保护利润。 多级盈亏平衡 :设置多达 4 个级别以逐步保护利润。 尾随止损选项 : 基本尾随
    Quant AI Agents is NOT AN Expert Advisor. Quant AI Agents   is a   multi-agent AI trading framework   that turns natural-language strategy prompts into live.  WANT THE SAME RESULTS AS MY LIVE SIGNAL?   Use the exact same brokers I do:   IC MARKETS , IC TRADING   .  Unlike the centralized stock market, Forex has no single, unified price feed.  Every broker sources liquidity from different providers, creating unique data streams. Other brokers can only achieve trading performance equivalent to 60
    Local Trade Copier EA MT5
    Juvenille Emperor Limited
    4.96 (138)
    通过 Local Trade Copier EA MT5 获得非常快速的交易复制体验。它的简单1分钟设置,使您可以在同一台Windows计算机或Windows VPS上在多个MetaTrader终端之间复制交易,具有闪电般快速的复制速度,低于0.5秒。 无论您是初学者还是专业交易者, Local Trade Copier EA MT5 都提供了广泛的选项,可根据您的特定需求进行自定义。对于任何希望增加利润潜力的人来说,这都是终极解决方案。 今天就尝试一下,看看为什么它是市场上最快、最简单的贸易复印机! 提示: 您可以在您的模拟账户中下载并试用 Local Trade Copier EA MT5 模拟版: 这里 将下载的免费演示文件粘贴到您的 MT5 >> 文件 >> 打开数据文件夹 >> MQL5 >> 专家文件夹并重新启动您的终端。  免费演示版本每次可在 4 小时内发挥全部功能,仅限演示帐户。 要重置试用期,请转至 MT5 >> 工具 >> 全局变量 >> Control + A >> 删除。 请仅在非关键模拟账户上执行此操作,不要在挑战道具公司账户中执行此操作。 如果您无法
    TradePanel MT5
    Alfiya Fazylova
    4.87 (155)
    交易面板是一款多功能交易助手。该应用包含超过50种手动交易功能,并允许您自动执行大多数交易任务。 在购买之前,您可以在演示账户上测试演示版本。下载用于演示账户的试用版应用程序: https://www.mql5.com/zh/blogs/post/762579 。 完整说明 这里 。 贸易. 只需单击一下即可执行交易操作: 打開掛單和頭寸,並自動計算風險。 一鍵打開多個訂單和頭寸。 打開訂單網格。 按組別關閉掛單和頭寸。 反轉頭寸方向(關閉買入>打開賣出,關閉賣出>打開買入)。 鎖定頭寸(通過開啟缺少的頭寸,使買入和賣出頭寸的數量相等)。 一鍵部分關閉所有頭寸。 將所有頭寸的止盈和止損設置在同一價格水平。 將所有頭寸的止損設置在盈虧平衡水平。 開倉時,可使用以下功能: 在多個訂單或倉位之間分配計算出的數量(在單擊一次時開啟多個訂單和倉位)。 在開啟訂單前在圖表上可視化交易水平。 僅在當前點差不超過設定值時才開啟倉位。 止盈和止損之間的自動比例。 虛擬止損和止盈。 自動將止損和止盈的大小增加為當前點差的大小。 基於ATR指標讀數計算止盈和止損。 設置掛單的到期日期。 為掛單設置追蹤(掛單
    测试版发布 Telegram to MT5 Signal Trader 即将进入正式的 Alpha 版本。一些功能仍在开发中,您可能会遇到一些小错误。如果您遇到问题,请反馈,您的意见将帮助我们改进软件。 Telegram to MT5 Signal Trader 是一款强大的工具,能够将 Telegram 频道或群组的交易信号自动复制到您的 MetaTrader 5 账户。 支持公开和私人频道,可将多个信号提供者连接至一个或多个 MT5 账户。软件优化、高效、稳定,精准控制每笔复制交易。 界面简洁,仪表盘美观,图表交互性佳,导航直观。您可以管理多个信号账户,自定义每个提供者的设置,并实时监控所有操作。 系统需求 由于 MQL 限制,EA 需要配合 PC 端应用与 Telegram 通信。 安装程序可通过官方 安装指南 获取。 核心功能 多提供者支持: 从多渠道复制信号至多个 MT5 帐户 高级信号识别: 关键词、模式和标签全面自定义 逐提供者控制: 可启用/禁用特定信号类型、平仓策略等 灵活风险管理: 固定手数、固定金额、余额/权益百分比、部分平仓设置 可定制 SL/TP: 覆盖信号
    Farmed Hedge Yield Farming | All Markets (Manual - Hybrid - Semi/Automated EA) MULTI-ASSET SUPPORT Trade any asset available on your broker - Forex: Major, Minor, Exotic pairs - Crypto: BTC, ETH, XRP, SOL, BNB - Stocks: Apple, Tesla, Amazon, Google, etc. - Commodities: Gold, Silver, Oil, Gas - Indices: US30, NAS100, SPX500, DAX40 - Any CFD your broker offers VERIFIED TRADING RESULTS - Farmed Hedge Yield Axi Copy:  https://www.mql5.com/en/signals/2356376 - Farmed Hedge Yield Exn Copy:   https:/
    Premium Trade Manager - MetaTrader 5 的快速、纪律化交易管理工具 Premium Trade Manager 是一款专为 MetaTrader 5 设计的快速图表面板,它接管了每笔交易中所有机械性的工作。您决定方向、品种和时机 - 面板根据您的风险计算仓位大小、下单并附带止损和目标位、分批减仓出场、移动止损,并为您监控经济日历。内置的新闻智能系统更进一步:它根据事件对市场的实际测量影响来评分,而不是固定标签。一个面板,管理您持有的每一笔仓位,每笔交易都遵循同样纪律严明的例程。 购买前先亲手体验。 通过交互式 walkthrough,您可以直接在浏览器中点击实时面板操作 - 这是在购买前感受其运作方式的最快途径。 stein.investments/products/premium-trade-manager Premium Trade Manager 是 Stein Investments 生态系统的一部分 - 20 余款交易工具,以及 Max,您的一对一 AI 交易导师。  全天候在线,深入了解每一款 Stein 指标,随时准备好与您一起梳理每一
    Power Candles 策略扫描器——自优化多符号设置查找器 Power Candles策略扫描器 采用与Power Candles指标相同的自优化引擎,可同时扫描您“市场观察”中的所有交易品种。一个面板即可显示当前哪些品种在统计上具备交易价值、每种策略的最佳应用方向、最优止损/止盈组合,并在新信号触发时立即向您发送提醒。 本工具是 Stein Investments 生态系统的一部分 - 18+ 款工具,加上 Max,您的一对一 AI 交易导师。  随时在线,深入了解每一款指标,在您需要梳理思路的那一刻就在那里。  立即认识他: https://stein.investments 您的全面市场监控。每个交易品种超过3,000次自动优化。2种警报类型。一键切换图表并采取行动。 为何您需要此工具 大多数多标的扫描器仅展示价格 波动 。每只股票的波动率、百分比变化、RSI。您仍需自行摸索正确的策略、合适的止损位以及理想的入场阈值。Power Candles策略扫描器针对每只股票自动解答这些问题,仅在数学验证过的交易设置中触发实际入场信号时才会向您发出提示。这就是全部卖点。 自动
    YuClusters
    Yury Kulikov
    4.93 (43)
    Attention: You can view the program operation in the free version  YuClusters DEMO .  YuClusters is a professional market analysis system. The trader has unique opportunities to analyze the flow of orders, trade volumes, price movements using various charts, profiles, indicators, and graphical objects. YuClusters operates on data based on Time&Sales or ticks information, depending on what is available in the quotes of a financial instrument. YuClusters allows you to build graphs by combining da
    Exp COPYLOT CLIENT for MT5
    Vladislav Andruschenko
    3.91 (33)
    适用于 MetaTrader 5 的专业交易复制器 快速、专业、稳定可靠的 交易复制器 ,适用于 MetaTrader 。 COPYLOT 可在 MT4 和 MT5 终端之间复制 Forex 交易,并支持 Hedge 和 Netting 账户。 COPYLOT 的 MT5 版本支持: - MT5 Hedge → MT5 Hedge - MT5 Hedge → MT5 Netting - MT5 Netting → MT5 Hedge - MT5 Netting → MT5 Netting - MT4 → MT5 Hedge - MT4 → MT5 Netting MT4 版本 完整说明 + DEMO + PDF 如何购买 如何安装 如何获取日志文件 如何测试和优化 Expforex 的所有产品 您也可以将交易复制到 MT4 终端(MT4 → MT4,MT5 → MT4): COPYLOT CLIENT for MT4 COPYLOT 是一款专业的交易和持仓复制器,可同时与 2、3 甚至 10 个终端协同工作。 支持从 模拟账户和投资者账户 复制,也支持同时在多个终端上运行。 您可以使
    Trade Dashboard MT5
    Fatemeh Ameri
    4.94 (125)
    疲于复杂的订单下达和手动计算?Trade Dashboard 是您的解决方案。凭借其用户友好的界面,订单下达变得轻而易举,只需点击一下,您就可以开设交易、设置止损和止盈水平、管理交易手数,并计算风险回报比,让您只需专注于您的策略。告别手动计算,使用 Trade Dashboard 简化您的交易体验。 立即下载演示版本 。 您可以在这里找到仪表盘功能和特性的详细信息 。 加入 Telegram 频道 。 购买后请给我发消息以获取支持。如果您需要添加更多功能,可以在产品的评论区留下您的想法,我愿意听取任何建议,希望您能在使用我的产品时获得最佳体验 。 这是 MT4 版本。 风险管理:使用 Trade Dashboard,可以将您的风险设置为账户余额或权益的百分比,或将风险设置为总金额。在图表上直观地定义您的止损,让工具准确计算每个货币对的适当手数。该工具还可以根据您期望的风险回报比自动设置止盈水平。它甚至可以在手数计算中涵盖佣金和点差费用。此外,您的止损和止盈可以转变为虚拟水平,隐藏于经纪商。通过 Trade Dashboard 的高级风险管理功能,掌控风险,保护您的资本。 交易线
    Trade copier MT5
    Alfiya Fazylova
    4.53 (43)
    Trade Copier 是一种专业实用程序,旨在复制和同步交易账户之间的交易。 复制发生从供应商的帐户/终端到收件人的帐户/终端,安装在同一台计算机或 vps 上。 促销活动 - 如果您已经购买了“Trade copier MT5”,您可以免费获取“Trade copier MT4”(用于 MT4 > MT5 和 MT4 < MT5 的复制)。欲了解更多详细条款,请通过私人消息与我们联系! 在购买之前,您可以在演示帐户上测试演示版本。 演示 这里 。 完整说明 这里 。 主要功能和优点: 支持复制MT5>MT5、MT4>MT5、MT5>MT4,包括МТ5 netting账户。 供应商和收件人模式在同一产品中实现。 简单直观的界面,允许您直接从图表中实时控制复制。 连接中断或终端重新启动时不会丢失设置和位置。 允许您选择要复制的符号,也可以替换接收者的符号,例如 EURUSD> USDJPY。 支持回拷贝。 能够仅复制某些订单。 允许您设置开仓交易价格的最大差异和最大时间延迟。 正确复制部分订单关闭的执行。 计算复制手数的几种方法。 同步止盈和止损。有几种方法可以计算它们的位置。 支持
    AntiOverfit PRO MT5
    Enrique Enguix
    5 (5)
    在购买 EA 之前,先确认它到底是真的扛得住,还是只是刚好在回测里走运。 大多数机器人都是靠一份漂亮的回测卖出去的。 曲线一路向上。 Profit Factor 很好看。 看起来几乎没有疑点。 但即便如此,很多 EA 只要市场不再按照那段历史那样运行,很快就会出问题。 为什么? 因为回测只能证明一件事: 这个策略曾经在某一条特定的价格路径上有效。 它不能证明它在其他路径下也能扛住。 不能证明它足够稳健。 更不能证明它值得你花钱。 因为你买 EA,不是为了欣赏过去那条漂亮的曲线。 你买它,是为了在会变化的市场里使用它。 AntiOverfit PRO 是做什么的 AntiOverfit PRO 帮你判断一个 MetaTrader 5 Expert Advisor 到底是真的够扎实,还是只是恰好适配某一段特定历史。 它的原理其实很容易理解: 它拿真实历史数据,生成许多与原始历史相似、但路径不同的版本,然后让你看到当市场不再完全照着原来的路线走时,这个 EA 会有什么表现。 如果你只是稍微改变一下市场路径,这个机器人就开始失效,那就是个坏信号。 而如果它在许多与原始历史相似的场景里都能稳住
    MT5 to Telegram Signal Provider 是一个易于使用且完全可自定义的工具,它允许向 Telegram 的聊天室、频道或群组发送 指定 的信号,将您的账户变为一个 信号提供商 。 与大多数竞争产品不同,它不使用 DLL 导入。 [ 演示 ] [ 手册 ] [ MT4 版本 ] [ Discord 版本 ] [ Telegram 频道 ]  New: [ Telegram To MT5 ] 设置 提供了逐步的 用户指南 。 不需要了解 Telegram API;开发者提供了您所需的一切。 关键特性 能够自定义发送给订阅者的订单详情 您可以创建分层的订阅模型,例如铜、银、金。其中金订阅获得所有信号等。 通过 id、符号或评论过滤订单 包括执行订单的图表截图 在发送的截图上绘制已关闭的订单,以便额外核实 延迟发送新订单消息的可能性,以便在发送前对位置进行调整 订单详情完全透明: 新的市场订单*带截图 订单修改(止损、获利) 已关闭的订单*带截图 部分关闭的订单** 新的挂单 修改的挂单(进场价格) 挂单激活(作为新的市场订单附加) 已删除的挂单 历史订单报告
    Ultimate Extractor
    Clifton Creath
    5 (9)
    Ultimate Extractor - Professional Trading Analytics for MT5 *****this is the local HTML version of Ultimate Extractor. !!!!!it is not compatible with Cloud!!!! For the online version please reach out to me directly****** Ultimate Extractor transforms your MetaTrader 5 trading history into actionable insights with comprehensive analytics, interactive charts, and real-time performance tracking. What It Does Automatically analyzes your MT5 trading history across all Expert Advisors and generates
    Copy Cat More Trade Copier MT5 (复制猫MT5) 是一个本地跟单软件,也是一个完整的风险管理和执行框架,专为当今的交易挑战而设计。从资金管理公司挑战到个人投资组合管理,它能适应各种情况,结合了稳健的执行、资本保护、灵活配置和高级交易处理功能。 该跟单软件可在主端(发送方)和从端(接收方)模式下工作,实时同步市价单和挂单、交易修改、部分平仓和对冲平仓操作。它兼容模拟和实盘账户、交易或投资者登录,并通过持久的交易记忆系统确保恢复功能,即使EA、终端或VPS重启也不例外。可以同时管理多个主端和从端,使用唯一ID,并通过前缀/后缀调整或自定义品种映射自动处理跨经纪商差异。 手册/设置  | Copy Cat More MT4 | 频道  特色功能: 易于设置——快至30秒(见视频)。 快速、稳定、准确——Turbo模式下低延迟复制(见截图)。 高安全性——不使用潜在危险的DLL或WebRequest。 持久交易记忆,避免孤立、丢失或不准确的交易。 可从手动或EA复制,支持所有账户类型。 品种自动前缀/后缀,快速设置;支持MT4和MT5之间复制。 非常灵活的多主端
    MetaTrader 5 专业交易面板 —— 图表与键盘一键交易的高效控制中心 一款面向主动交易者的专业 Trading Panel,可让您比标准 MetaTrader 操作方式更快、更直观地完成开仓、平仓、修改、管理与控制。 这不是一个普通的小工具,而是一个为高频手动操作、仓位管理、挂单控制与利润管理而设计的完整交易工作台。 通过这套面板,您可以直接在图表上一键执行交易,通过键盘快速触发核心操作,并借助自动参数计算、图形提示、信息标签以及可视化管理功能,大幅减少重复性操作,让整个交易流程更加流畅、高效且专业。 使用我们的交易面板,您可以直接从图表上一键下单,执行交易操作的速度可比标准 MetaTrader 控件快约 30 倍。 MT4 版本 | 完整说明 + DEMO + PDF | 如何购买 | 如何安装 | 如何获取日志文件 | 如何测试与优化 | Expforex 的所有产品 为什么交易者会选择这套面板 图表一键交易 ,并支持键盘快速操作 快速完成开仓、平仓、修改、反转、锁仓与部分平仓 深度控制仓位、挂单、总利润与风控逻辑 自动参数计算,减少手动输入与重复劳动 图表可视化管理
    Custom Alerts AIO:多市场智能监控,一键启动,无需设置 概述 Custom Alerts AIO 是一款“开箱即用”的高级市场扫描工具,无需额外安装任何其他指标或进行复杂设置。它内置了 Stein Investments 的所有核心指标(FX Power、FX Volume、FX Dynamic、FX Levels 和 IX Power),可帮助您轻松监控所有主要资产类别,如外汇、黄金、指数和加密货币。如果您的经纪商支持股票,您也可以手动添加个股进行监控。 1. 为什么选择 Custom Alerts AIO? 无需额外购买任何指标 • 所有关键指标均已内置,开箱即用。 • 专注于实时预警,不包含任何图形元素,性能高效,界面简洁。 全面覆盖所有主要市场 • 支持监控外汇、金属、加密货币和指数市场。 • 无需手动输入任何交易品种,只需在设置中勾选资产类别即可启用。 • 股票并不属于默认类别,如有需要可手动通过参数输入添加。 高效、专业、便捷 • 无需图表模板和手动加载,适合自动化或远程交易环境。 • 非常适合 VPS 上长期运行,或作为后台市场预警工具使用。 2
    Poc Breakout Signal: The Ultimate Institutional Order Flow & Price Action System Elevate your trading with Poc Breakout, a comprehensive technical analysis tool designed to bridge the gap between retail trading and institutional market understanding. This all-in-one system combines powerful Buy/Sell signals, advanced Volume Profile analysis, real-time Order Flow (Depth of Market), and critical macroeconomic data to give you a clear, unambiguous edge in the markets. Poc Breakout Signal decodes c
    Timeless Charts
    Samuel Manoel De Souza
    5 (5)
    Timeless Charts is an all-in-one trading utility for professional traders. It combines custom chart types such as Seconds Charts and Renko with advanced order flow analysis using Footprints , Clusters , Volume Profiles , VWAP studies, and anchored analysis tools for deeper market insight. Trading and position management are handled directly from the chart through an integrated trade management panel , while Market Replay and Virtual Accounts provide environments for practicing trading skills and
    The News Filter MT5
    Leolouiski Gan
    4.77 (22)
    这个产品在新闻时间过滤所有的专家顾问和手动图表,因此您不必担心突然的价格波动会破坏您的手动交易设置或其他专家顾问输入的交易。此产品还带有完整的订单管理系统,可在任何新闻发布前处理您的持仓和挂单。一旦您购买了   The News Filter ,您将不再需要依赖以后的专家顾问内置的新闻过滤器,因为这个产品可以从此过滤它们所有。 新闻选择 新闻来源于Forex Factory的经济日历。 选择可以基于任何一种货币,如USD,EUR,GBP,JPY,AUD,CAD,CHF,NZD和CNY等。 选择也可以基于关键识别,例如Non-Farm (NFP),FOMC,CPI等。 能够选择新闻影响级别的筛选,从低、中、到高影响。 自动模式只选择与图表相关的新闻。 新闻来源每小时自动刷新,以确保最新的新闻数据。 为每个新闻影响级别提供单独的输入,以确定您要过滤掉的新闻发布前后的分钟数。 订单管理选项 在新闻发布前关闭未平仓头寸的选项,并在新闻发布后恢复它们。 在新闻发布前删除挂单的选项,并在新闻发布后恢复它们。 在新闻发布前移除止损和止盈水平的选项,并在新闻发布后恢复它们。 在新闻发布前移动止损和
    HINN MagicEntry Extra
    ALGOFLOW OÜ
    4.71 (14)
    HINN MAGIC ENTRY – the ultimate tool for entry and position management! Place orders by selecting a level directly on the chart! full description   ::  demo-version  :: 60-sec-video-description Key features: - Market, limit, and pending orders - Automatic lot size calculation - Automatic spread and commission accounting - Unlimited partitial take-profits  - Breakeven and trailing stop-loss and take-profit  functions - Invalidation leves - Intuitive, adaptive, and customizable interface - Works
    Seconds Chart MT5
    Boris Sedov
    4.59 (17)
    秒级图表 (Seconds Chart) - 一款专为 MetaTrader 5 设计的独特工具,用于创建秒级时间框架的图表。 通过 秒级图表 ,您可以构建以秒为单位的时间框架图表,获得标准分钟或小时图表无法提供的极致灵活性和分析精度。例如,时间框架 S15 表示每根蜡烛图持续15秒。您可以使用任何支持自定义交易品种的指标和EA交易系统。操作它们就像在标准图表上交易一样方便。 与标准工具不同, 秒级图表 让您能够在超短时间框架下进行高精度交易,无延迟干扰。 秒级图表的优势 支持 1至900秒 的时间框架图表。 基于内置的实时报价数据库, 即时加载 历史数据。 数据实时更新, 无延迟或滞后 。 可同时创建 多个秒级图表 。 秒级图表的理想应用场景 剥头皮交易 和高频交易。 精确的入场和出场时机。 在短时间框架下测试交易策略。 时间框架设置 默认设置包含以下时间框架: S1、S2、S3、S4、S5、S6、S10、S12、S15、S20、S30 。 您可轻松自定义时间框架组合,只需按升序列出 1至900秒 的数值且避免重复即可。 其他免费工具 快速交易管理器 ( Quick Trade Ma
    Uber Trade Manager
    Meelis Hynninen
    4.88 (16)
    UTM Manager 是一款直观且易于使用的工具,可提供快速高效的交易执行。其中一项突出的功能是“忽略价差”模式,该模式使您能够以蜡烛的价格进行交易,完全忽略价差(例如,允许在 LTF 上交易更高价差的货币对,避免因价差而退出交易)。 UTM Manager 的另一个关键方面是其独特的本地交易复印机,允许在每个经纪商中灵活地运行不同的交易策略和设置,例如不同的 TP、BE 和风险规则。 交易执行: 快速高效的交易执行:通过点击图表上的入场价格和止损价格或使用一键固定止损尺寸功能轻松进入交易。 自动手数计算:根据预定义的风险设置计算手数,当通过拖动修改仓位时会重新计算手数。 能够同时处理一个或多个职位。 止盈和盈亏平衡: 灵活的止盈设置:通过特定的风险回报 (RR) 比率设置灵活的部分止盈水平。 可配置的自动盈亏平衡功能:当达到一定的利润水平时,将止损移至盈亏平衡点。 用户友好的界面: 用户友好的图形界面 (GUI),可轻松保存和加载设置。 内置帮助工具提示来解释其他功能。 职位定制: 仓位定制和调整:经理将所有仓位绘制在图表上,通过拖动线条即可轻松定制和调整。 图表上的按钮: 图表
    Footprint Chart Pro — Professional OrderFlow EA for MetaTrader 5 Version 6.34 | Professional tool for real traders | Institutional-Grade Visualization DEMO USERS - PLEASE SELECT EVERY TICK / REAL TICK WHEN TESTING AND YOU HAVE DOWNLOADED HISTORICAL DATA. IF YOU SEE A WAITING SCREEN AND IT IS NOT DOWNLOADING, IT MEANS YOU HAVE LOW HISTORICAL DATA. TRY 1 MIN AND 5 MIN FIRST ON 1 DAY DATA. ONE DAY DATA SHOULD BE THE NEWEST AND MOST CURRENT DATE. PLEASE WAIT UNTIL THE MARKET HAS ROLLED OVER PERIOD.
    AlgoRadar
    Stephen J Martret
    5 (4)
    AlgoRadar is an on-chart analytics dashboard for MT5 that aggregates Expert Advisor performance across multiple accounts, brokers, and platforms, including both MT4 and MT5 data, into a single live view on your MT5 chart. All analysis runs from the chart interface, with no external applications or manual report processing required. EA Analysis and Ranking For traders running multiple Expert Advisors, AlgoRadar provides a consolidated view of each EA's performance across accounts. Active EAs a
    Telegram to MT5 Multi-Channel Copier 自动将您 Telegram 频道中的交易信号直接复制到 MetaTrader 5。无需机器人、无需浏览器扩展、无需手动复制。您在 Telegram 上收到信号,EA 会在几秒钟内在您的终端打开交易。 产品包含两个组件:一个监听 Telegram 频道的 Windows 应用程序,以及在您的 MT5 终端上执行信号的 EA。也提供 MT4 版本。 安装指南和应用程序下载: https://www.mql5.com/en/blogs/post/768988 工作原理 Windows 应用程序使用您自己的 API 凭据连接到 Telegram — 不是机器人。这意味着它可以读取您订阅的任何频道、群组或论坛主题,包括私人和 VIP 频道。当检测到信号时,它会解析并发送给 EA。EA 根据您的经纪商解析品种名称,根据您的风险设置计算手数,并打开交易。 整个过程是自动的。您不需要坐在电脑前。 打开应用程序并登录 Telegram(仅首次需要)。 选择您想要监听的频道或主题。 按 Start。EA 负责其余工作。 支持的信号格
    Anchor Trade Manager
    Kalinskie Gilliam
    5 (2)
    Anchor: The EA Manager Run your full EA portfolio without conflicts, without stacked risk, and without watching every chart yourself. Anchor coordinates up to 64 Expert Advisors on a single account so only one trades at a time. Attach Anchor to any chart. Type your EA names and magic numbers in one line. Anchor handles the rest. Built for portfolios. Built for discipline. Built for prop firms. The Problem Running multiple EAs on the same account creates risk. Two gold EAs can open opposite posit
    Advanced Dashboard Ultra
    Mirel Daniel Gheonu
    5 (2)
    MT5 统计仪表板 & 交易日志 ULTRA (Stats Dashboard & Journal ULTRA) 完整的交易指挥中心:分析、自动化与新闻情报。 Stats Dashboard ULTRA 是 Pro 分析工具的终极进化版。它将 MetaTrader 5 转化为专业的交易工作站,结合了机构级的绩效分析、自动新闻保护和高级心理指标。专为需要全面掌控的手动交易者和 EA 组合经理设计。 ULTRA 版本新功能 新闻情报引擎 (News Intelligence Engine): 不仅是看新闻——而是分析它。仪表板会模拟过去的新闻事件如何影响您的未平仓交易,告诉您是应该持有还是平仓。 EA 机器人卫士 (Bot Guard): 在高影响力新闻期间自动暂停您的其他智能交易系统 (EA),并在市场平静后重新启动它们。 真实权益回撤 (True Equity Drawdown): 基于日内浮动亏损 (MAE) 计算风险,而不仅仅是已结余额,为您提供真实的风险图景。 心理与效率评分: 游戏化的指标,衡量您的纪律性、交易效率 (MFE 捕获率) 和错误成本。 魔术编号 (Magic Nu
    作者的更多信息
    Trend Duration Forecast
    Israr Hussain Shah
    4 (2)
    Trend Duration Forecast It utilizes a Hull Moving Average (HMA) to detect trend direction and statistically forecasts the probable duration of the current move based on historical market behavior. Key Features Smooth Trend Detection:   Uses the Hull Moving Average (HMA) to filter noise while minimizing lag, providing clean Bullish/Bearish signals. Real-Time Duration Counter:   Displays a dynamic label at the start of the current trend showing the   "Real Length"   (number of bars the trend has b
    FREE
    Strong Bull V7 B&C  The ultimate M5 indicator for Boom & Crash indices, providing clear, filtered buy/sell signals to eliminate market noise and enhance your trading precision. Benefit-Focused Master the volatile Boom & Crash markets with Strong Bull V7 B&C . This intelligent indicator provides clear visual arrows and text labels for high-probability setups on the M5 timeframe. Its unique symbol-filtering technology automatically hides conflicting signals (no buys on Crash, no sells on Boom), en
    Binary Rise Fall
    Israr Hussain Shah
    Fractals_Price Indicator Description The Fractals_Price indicator is a technical analysis tool that identifies fractal patterns on price charts. Fractals are recurring patterns that signal potential trend reversals or continuation points. This indicator marks both upward and downward fractals with colored arrows and can display price labels at these points. Key Features  Identifies upward fractals (magenta arrows) marking potential resistance levels Identifies downward fractals (blue arrows)
    Major Swing Fibonacci Indicator - Professional Trading Tool What It Does Automatically detects major swing points not internal noise Generates buy/sell signals at key Fibonacci levels Displays professional GUI panel with real-time analysis Marks major swings with visual indicators Trading Strategy BUY at 38.2%-61.8% Fibonacci support in uptrends SELL  Past performance is not indicative of future results. This indicator is for educational and informational purposes only and does not constitute in
    FREE
    Buy Sell Range
    Israr Hussain Shah
    The Range Filter Buy and Sell indicator is a trend-following technical analysis tool designed to identify optimal entry and exit points in the market. It filters out market noise by creating dynamic bands around price movements, generating clear buy and sell signals when price breaks through these bands. Key Features Dynamic Range Filtering : Uses a sophisticated algorithm to calculate adaptive bands that adjust to market volatility Trend Identification : Clearly visualizes the current trend dir
    FREE
    Spike Box Mitigation
    Israr Hussain Shah
    boom Spike Mitigation Zone Pro A professional spike pattern indicator built for synthetic traders who scalp and swing Boom 500/300/1000/600/900with precision.  This indicator: Detects powerful 3-candle spike formations (Spike → Pullback → Spike) Automatically draws a clean box around the pattern Marks the entry price from the middle candle Extends a horizontal mitigation line to guide perfect sniper entries Automatically deletes & redraws the line once price touches it (mitiga
    FREE
    1. Tool Description The   Dynamic Liquidity HeatMap Profile   is an advanced technical indicator . Unlike a standard Volume Profile which shows where volume   has   occurred, this tool attempts to visualize where liquidity (limit orders and stop losses) is   likely waiting   (resting liquidity). It works by identifying pivots (local highs and lows) weighted by volume and ATR.   Crucially, if price moves through a level, that liquidity is considered "swept" or "taken" and is removed from the map.
    Crash Spike Mitigation Zone Pro A professional spike pattern indicator built for synthetic traders who scalp and swing Crash 500/300/1000 with precision.  This indicator: Detects powerful 3-candle spike formations (Spike → Pullback → Spike) Automatically draws a clean box around the pattern Marks the entry price from the middle candle Extends a horizontal mitigation line to guide perfect sniper entries Automatically deletes & redraws the line once price touches it (mitigation)
    FREE
    Market Profile with Dashboard Indicator - Complete User Guide xau only indicator Overview The Market Profile with Dashboard is a comprehensive trading analysis tool for MetaTrader 4 that displays market profile data, volume analysis, and key market structure information directly on your chart. This indicator helps traders identify significant price levels, market balance areas, and potential trading opportunities based on market profile theory. Core Components and Features Market Profile Dis
    FREE
    Market voleum profile
    Israr Hussain Shah
    Description The Market Profile & Volume Profile Indicator is a powerful technical analysis tool designed to visualize market activity and price distribution over specific timeframes. Unlike standard technical indicators that focus solely on price over time, this indicator organizes price data to show where the market spent the most time (TPO) and where the most volume was traded (Volume Profile). It automatically calculates and displays key structural levels such as the Point of Control (POC) ,
    Super Trend Live
    Israr Hussain Shah
    super trend version is to help you to have real time view of market move it will help you to get a live view of current market  buy signal line and arrow to help you understand batter the direction sell signal line and arrow to help you understand batter the direction trade what you see not what you think this is an simple and best trading tool for our traders of any market crypto gold 
    FREE
    2025 Spike Killer Dashboard - Advanced Trading Signals & Market Analytics Transform Your Trading with Intelligent Market Insights! The 2025 Spike Killer Dashboard is a powerful MQL5 indicator that combines cutting-edge signal generation with an intuitive crystal dashboard for real-time market analysis. Designed for traders who demand precision and clarity, this all-in-one tool delivers actionable signals and comprehensive market metrics at a glance. Key Features: Dual Signal System Shved S
    Trade Manger
    Israr Hussain Shah
    You Give an Instruction: When you run the script, a window pops up with a dropdown menu. You choose exactly what you want it to do from the list (e.g., "Close Profit Only" or "Delete Pending Orders"). It Scans Your Positions: The script then reads your instruction and systematically goes through your open trades and/or pending orders on the current chart. It Applies Your Rule: For each trade it finds, it checks if it matches the rule you selected. If you chose "Close Buy Only," it will only clo
    Spike Blast Pro
    Israr Hussain Shah
    Spike Blaster Pro – The Ultimate Spike Detection Tool Spike Blaster Pro is a next-generation MT5 indicator designed specifically for synthetic markets. It works seamlessly on Boom Index and Weltrade Index , providing traders with sharp, reliable spike detection signals. What makes Spike Blaster Pro powerful is its 5 Core Strategies built into one system, giving traders a multi-layer confirmation before signals appear. This ensures high accuracy and reduces false alerts. 5 Core Strategies B
    Trading Guide MT5 Indicator - Ultimate Trading Psychology Assistant Description The Trading Guide MT5 Indicator is a powerful psychological trading assistant designed to keep traders disciplined, focused, and emotionally balanced. This innovative indicator displays real-time motivational messages, trading rules, and analysis guidelines directly on your chart, with vibrant blinking colors to capture your attention and reinforce proper trading habits.  Key Features Real-Time Trading Psychology
    FREE
    Liquidity Strength pro
    Israr Hussain Shah
    Liquidity Channels Pro  MT5 VERSION HERE   Liquidity Channels  is a sophisticated Smart Money Concepts (SMC) tool designed to automate the identification of     Buy Side Liquidity (BSL)   and     Sell Side Liquidity (SSL) . Unlike standard support and resistance indicators, this tool doesn't just draw lines; it projects     dynamic expanding channels   based on volatility (ATR) from key pivot points. Crucially, it follows the "Mitigation" logic used by institutional traders:     once liquidity i
    How to Use the Features       MT5 VERSION   TRADE COPIER Select Role: On the account sending trades, choose Sender (Master Account) . On the account receiving trades, choose Copier (Receiver Account) . Lot Size Mode: Same Lot Size as Master: Ignores multipliers, copies exactly what the Master has. Multiply Master Lot Size: Uses the "Lot Multiplier" field (e.g., Master 0.10, Multiplier 2.0 = Copier 0.20). Use Fixed Lot Size: Ignores Master's volume entirely, uses the "Fixed Lot Size" field for ev
    Master Volume profile
    Israr Hussain Shah
    Money Flow Profile MT5 HERE   Master Edition is a professional-grade analytical tool designed to visualize market structure through the lens of volume and money flow. Unlike standard volume indicators, this tool displays a Daily Volume Profile directly on your chart, allowing you to see exactly where price discovery occurred and where the "smart money" is positioned. This Master Edition is engineered for clarity and speed, featuring a unique Auto-Theme Sync system that instantly beautifies you
    What is Volume Spread Analysis? Volume spread analysis (VSA) seeks to establish the cause of price movements. The “cause” is quite simply the imbalance between supply and demand in the market, which is created by the activity of professional operators (smart money). Who are these professional operators? In any business where there is money involved and profits to make, there are professionals. The activity of these professional operators, and more important, their true intentions, are clearly
    Trend Scan Friend
    Israr Hussain Shah
    Trend Identification: Look for the color change. When candles turn Green , look for Buy opportunities. When they turn Red , look for Sell opportunities. Entry: Enter on the break of the trend line or on the pullback to the line. Stop Loss: Use the TREND dashed line (Trailing Stop) as your dynamic stop loss. As the trend continues, this line will follow the price, locking in profit. Take Profit: Use the automatically calculated Fibonacci targets (TP1, TP2, TP3) shown on the dashboard and chart l
    Trade Like Pro
    Israr Hussain Shah
    A Smart Price Imbalance Tool with Arrows, Labels, and FVG Zones The Fair Value Gap (FVG) Indicator is designed to automatically detect price imbalance zones on the chart – a widely used concept in Smart Money Concepts (SMC) and Institutional Trading Models (ICT) . These gaps, also known as imbalances or inefficiencies , often highlight areas where price may return to "rebalance" liquidity. Many professional traders consider these levels as high-probability zones for potential reversals, retrace
    Risk Control Tool
    Israr Hussain Shah
    Smart Risk Manager – Risk/Reward Ratio & Position Sizing Tool for MT5 Overview (Short Description) A professional risk management indicator that helps traders calculate lot size, risk percentage, and reward ratio in real time. Perfect for Forex, Indices, Gold, and Synthetic Indices traders who want precise control over their capital. Full Description Trading without proper risk management is like driving without brakes. The Smart Risk Manager for MT5 gives you full control over your position siz
    Bollinger Fibo Pro: The Ultimate Fusion of Volatility, Fibonacci, and Trend Analysis Short Description: Stop overloading your charts with dozens of indicators.   Bollinger Fibo  Pro   is a sophisticated, all-in-one trading system for MetaTrader 5 that merges two legendary concepts into a single, powerful tool. It enhances standard Bollinger Bands with precise Fibonacci extension levels and couples them with a non-repainting ZigZag to accurately identify trends, reversals, and key market structu
    Smart trend pro
    Israr Hussain Shah
    Smart Trend pro New - Advanced Trend Indicator with Interactive GUI Professional trend-following indicator with comprehensive visualization and control panel Key Features: Advanced Trend Detection Reliable Half Trend algorithm for precise trend identification Color-coded trend lines (Blue for bullish, Orange for bearish) Customizable amplitude parameter for different trading styles Interactive GUI Panel Real-time market strength visualization (Bulls vs Bears) Current signal display (Buy/Se
    Analysis Professor
    Israr Hussain Shah
    FiboPivot Dashboard - Professional Pivot Point Indicator What It Does FiboPivot Dashboard is a powerful technical analysis tool that automatically calculates and displays Fibonacci-based pivot points on your chart. It identifies key support and resistance levels based on the previous day's price action, helping traders anticipate potential price reversal points and breakout levels.   How to Use 1. **Install & Apply**: Simply attach the indicator to any chart (time frames below D1) 2. **
    Auto Analysis
    Israr Hussain Shah
    FiboPivot TrendLines - Comprehensive Market Analysis Indicator This powerful indicator combines Fibonacci pivot point analysis with automatic trend line detection, providing traders with a complete technical analysis toolkit in a single tool. Key Features : - Fibonacci Pivot Points: Automatically calculates and displays R1-R3, Pivot, and S1-S3 levels using previous day's data - Fractal-Based Trend Lines: Automatically draws channel trend lines based on fractal patterns - Interactive
    11 Modules Description & Final Analyzer Trading Guide 1. Reaction Engine 2.0 Purpose : Measures market pressure by analyzing tick movements, volume, and speed within a time window.   How it works : Calculates weighted price changes, considers tick velocity and volatility, and applies EMA smoothing.   Trading use : Strong positive values indicate buying pressure Strong negative values indicate selling pressure Use as confirmation for entry/exit signals 2. Flow Pattern Detector Purpose : Identifie
    Big Bull Scalper
    Israr Hussain Shah
    Big bull scalper Short Description Master market structure with the precision of the popular Big bull scalper  This tool automatically identifies key pivot highs and lows, plotting unique "angling" trend lines that dynamically define market context. It visually confirms Breaks of Structure (BOS) and Changes of Character (CHoCH), removing all guesswork from your analysis. Key Features:    Automatic Pivot Detection Instantly spots significant swing highs and lows.    Dynamic Angling Lines Visual
    Color schemes
    Israr Hussain Shah
    Colors schemes powerful MetaTrader 5 script designed for traders who value speed and a personalized trading environment. With a single click, you can instantly transform your chart's appearance using one of several professional, pre-designed color schemes, including popular styles like ICT/SMC. How to Use: In your MetaTrader 5 terminal, open the Navigator window (Ctrl+N). Find the Colors schemes script under the "Scripts" section. Drag and drop the script onto the chart you want to customize. A
    The   Trend Analysis Dashboard   is a powerful, all-in-one technical analysis tool designed for traders who need a clear, consolidated view of market momentum across multiple timeframes. Instead of cluttering your chart with numerous separate indicators, this tool aggregates signals from four key oscillators (Stochastic, RSI, and dual CCI) into a single, easy-to-read panel. It calculates the directional bias (Buy, Sell, or Neutral) for each enabled timeframe and provides a visual summary of over
    筛选:
    无评论
    回复评论