Moonveil Survivors

# Moonveil Survivors · Native 2D Pixel Roguelike Game for MetaTrader 5

> **The ultimate stress reliever for traders during long market watches! Enjoy an authentic retro bullet-heaven roguelike experience directly on your MT5 chart.**

---

### 🌟 Game Overview

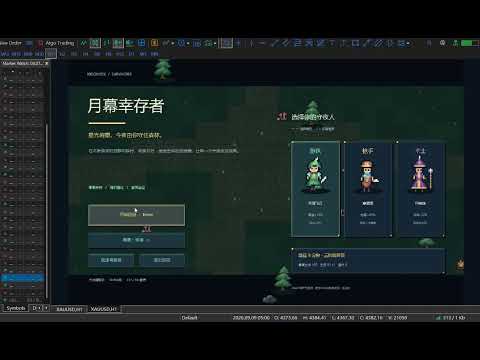
**Moonveil Survivors** is a fully standalone, retro 2D pixel-art survival action game crafted specifically for MetaTrader 5. Step into the boots of a Night Watcher deep in a mystical forest overrun by relentless void hordes. Your weapons auto-target and strike while you focus on tactical maneuvers, dodging bullet hells, collecting experience gems, choosing synergistic runes, triggering game-changing weapon evolutions, and defeating epic multi-phase bosses!

**100% Native MQL5: 0 DLLs, 0 External Assets, 0 Trading Risk!** Built entirely using MT5’s native `<Canvas\Canvas.mqh>` software rasterizer. It requires no network requests, reads no price quotes, connects to no trading servers, and places no orders. Safe, lightweight, and endlessly replayable.

---

### 🔥 Key Features

1. **Pure Chart Rasterization & Pixel Art Aesthetics**
   - High-performance double-buffered software rendering at a crisp **1152 × 720** logical resolution with nearest-neighbor scaling.
   - 100% handcrafted procedural pixel sprites: terrain, ponds, stone paths, heroes, monsters, and visual particles are all internally generated—no external image files required.

2. **Three Unique Playable Night Watchers**
   - **Nightblade Ranger**: Starts with Orbiting Blades. 100 HP, +10% Movement Speed, +8% Critical Chance. Perfect for close-quarters aggressive crowd-harvesting.
   - **Starlight Gunner**: Starts with Piercing Shots. 100 HP, +12% Base Damage, +18px Pickup Radius. Dominates from afar with high-velocity penetrative attacks.
   - **Storm Arcanist**: Starts with Chain Lightning. 85 HP, -12% Cooldown. Excels at crowd control with rapid chained electrocutions and enemy slowdowns.

3. **Five Automated Weapons with 6-Level Progression**
   - **Orbiting Blades**: Spinning blades shielding the hero and shredding nearby foes.
   - **Piercing Shots**: High-speed ballistic bullets using continuous line-segment collision detection.
   - **Starlight Beam**: Piercing cosmic lasers annihilating entire lines of monsters.
   - **Chain Lightning**: Arcing lightning strikes bouncing between nearby targets with crowd deceleration.
   - **Flame Sanctum**: Incinerating ground areas that scorch clusters of enemies with lingering damage.

4. **Five Weapon Evolutions (Synergies)**
   No tedious chest-hunting required! Reach the required weapon levels, and evolutions unlock **instantly and permanently**:
   - ⚡ **Thunder Ring** = Orbiting Blades Lv4 + Chain Lightning Lv2 (Adds an extra spinning blade; hits have a chance to discharge chain lightning).
   - 💥 **Explosive Rounds** = Piercing Shots Lv4 + Flame Sanctum Lv2 (Bullets detonate upon impact and leave burning firefields).
   - 🌟 **Prismatic Ray** = Starlight Beam Lv4 + Piercing Shots Lv2 (Fires beams in three directions simultaneously, wiping the screen).
   - ⛈️ **Heaven's Firestorm** = Chain Lightning Lv4 + Flame Sanctum Lv2 (Every lightning strike generates a lingering fiery storm).
   - ☀️ **Solar Corona** = Flame Sanctum Lv4 + Orbiting Blades Lv2 (Retains ranged firefields and adds a mobile scorched corona orbiting your character).

5. **Deep Roguelike Build Variety**
   - **8 Passive Runes**: Might (Damage +16%), Haste (Cooldown -8%), Area (Range +12%), Wind Boots (Speed & Dash cooldown), Vitality (Max HP +22), Magnet Core (Pickup Radius +24px), Eagle Emblem (Crit Rate +7%, 1.9x Damage), and Regen Dew (HP/sec regen).
   - **World Exploration**: Every run spawns 4 Treasure Chests and 4 Moonveil Altars (restores 30% HP and pulls all gems on the map).
   - **Level-Up Cards**: Common, Rare, and Epic tiers with built-in Reroll opportunities.

6. **Epic Multi-Phase Bosses & Endless Mode**
   - Survive dynamic swarm stampedes and elite champions with golden auras.
   - Battle the **Horned Treant** at 30% and 62% run duration, and face the cataclysmic **Void Monarch** at 100%.
   - Vanquish the final boss to unlock **Endless Mode**, restoring full health and spawning new terror bosses every 90 seconds!

7. **Adaptive Performance Engine**
   - Rock-solid 60 ticks/second physics simulation loop decoupled from display frame rates.
   - Memory-pooled projectiles, particles, and spatial grid hashing to prevent frame drops.
   - **Auto-Quality Fallback**: Intelligently throttles cosmetic visual particles during intense CPU loads while keeping all weapon logic intact.

---

### 🎮 Controls & User Guide

- **Movement**: Arrow Keys `↑` `↓` `←` `→` (Smooth 8-directional normalized movement).
- **Invincible Dash**: `Shift` key. Quick roll in your moving direction. **Grants total invulnerability frames** to slip through swarms and bullet hells!
- **Pause / Resume**: `Ctrl` or `Esc` key, or click the `[Ⅱ]` icon in the top-right corner.
- **In-Game Codex**: Click the `[?]` icon in the top-right corner to open the complete Encyclopedia of Weapon Recipes and mechanics (freezes the battle).
- **Level-Up Selection**:
  - Use `←` / `→` arrow keys and press `Enter` to confirm, or directly click your preferred card with the mouse.
  - Press `Ctrl` to Reroll choices.
- **Main Menu**: Navigate characters and difficulty settings with Arrow Keys, press `Enter` to start.

> **💡 Pro Tip**: Click once on the game chart after launching to ensure keyboard focus; remember to pause before switching charts or applications.

---

### ⚙️ Input Parameters

| Parameter | Default | Range | Description |
| :--- | :---: | :---: | :--- |
| `InpTargetFPS` | 40 | 20 ~ 60 | **Target Frame Rate**. Display render cap (Game logic runs at fixed 60 ticks/s). |
| `InpMaxEnemies` | 280 | 100 ~ 480 | **Active Enemy Hard Cap**. Adjust down to 150~200 on low-spec hardware. |
| `InpEffects` | 2 | 0 ~ 2 | **Visual FX Tier**. 0: Minimal, 1: Balanced, 2: Ultra. |
| `InpAutoEffects` | true | true / false | **Adaptive Particle Scaling**. Automatically scales down cosmetic particles during frame drops. |
| `InpScreenShake` | true | true / false | **Screen Shake FX**. Toggles tactile camera vibrations on heavy hits and boss kills. |
| `InpSound` | false | true / false | **Terminal Audio**. Uses standard MT5 terminal beeps for key events. |
| `InpRunMinutes` | 8 | 5 ~ 20 min | **Expedition Duration**. Final boss Void Monarch spawns at 100% time. |
| `InpDifficulty` | 2 | 1 ~ 3 | **Initial Difficulty**. 1: Casual, 2: Standard, 3: Nightmare. |
| `InpMaxScale` | 1.5 | 0.75 ~ 2.0 | **Canvas Scaling Cap**. Automatically fits chart dimensions up to this multiplier. |
| `InpSeed` | 0 | Integer | **RNG Seed**. 0 for fresh random runs; fixed seed for route practice. |

---

### 🛡️ Security & Zero Risk Commitment

- **Zero DLLs**: Requires no Windows API extensions or DLL import permissions.
- **Zero Market Impact**: Does not read account numbers, balance, equity, or market prices. Never triggers any trades.
- **Clean Chart Restoration**: Upon exiting or removing the script, all original chart settings, background colors, and scrollbars are 100% restored with zero leftover graphical debris.
- **Recommended Chart Size**: Recommended chart workspace of **1152 × 720** or higher. If resized below 864 × 540, the game will safely auto-pause.
Yazarın diğer ürünleri
This product can be used to synchronize multiple Charts, and each Chart can be set to a different sync mode. With this product you can better view and manipulate charts: different time frames for a single Symbol, the same time frame for multiple Symbols... and more. PS: The link below is the FreeDemo product, you can use it on EURUSD/XUAUSD/USDCNH symbol: https://www.mql5.com/en/market/product/38557 Feature: Chart settings  can be synchronized, including : background, indentation, size, etc. M
Do you think it's a bit cumbersome when you need to switch symbols or timeframes with mouse click? 1. What is this? This is a program that can switch symbols and timeframes with direction keys. Fast switching, very convenient, no mouse click required. For traders, one symbol with multi-timeframe charts are usually added,  you can change symbol on those charts easily. For multi-currency traders, different symbol charts are usually added, you can also change those timeframes easily. I wrote this p
1. What is this         Rising volatility and falling volatility are not the same, whether it is academic research or actual testing has shown this point.         The original ATR indicator is calculated by putting up and down fluctuations together. This indicator is to calculate separately the upward volatility and the downward volatility, which can better help you study the market. 2. Indicator description          There are two modes for the calculation of this indicator, as shown in the fo
Have you ever take a long time to watch a Symbol when the network link is not good ? Have you ever wait for a long time when you switch chart between different Symbols or different TimeFrames ? If you do long-term backtesting , Have you ever to be downloaded datas for a long time ? Yes, If there is no data in the system, those will happen.  1. What is this: Download all the Symbol data in Market Watch to the system. PS: This is not outputting data to Files. This Link go to Demo version: https:/
This product can be used to synchronize multiple Charts, and each Chart can be set to a different sync mode. With this product you can better view and manipulate charts: different time frames for a single Symbol, the same time frame for multiple Symbols, system indicators for single/multiple Symbols... and more. Feature: Chart settings can be synchronized, including : background, indentation, size, etc. Multiple Chart window start times  or end times can be synchronized. Multiple Chart time fr
I see that many tools in the market deal with Position and Order in the form of operation panels. Which is loaded into a Chart in the form of an EA. However, once the operator panel EA is loaded, no other EAs can be loaded. So, I wrote the one-click operation of Position and Order as a script, so you can load other EAs and easily complete one-click operation of Trade. 1. What is this: This is a one-click script to close position order. Now you can close position tickets at high speed, for examp
I see that many tools in the market deal with Position and Order in the form of operation panels. Which is loaded into a Chart in the form of an EA. However, once the operator panel EA is loaded, no other EAs can be loaded. So, I wrote the one-click operation of Position and Order as a script, so you can load other EAs and easily complete one-click operation of Trade. 1. What is this: This is a one-click script to delete the pending order . Now you can delete pending tickets at high speed, for
Do you think it's a bit cumbersome when you need to switch symbols or timeframes with mouse click? 1. What is this? This is a program that can switch symbols and timeframes with direction keys. Fast switching, very convenient, no mouse click required. For traders, one symbol with multi-timeframe charts are usually added,  you can change symbol on those charts  easily . For multi-currency traders, different symbol charts are usually added, you can also change those timeframes easily. I wrote thi
According to trading experience: Some symbols are easy to reverse on certain days, such as Monday, or afternoon, and so on. So comparing the current price with the corresponding historical moment price is valuable. If the price coordinate system uses a logarithmic price, you will get a lot of valuable information. 1. What is this? This program can convert the symbol price and add it to your Chart. You can compare it with your major chart. The DEMO version Link: https://www.mql5.com/en/market/pr
What is this: Violent trading: means sending a large number of orders to your brokerage server,  it can conduct a stress test of the trading. In this program you can run a variety of trading tests.  Now you can trade at high speed, For example 1000 orders in an instant. The Demo version's link:  https://www.mql5.com/en/market/product/38431/ Why to use: Whether manual trading or EA trading,  the status of the broker server is very important. So it is beneficial to conduct a trading stress test on
1. Why did I develop this series of indicators I found that most traders need to use multiple time frame indicators. They usually switch time frame to see indicators. However, once the timeframe is switched, you cannot see the  corresponding relationship  between  the price in the smaller timeframe  and  the indicator in the larger timeframe . For example: if your price chart is in H1 timeframe, you can see H4, D1 and W1 indicators in H1 timeframe Chart. This is more helpful for you to find th
Filtrele:
Değerlendirme yok
Değerlendirmeye yanıt





























