Kiwi Crystal Heikin Ashi MT5
- 指标
-
- Nguyen Ngoc Diep
 KiwiBots — Expert Advisors, Indicators & Trading Utilities for MetaTrader 4 and MetaTrader 5.
We develop the KiwiBots collection with a focus on practical automated trading systems, trading tools, market analysis and risk management. - 版本: 1.1
Kiwi Crystal Heikin Ashi MT5
Kiwi Crystal Heikin Ashi MT5 is a trend-visualisation indicator for MetaTrader 5.
It transforms standard price data into smoothed Heikin Ashi candles and uses four colours to classify bullish direction, bearish direction and relative momentum strength.
The indicator can be used on Forex, metals, indices, commodities, cryptocurrencies and other instruments available through MetaTrader 5.
This is an analytical indicator. It does not open, manage or close trades.
Main features
- Native Heikin Ashi calculation
- Four-colour trend and momentum display
- Standard display mode
- Trend Strength mode
- Momentum mode
- Optional candle smoothing
- Configurable noise reduction
- ATR-based candle-strength analysis
- Completed-candle trend information
- On-chart colour guide
- Adjustable panel position
- Indicator buffers for Expert Advisors and other tools
- No external indicator installation required
Important Heikin Ashi information
Heikin Ashi candles use calculated values derived from current and previous price data.
Their displayed open, high, low and close values are synthetic and may differ from the actual market prices shown by standard candles. Therefore, Heikin Ashi prices should not be used alone for exact trade entry, stop-loss or take-profit placement.
Use the broker’s actual Bid and Ask prices when making trading decisions.
Candle colour guide
The indicator uses four default candle colours.
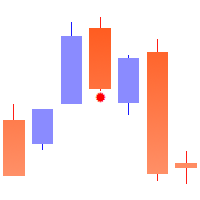
- Blue: strong bullish momentum
- Green: weaker bullish movement or transition
- Orange: strong bearish momentum
- Red: weaker bearish movement or transition
These colours classify market conditions according to the selected mode and indicator settings. They do not guarantee that the current direction will continue.
The default colours can be adjusted through the indicator properties.
How to interpret the colours
A transition from green to blue can indicate strengthening bullish momentum.
A transition from red to orange can indicate strengthening bearish momentum.
Several consecutive blue candles may help identify sustained bullish conditions. Several consecutive orange candles may help identify sustained bearish conditions.
Frequent changes between green and red can indicate weaker momentum, consolidation or uncertain direction.
A colour change is analytical information rather than a direct instruction to buy or sell.
Wait for candle closure
The current candle can change colour while price is moving. This is normal because the candle remains incomplete until its timeframe closes.
For confirmed analysis, use the colour of the last completed candle.
Completed historical candles retain their closed-bar classification under the same data and settings. Changing the indicator inputs, timeframe, symbol or available price history can cause the chart to be recalculated.
Display modes
Standard
Uses basic bullish and bearish Heikin Ashi direction.
This mode provides a simpler display without the full strength classification used by the other modes.
Trend Strength
Classifies strong and weak movement using factors such as:
- Heikin Ashi candle direction
- Candle-body strength
- ATR-based volatility
- Consecutive trend candles
Trend Strength is the recommended default mode.
Momentum
Responds more directly to the size of the Heikin Ashi candle body relative to current volatility.
This mode may react faster to changing momentum but can also produce more frequent classification changes.
ATR-based strength analysis
Average True Range is used to compare candle movement with recent volatility.
A candle considered strong during a quiet market may not qualify as strong during a more volatile period. This allows the strength classification to adapt to the instrument and timeframe.
ATR measures historical volatility. It does not predict future price direction.
Optional smoothing
Candle smoothing can reduce short-term visual noise and create a clearer trend display.
Increasing smoothing may:
- Produce fewer colour changes
- Make longer trends easier to observe
- Delay recognition of a new direction
Reducing smoothing may:
- Respond faster to price movement
- Produce more frequent changes
- Increase sensitivity to market noise
Users should select a balance appropriate for their timeframe and trading method.
On-chart guide
The optional information panel can display:
- Direction of the last completed candle
- Current confirmed momentum classification
- Meaning of each candle colour
- Reminder to wait for candle closure
The panel can be:
- Enabled or disabled
- Repositioned on the chart
- Adjusted using the available display settings
The panel is informational and does not execute trades.
Basic workflow
- Attach Kiwi Crystal Heikin Ashi MT5 to a chart.
- Begin with Trend Strength mode.
- Wait for the current candle to close.
- Read the colour of the last completed candle.
- Observe whether momentum is strengthening, weakening or mixed.
- Compare the signal with market structure, support and resistance or a higher timeframe.
- Use actual market prices when planning an entry, stop loss and target.
- Apply independent position sizing and risk management.
Possible confirmation methods
The indicator can be combined with:
- Market structure
- Support and resistance
- Previous highs and lows
- Higher-timeframe direction
- Volatility analysis
- Independent entry and exit rules
Adding confirmation can reduce some signals but cannot guarantee profitable results.
Developer buffers
The indicator provides data buffers that can be accessed by compatible Expert Advisors, indicators and analytical tools.
- Buffer 0: Heikin Ashi Open
- Buffer 1: Heikin Ashi High
- Buffer 2: Heikin Ashi Low
- Buffer 3: Heikin Ashi Close
- Buffer 4: Candle colour index
- Buffer 5: Trend state
- Buffer 6: Reversal state
Trend-state values
- +2: Strong bullish
- +1: Weak bullish
- -1: Weak bearish
- -2: Strong bearish
Reversal-state values
- +1: Bullish reversal
- -1: Bearish reversal
- 0: No new reversal
Developers should read completed bars when using confirmed signals. Buffer index 0 normally represents the current unfinished candle and may change until the candle closes.
Buffer values and numbering should be checked after any future product update before they are used in another automated system.
Installation
- Install Kiwi Crystal Heikin Ashi MT5 through the MetaTrader 5 Market.
- Open the required symbol and timeframe.
- Attach the indicator to the chart.
- Select Standard, Trend Strength or Momentum mode.
- Adjust smoothing and display settings if required.
- Wait for sufficient historical data to load.
- Use the last completed candle for confirmed colour analysis.
No separate Heikin Ashi indicator is required.
Supported markets
The indicator can be applied to symbols offered through MetaTrader 5, including:
- Forex
- Gold and other metals
- Indices
- Commodities
- Cryptocurrencies
Behaviour varies according to the instrument, timeframe, volatility and broker price feed.
Important information
Kiwi Crystal Heikin Ashi MT5 is a visual trend-analysis tool, not an Expert Advisor.
It does not:
- Open or close trades
- Modify positions
- Calculate trading volume
- Place stop-loss or take-profit orders
- Guarantee a reversal or trend continuation
- Display directly tradable Heikin Ashi prices
No indicator can predict every market movement. Historical chart behaviour does not guarantee future results. Traders should use independent confirmation and appropriate risk management.