Trident Pressure

Trident Pressure

Three pressure layers. One exhaustion state machine. A signal you can wait for.

An oscillator that reaches an extreme tells you nothing about timing. Markets stay extreme for days. Trident Pressure is built around the opposite idea: the tradeable moment is not when pressure peaks, it is when pressure releases.

Three layers, read separately

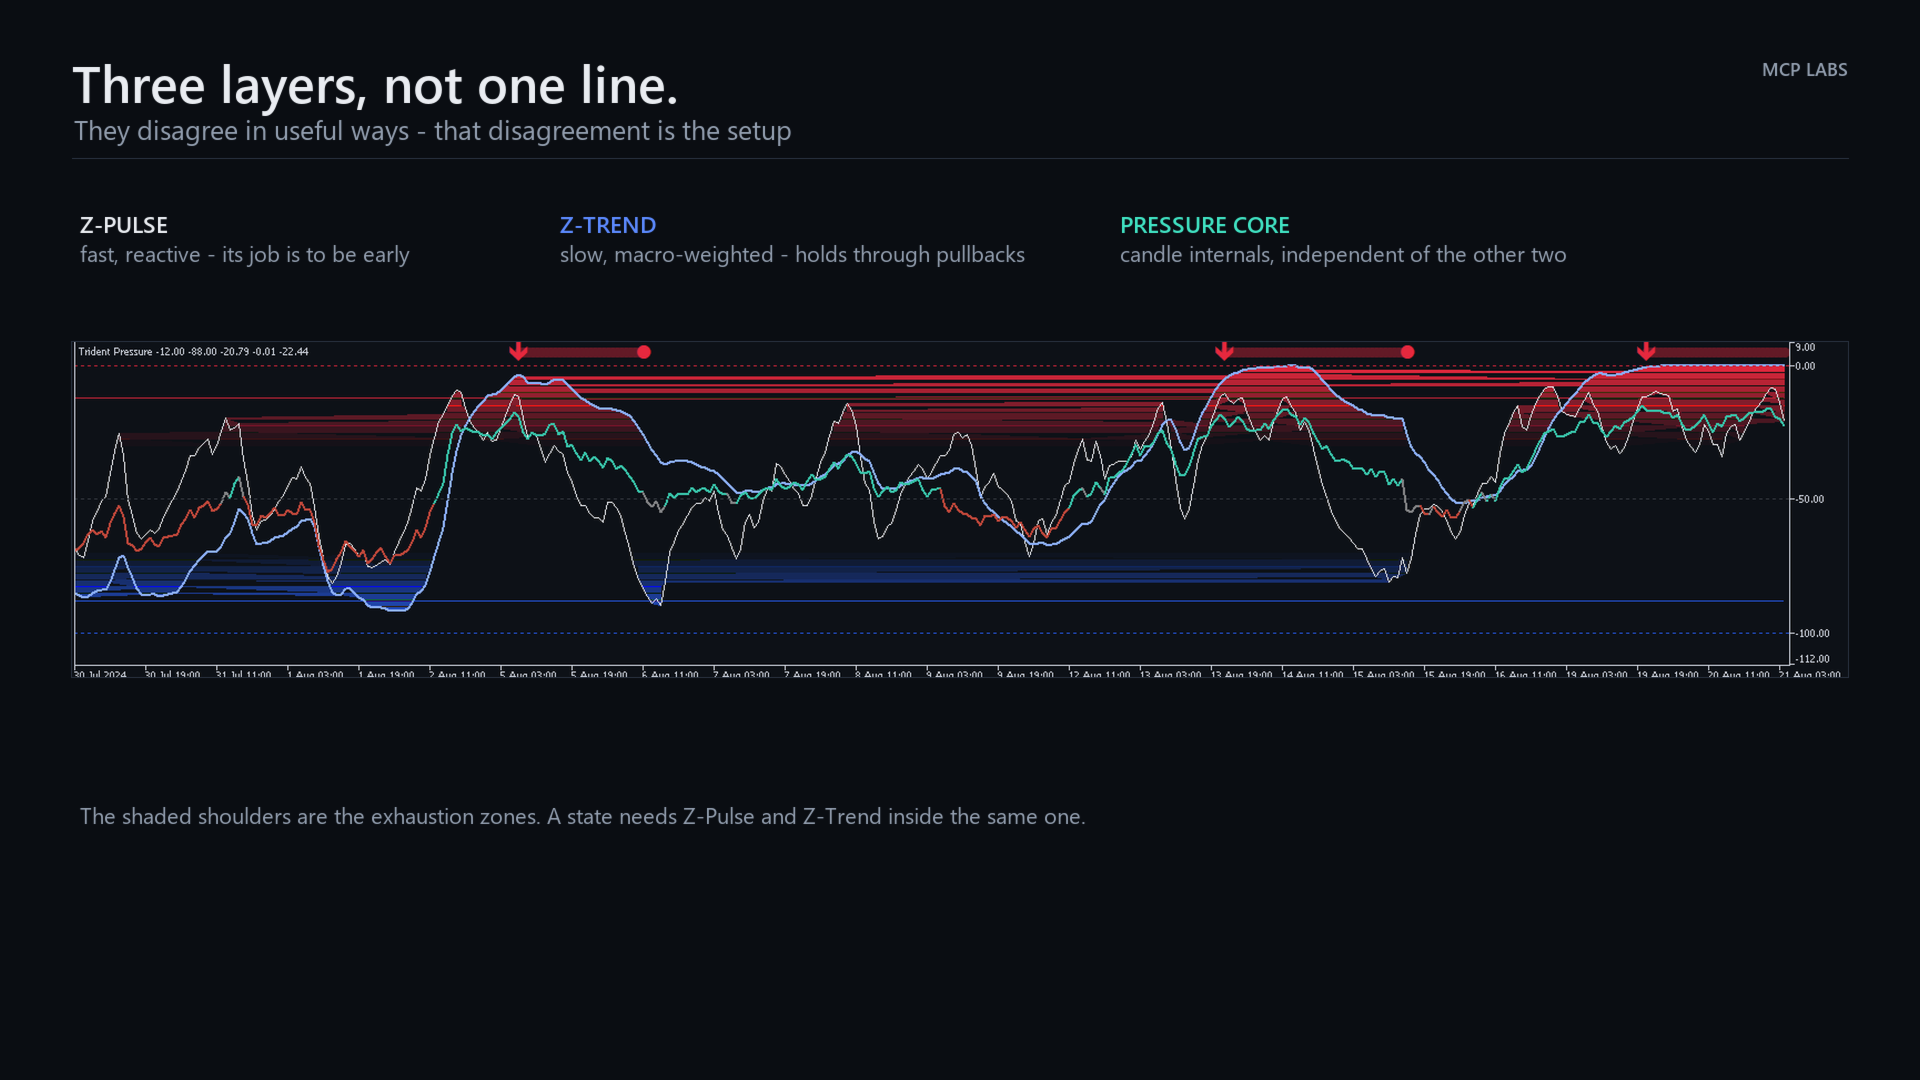
  • Z-Pulse — fast, reactive range position. Moves with the current swing. Its job is to be early.
  • Z-Trend — a macro-weighted blend of three range horizons. Slow on purpose. It resists counter-trend noise in proportion to how efficiently price is travelling and how closely the horizons agree, so it holds direction through pullbacks that throw Z-Pulse around.
  • Pressure Core — an independent read on candle internals: where price closed in its range, where it spent its time, which way the body points, which wick dominates, and the recent impulse. Coloured bull, bear or neutral.

The exhaustion state machine

A pressure state opens only when Z-Pulse and Z-Trend are both inside the same extreme zone, and stay there for a confirmation period. It closes only when both have travelled back past a separate release level that sits further out than the entry level.

Entry and release thresholds are deliberately different. That gap is hysteresis, and it is why the state does not flicker on and off while price chops around a line.

What you see

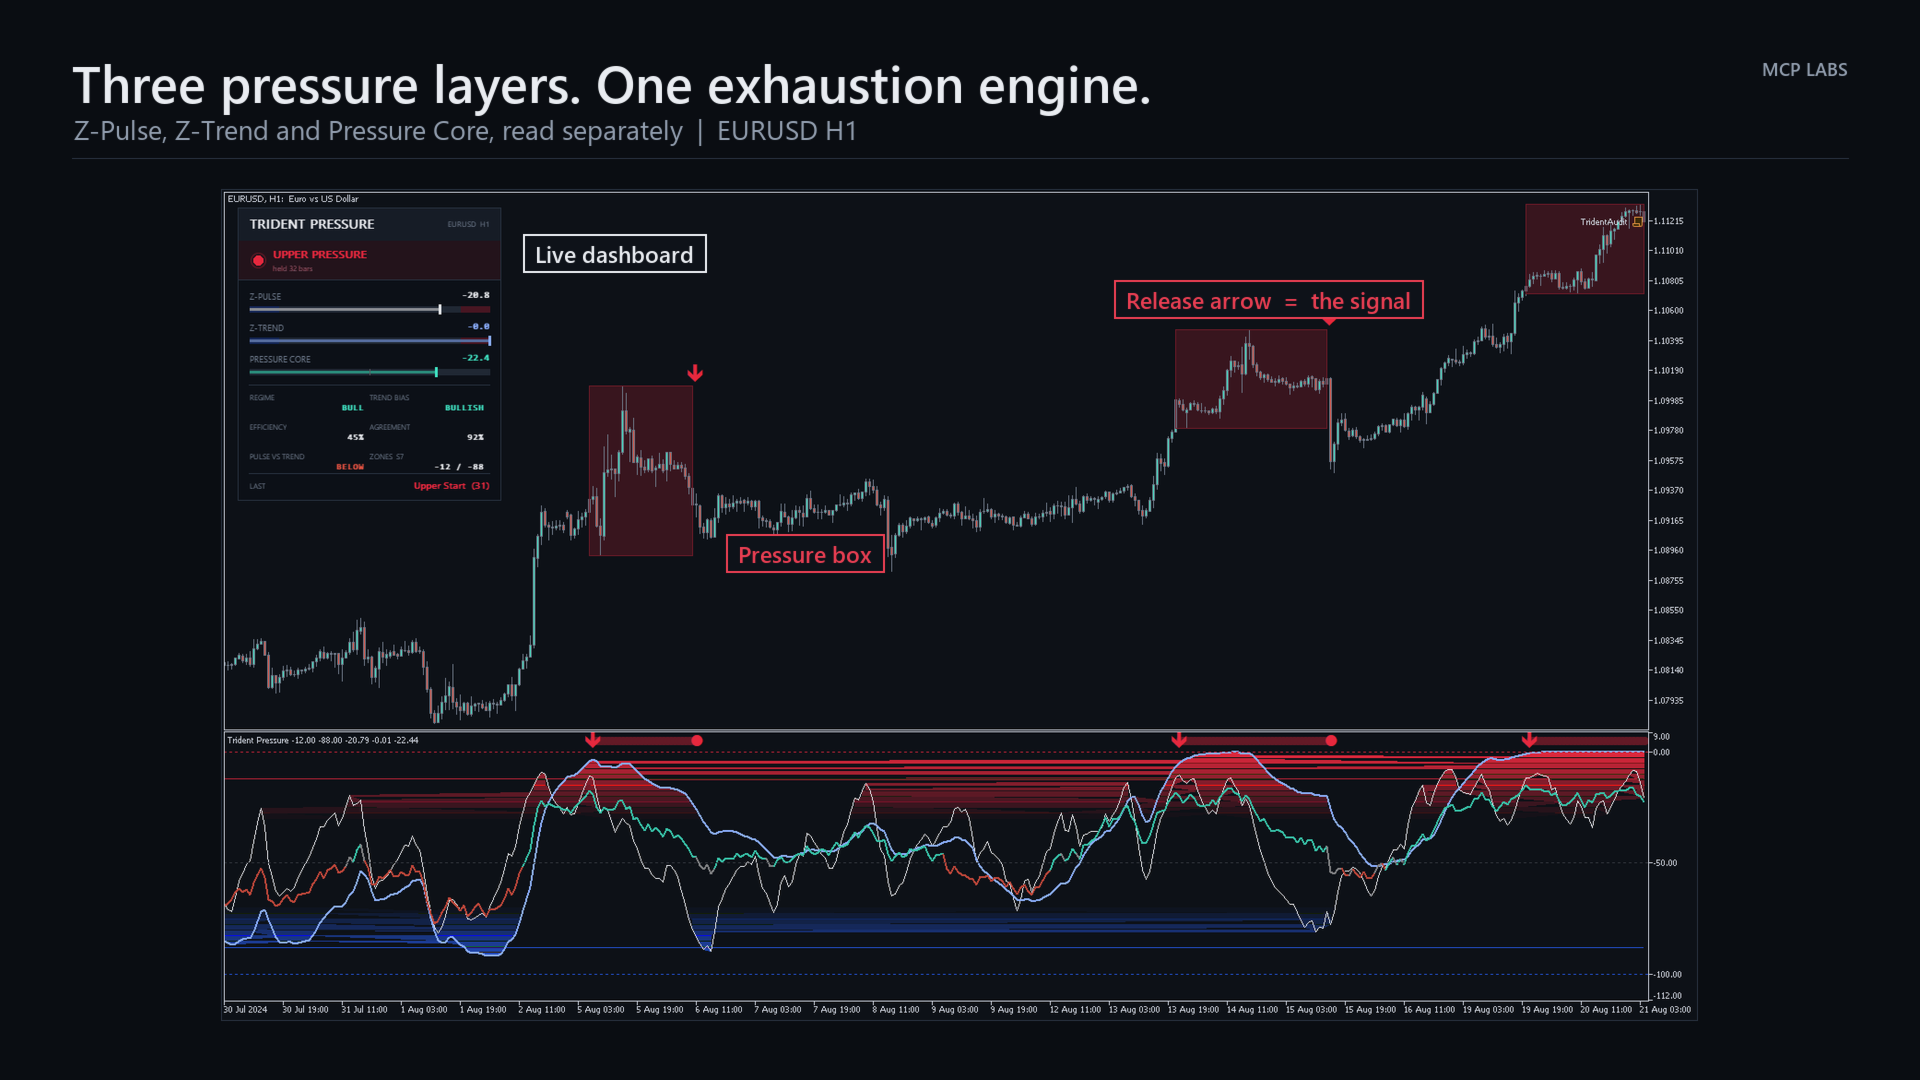
  • A box on your chart marking the price range carved out while pressure was on
  • An arrow at the moment of release — this is the signal
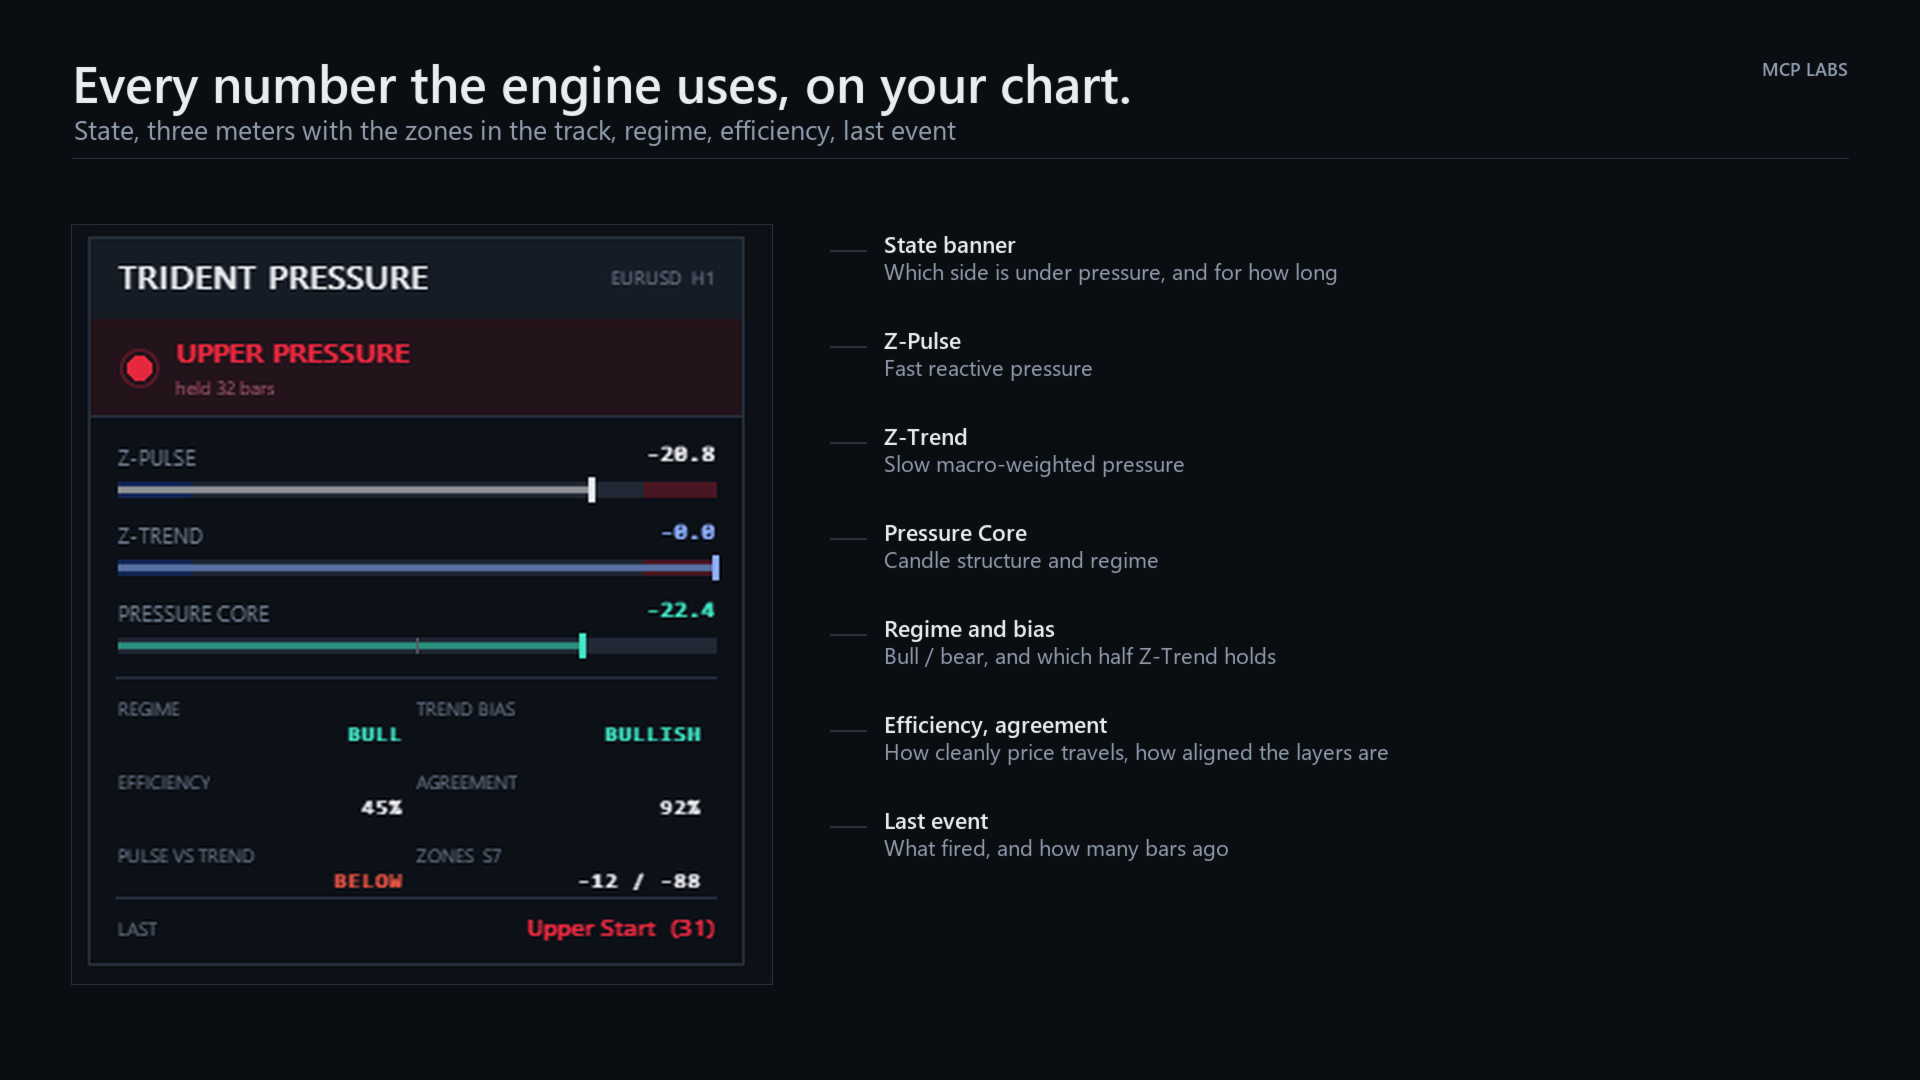
  • A live dashboard: state, three meters with the zones drawn into the track, regime, trend bias, efficiency, layer agreement, and the last event
  • A gradient-shaded oscillator pane showing all three layers at once

How to trade it

  • Trend — Z-Trend holding the upper half with a bull-coloured Core favours longs. The mirror favours shorts.
  • Continuation — in an established trend, Z-Pulse pulls back against it while Z-Trend and Core hold their direction, then turns back. The pullback is the entry, not the reversal.
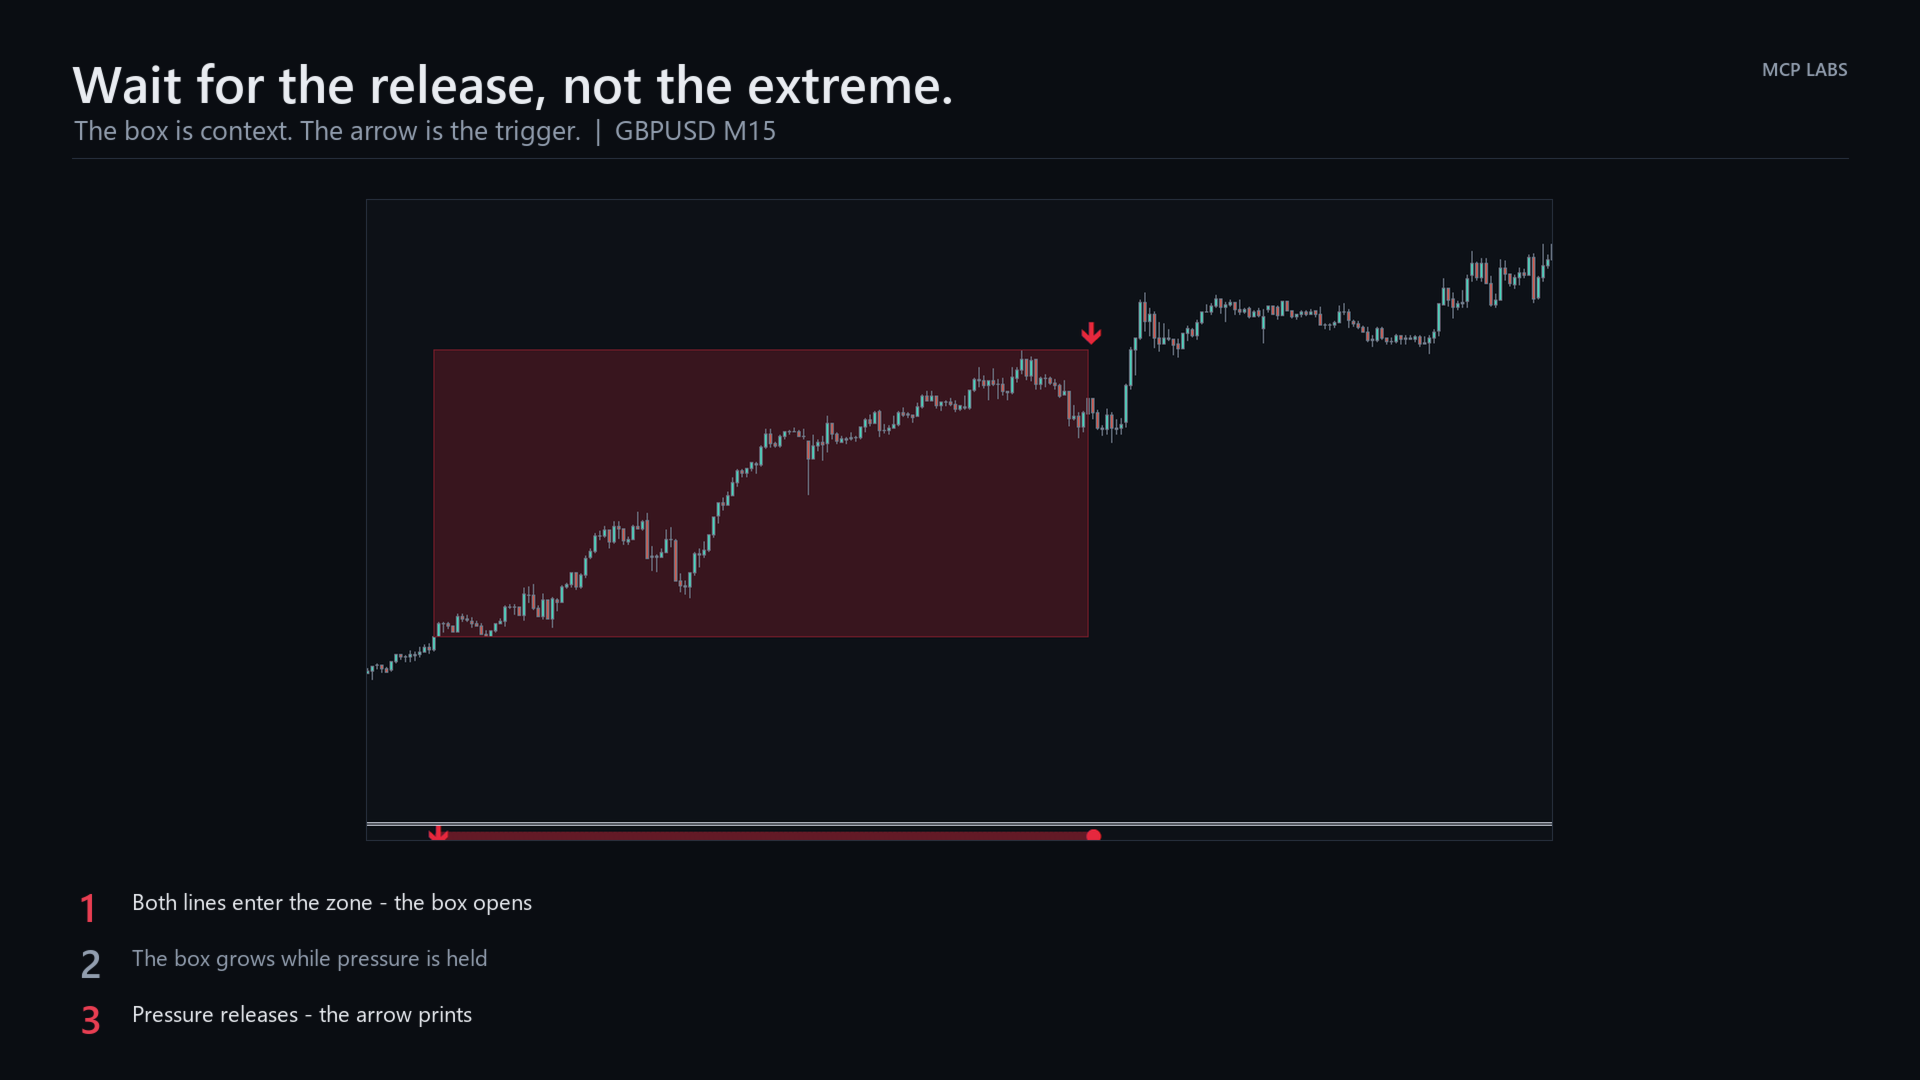
  • Reversal — a box forms and grows while pressure is on. Do not trade the box; while it is open, pressure is still being applied. Wait for the arrow.

The single most common way to misuse this tool is to sell a red box while it is still growing. A red box is not a sell signal. The red arrow is.

Settings

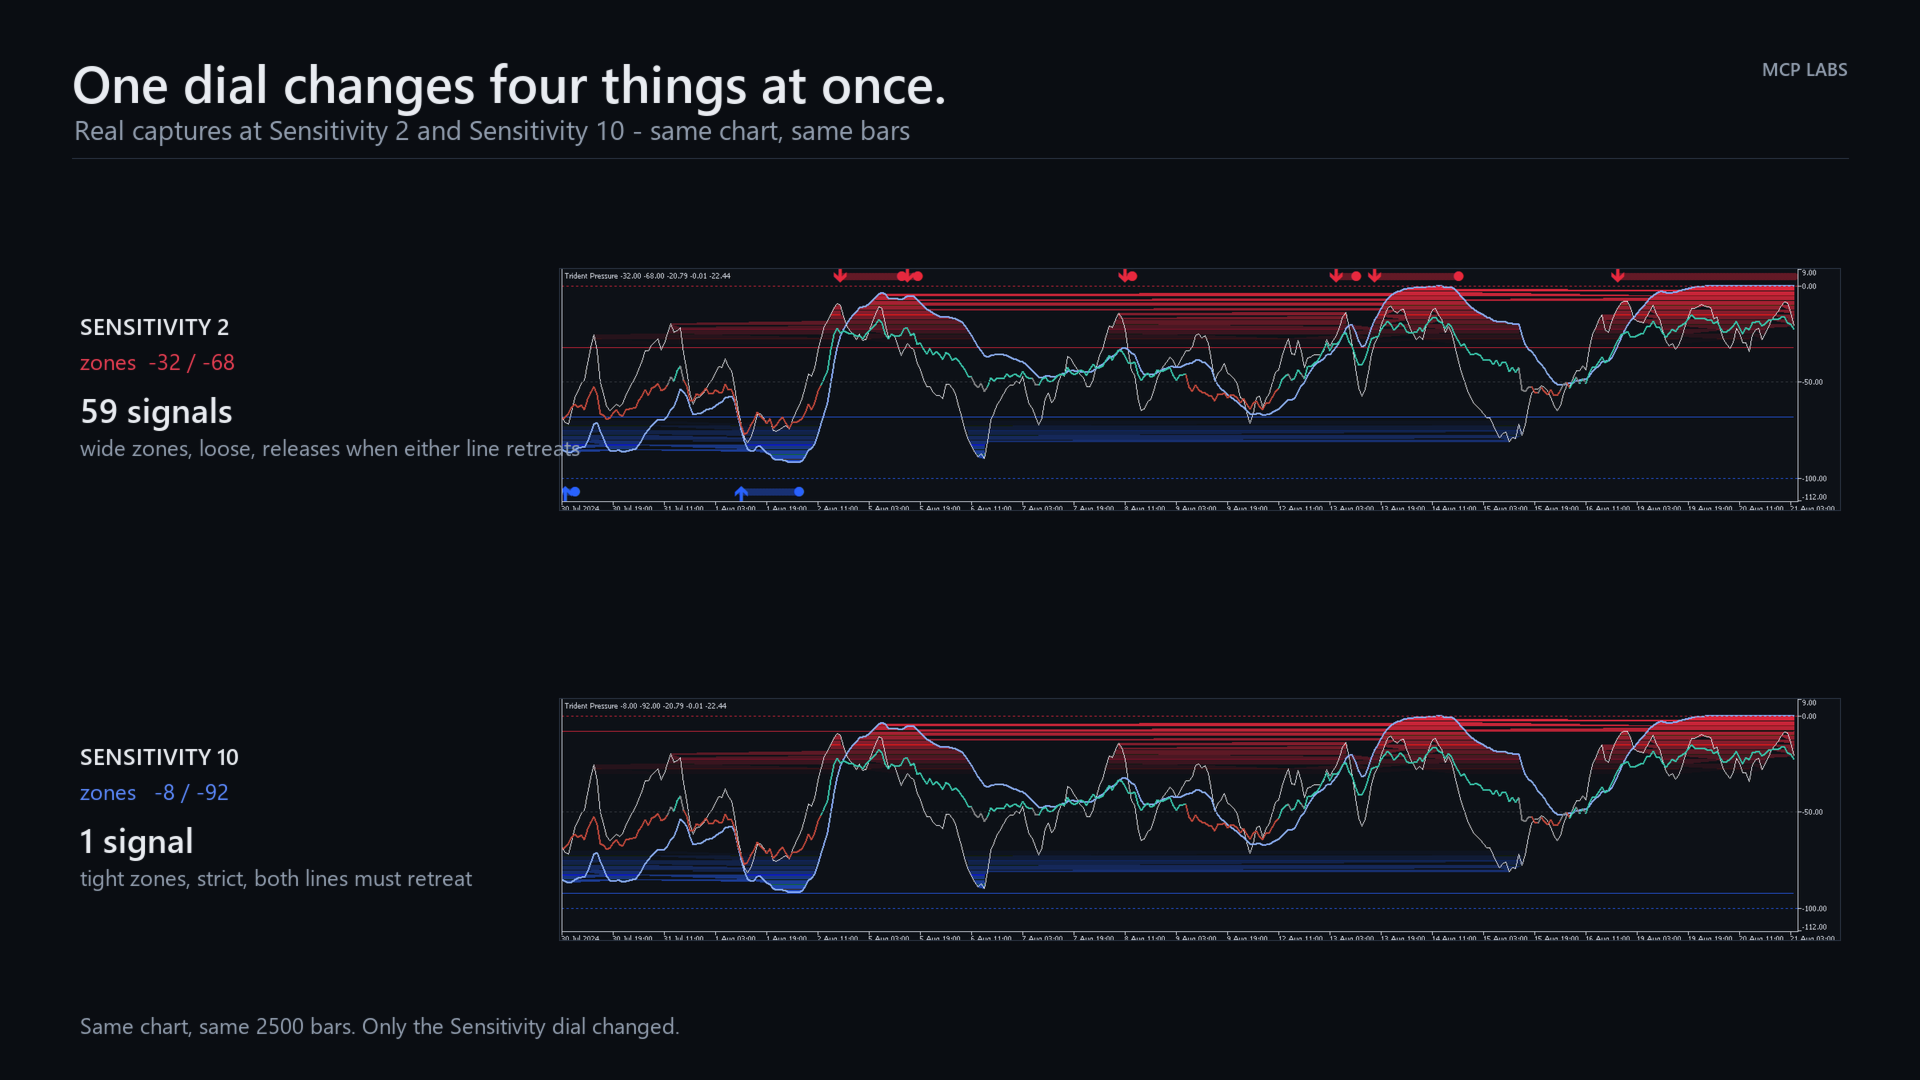
One dial does most of the work. Sensitivity is not a threshold — it moves four things together: where the zones sit, how far price must retreat to release, how many consecutive bars confirm an entry, and at its lowest settings whether release needs both lines to retreat or just one. 1 is loose and jumpy by design. 5 is balanced. 10 is strict and patient. Start at 7.

Everything else is exposed and documented across ten groups: three for the engine, plus colours, visibility, markers, dashboard, alerts and performance.

Alerts

Pressure release, pressure start, and Pulse/Trend crosses. Popup, push notification, email or sound, each independently switchable, with an option to signal only on closed bars.

Built properly

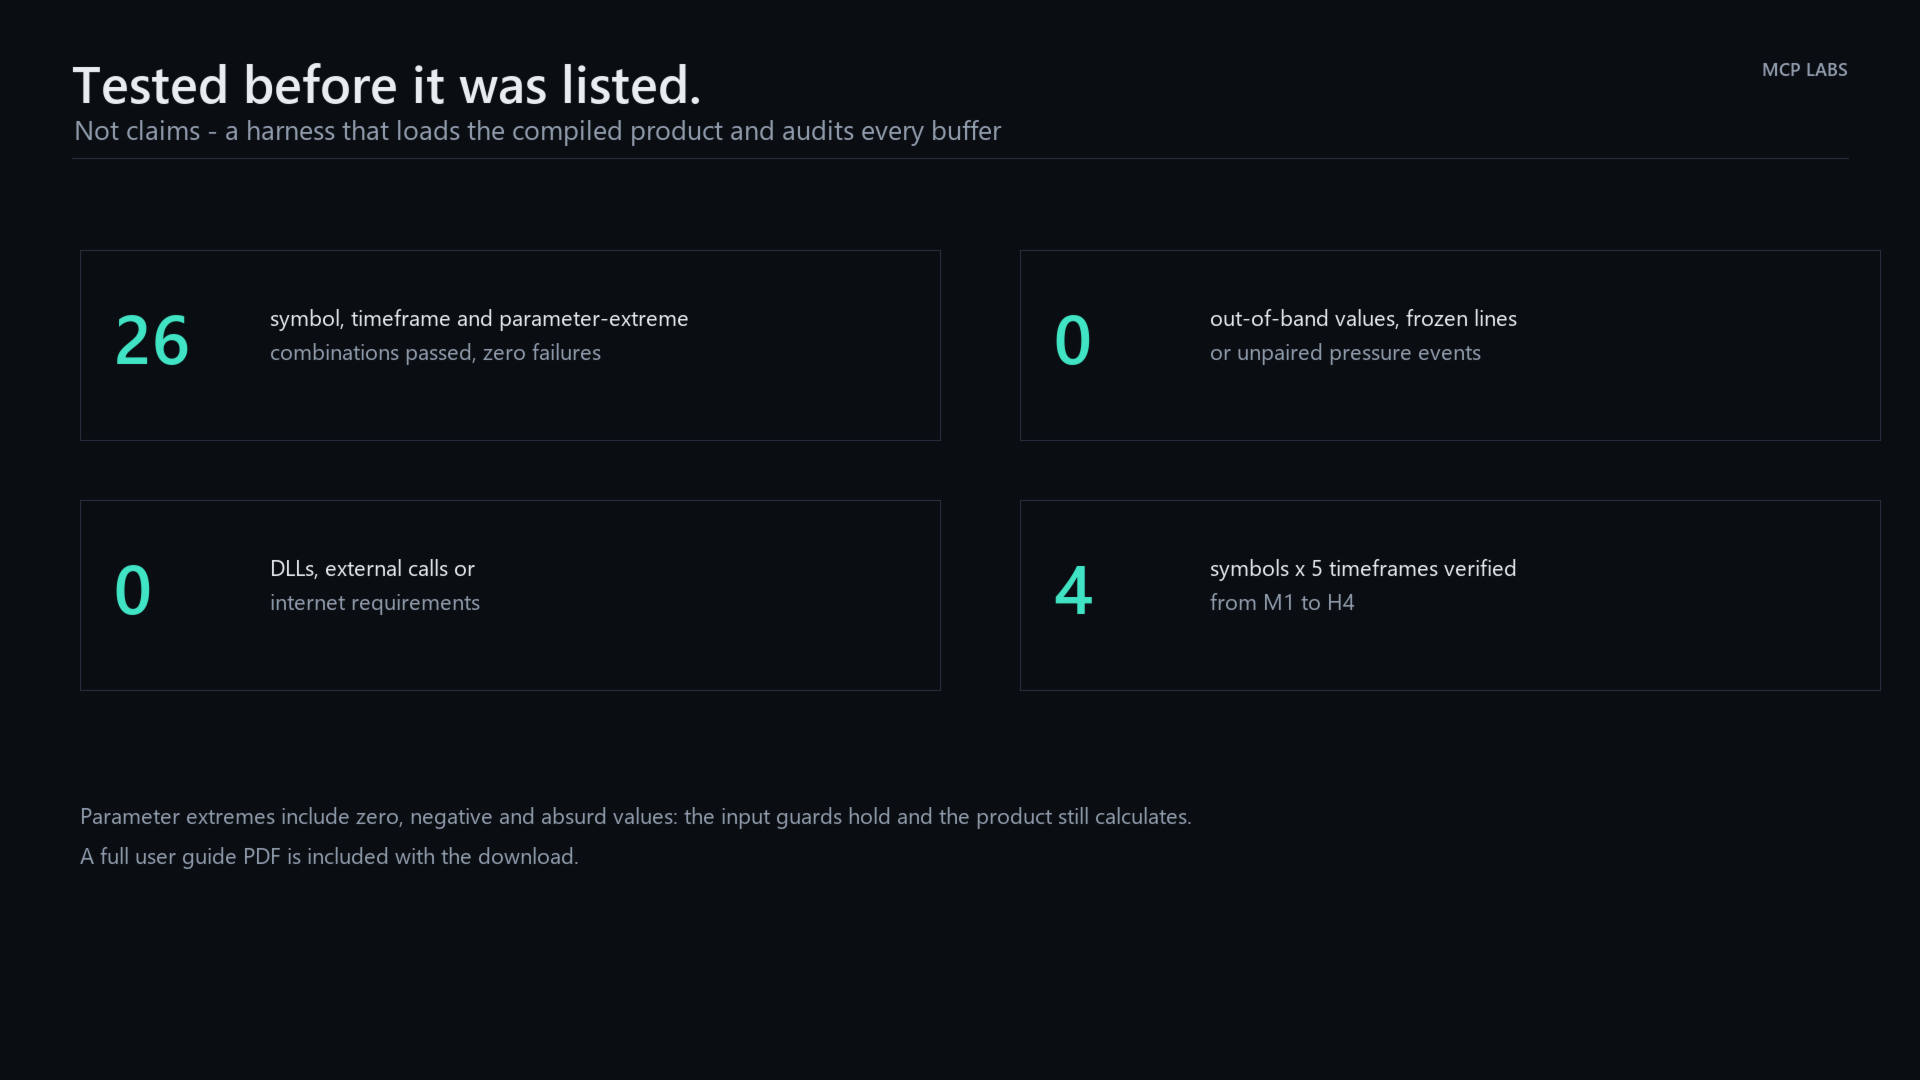
  • Verified across 27 symbol, timeframe and parameter-extreme combinations with zero failures
  • No DLLs, no external calls, no internet requirement
  • Recursive state is held per bar, so re-running the live bar cannot drift
  • Dashboard repaints on bar turn and state change, throttled otherwise
  • Removes every object it creates when you take it off the chart

A full user guide PDF is included with the download.

Input parameters

1. Z-Pulse

  • Pulse Range (21) — primary range window. Lower reacts faster to local range position.
  • Pulse Stochastic (9) — stochastic window applied to the fast range reading. Lower is more reactive.
  • Pulse Smoothing (7) — EMA smoothing of Z-Pulse. 1 leaves the pulse raw.

2. Z-Trend

  • Trend Range (55) — medium horizon used to measure structural range position.
  • Macro Trend (120) — long horizon. Carries the largest internal weight and gives Z-Trend its character.
  • Trend Smoothing (5) — final smoothing. Higher is steadier.
  • Trend Persistence (9.0) — how strongly repeated occupation of an outer zone pulls the line.

3. Pressure Exhaustion

  • Exhaustion Zone (20) — base width of the upper and lower pressure zones.
  • Sensitivity (7) — 1 to 10. Moves the zone, the release distance, the entry confirmation and, at 1 and 2 only, whether release needs both lines or just one. 1 is loose and jumpy by design; 10 is strict and patient.
  • Pulse / Trend Crosses (off) — mark crossovers between the two lines.

4. Pressure Core

  • Reactive Smoothing (16) — calms the reactive component.
  • Regime Weight (0.65) — balance between the slow regime read and reactive pressure.

5. Colours and Style

  • Cold / Hot — the two directional colours used throughout.
  • Upper Level, Lower Level, Level Transparency — the pressure level lines.
  • Z-Pulse, Z-Trend — line colours.
  • Core Bull, Core Bear, Core Neutral, Core Width — Pressure Core styling.
  • Gradient Fill (on) — fade the space between Z-Pulse and Z-Trend inside the pressure zones.
  • Price Boxes (on) and max kept (60) — draw the exhaustion boxes on the chart, and how many to retain.

6. Visibility

  • Show Z-Pulse, Show Z-Trend, Show Pressure Core, Show Pressure Levels, Show Pressure Markers — switch any layer off independently.
  • Lock Pane Scale (on) — hold the pane at a fixed -112 to 9 so the geometry does not shift.

7. Markers

  • Wingdings codes for the active/release dot (108), lower start (233) and upper start (234), plus Marker size. Change these to any glyph you prefer.

8. Dashboard

  • Show Dashboard, Corner, X offset, Y offset — placement.
  • Dashboard on main chart window — or put it in the indicator pane instead.
  • Dashboard font and numeric font.

9. Alerts

  • Terminal popup, Push notification, Email, Sound and Sound file — delivery.
  • Only signal closed bars (on) — recommended. With it off a state can open and close inside one bar.
  • Alert: pressure release (on), pressure start, Pulse / Trend cross — which events fire.

10. Engine

  • Max bars to calculate (5000, 0 = all) — bound the history pass on very long charts.

Note

Trident Pressure is a measurement tool. It reads pressure and tells you when a pressure state has released. It does not predict, and it is not a trading system on its own. Test on a demo account until you understand how it behaves on the instruments and timeframes you actually trade. Trading carries risk of loss.
推荐产品
Universal Soul Reaper
Pieter Gerhardus Van Zyl
Universal Soul Reaper is an atmospheric market-flow oscillator designed to interpret price behavior as a cycle of spiritual energy. Instead of reacting to raw price alone, it visualizes the state of the market’s soul —revealing when momentum is awakening, stabilizing, or fading. The indicator operates in a separate window and presents three interwoven entities: the Ectoplasmic Veil , the Spirit Boundary , and the Soul Core . Together, they form a living framework that helps traders sense pressu
Aurum Swing Grid Signals for MT5 Aurum Swing Grid Signals for MT5 is a clean and practical MetaTrader 5 indicator designed to help traders identify confirmed swing high and swing low areas on the chart. It displays clear buy and sell signal arrows together with visual grid-distance guide lines, making it easier to analyze possible entry zones, take-profit levels, and structured price movement around swing points. This indicator is especially designed for XAUUSD / Gold M1 analysis , but it may al
The   Supply and Demand Zones indicator   is one of the best tools we have ever made. This great tool automatically draws supply and demand zones, the best places for opening and closing positions. It has many advanced features such as multi timeframe zones support, displaying the width of zones, alert notifications for retouched zones, and much more. Because of market fractality, this indicator can be used for any kind of trading. Whether you are a positional, swing, or intraday trader does no
"Impulses and Corrections 5" is created to help traders navigate the market situation. The indicator shows multi-time frame upward and downward "Impulses" of price movements. These impulses are the basis for determining the "Base" , which is composed of zones of corrections of price movements, as well as "Potential" zones for possible scenarios of price movement. Up and down impulses are determined based on a modified formula of Bill Williams' "Fractals" indicator. The last impulse is always "U
Cumulative Volume Delta MA-X MTF(带梯度动量) 该指标为 MetaTrader 5 提供多时区累积成交量德尔塔(CVD)分析。它通过分析报价成交量(Tick Volume)或真实成交量(Real Volume)数据,计算买盘与卖盘压力之间的净差值,从而直观地展示订单流(Order Flow)情绪。 指标逻辑与特性 本指标采用数学方法进行成交量分析: 数据来源 :支持交易所资产的 真实成交量 (Real Volume) ,以及针对外汇/CFD 市场的 OHLC 影线代理算法 (OHLC Wick Proxy) 。 梯度系统 :4 色移动平均线用于识别趋势阶段: 深天蓝 (DeepSkyBlue) :数值为正且正在上升。 橙色 (Orange) :数值为正但正在下降。 洋红色 (Magenta) :数值为负且正在下降。 紫色 (Purple) :数值为负但正在上升。 五层共振系统 (5-Layer Confluence System) 指标集成了五种不同的分析方法: 第一层:成交量德尔塔核心 (Volume Delta Core) —— 计算成交量德尔塔的
TRI Visualizer
Yoshimi Mon 三 Ura
TRI Visualizer MT5 – Thermodynamic Market Analysis Overview The TRI (Thermal Range Indicator) Visualizer Enhanced is a rare market analysis indicator that goes beyond conventional technical analysis, applying principles of thermodynamics from physics. It interprets market price fluctuations as “thermodynamic energy,” enabling the highly accurate detection of subtle market changes that are often overlooked. Innovative Mechanisms 1. Dual Calculation Engines Classic TRI Mode Formula: |Close
Advanced Volume Profile Analysis Tool for MetaTrader 5 The Kecia Volume Profile Order Finder provides traders with volume profile analysis capabilities. This MT5 indicator combines volume profile visualization with statistical calculations to help identify potential trading opportunities and suggests entry, stop loss, and take profit levels based on market structure. Market Profile Visualization Transform your chart with customizable volume profile visualizations: Multiple visualization options
Volume Profile V6
Andrey Kolesnik
4.8 (5)
市场成交量分布(Volume Profile)指标 + 智能震荡器(Smart Oscillator)。适用于几乎所有交易品种——外汇、股票、期货、加密货币,支持真实成交量和Tick成交量。可以自动设置分析区间(例如一周、一个月等),也可以通过移动两条边界线(红色和蓝色两条垂直线)手动设置区间。指标以直方图形式显示。在某一价格水平上,直方图的宽度表示该价位的成交活跃程度(成交次数)。参数“Mode level line color”可用于自动显示最重要的成交量水平,这些位置价格有较大概率发生反应;参数“Maximum color (POC)”则单独标记整个区间内成交量最大的价格水平。 智能震荡器用于显示超买和超卖区域。它通过分析多个指标的数据,并基于处理后的信息,用不同颜色标识超买和超卖区域。 在 Volume every day 模块中,可以通过 Range period 参数设置构建成交量分布的时间周期,通过 Range count 参数设置区间数量。例如:Range period=1Day,Range count=10,表示指标将构建最近10天的日内成交量分布。需要注意的是,切换
XAUUSD OrderFlow Structure AutoPOC Pro is an advanced MetaTrader 5 indicator designed to analyze market structure, order flow, buying and selling pressure, liquidity, and volume distribution directly on the chart. The indicator is especially focused on XAUUSD (Gold) analysis, although it can also be used with other instruments available in MetaTrader 5. Its objective is to bring together several analytical tools that would normally require multiple indicators: market structure, BOS and CHOCH, Or
Total Volume Profile
Shahabeddin Baset
Includes almost all the concepts related to Volume Profile: POC , Value Area , Developing POC , Anchored VWAP , Volume Delta ; since the “Total” in its name. It is fast in its calculations and simple to work with. Features: 1.    Selectable calculation timeframe to find most traded levels. 2.    Capable of calculating Volume Profile based on tick data 3.    Adjustable histogram bars by their count. 4.    Adjustable histogram bars by their height (price range). 5.    Showing Value Area (VA
VibeFox WaveTrend — 动量波、超买/超卖区域与入场点 VibeFox WaveTrend 是一款用于 MetaTrader 5 的实时 WaveTrend 振荡器,基于广为人知的 LazyBear 和 VuManChu Cipher 逻辑构建。它在独立子窗口中绘制平滑的 wt1 与 wt2 波,突出价格冲入超买和超卖极值的时刻,可选地在它们身后绘制 Cipher 资金流,并将入场信号直接标记在价格图表上。这一切都集成在一个现代化的交互式面板中,因此你无需盯着原始的线条交叉,而是在动量、它的极值以及入场点形成的那一刻就能看到它们。 WaveTrend 展示什么 WaveTrend 是一款经过平滑处理的动量振荡器。它取平均价格,通过一条指数通道加以平滑,并将结果转化为两条波:快波 wt1 与它较慢的信号线 wt2 。当波攀升至高位并掉头时,市场向上拉伸过度;当波沉至低位并向上卷起时,市场向下拉伸过度。由于计算经过双重平滑,即使在嘈杂的日内图表上,画面也保持整洁易读。 两条水平水平线框住极值。 OB (超买)水平位于正值区, OS (超卖)水平位于负值区,二者均与一条中央零
Master Edition
Peter Ofunda Fischer
Harvester Pro Universal Master The Ultimate Volatility Breakout & Trend-Following Solution for XAUUSD and Major Pairs. Harvester Pro Universal Master is a professional-grade Expert Advisor (EA) engineered for high-performance trading on the MetaTrader 5 (MT5) platform. Optimized specifically for XAUUSD (Gold) and major currency pairs like EURUSD , this EA combines a sophisticated Volatility Breakout engine with a robust EMA/TEMA Trend-Following filter to capture explosive market moves with surg
Binary Rise Fall
Israr Hussain Shah
Here   our more valuable tools SMC Trend Trading   ,  Easy SMC Trading  ,  Institutional SMC Architect Volume Analysis Tools  ,  Volume flow Profile  ,  Market volume profile  , FVG with Volume  , Liquidity Heatmap Profile  ,  Volume Spread Analysis The Fractals_Price indicator is a technical analysis tool that identifies fractal patterns on price charts. Fractals are recurring patterns that signal potential trend reversals or continuation points. This indicator marks both upward and downward
该指标建立当前报价,可以与历史报价进行比较,并在此基础上进行价格走势预测。指示器有一个文本字段,用于快速导航到所需日期。 选项: 符号 - 选择指标将显示的符号; SymbolPeriod - 选择指标从中获取数据的时段; IndicatorColor - 指示器颜色; HorisontalShift - 由指标绘制的报价移动指定的柱数; Inverse - true 反转引号,false - 原始视图; ChartVerticalShiftStep - 图表垂直移动(键盘上的向上/向下箭头); 接下来是文本字段的设置,您可以在其中输入日期,您可以通过按“回车”立即跳转到该日期。 接下来是文本字段的设置,您可以在其中输入日期,您可以通过按“回车”立即跳转到该日期。
Multi-Timeframe Heiken Ashi (Smoothed with Dashboard) Professional Market Structure Visualization with Weighted Confluence Scoring Transform your trading with crystal-clear multi-timeframe analysis. This indicator combines smoothed Heiken Ashi candles with an intelligent weighted scoring system to give you unprecedented clarity in any market condition. YOUR TRADING QUESTIONS – ANSWERED INSTANTLY: 1. What's the REAL trend direction? Dashboard Reveals:   Higher timeframe (MN1, W1, D1, H4) trend a
Triangle Pattern Gann v3.1 - Complete Feature Documentation Core Functionality OverviewTriangle Pattern Gann v3.1 is a sophisticated MetaTrader 5 indicator that combines W.D. Gann's geometric trading principles with advanced triangle pattern recognition to deliver actionable trading signals. Primary Features1. Triangle Pattern Detection SystemAscending Triangle Recognition Function: Automatically identifies bullish continuation patterns Detection Criteria: Flat horizontal resistance line
Confluence Edge Indicator
Johnson Azumah Sebire
Confluence Edge Indicator Confluence Edge Indicator is a powerful all-in-one technical analysis tool designed to provide a complete multi-timeframe view of market conditions. It removes the need for multiple chart indicators by combining proven trading methodologies into a single, clean, intuitive dashboard. Built for traders who rely on confluence, this indicator delivers real-time analysis using price action, volume, momentum, market structure, and algorithmic scoring concepts. It is designed
Buy Sell Smart
Syamsurizal Dimjati
BUY and SELL smart The BUY and SELL Smart Indicator is a next-generation trading tool engineered for precision scalpers, intraday strategists, and professional analysts who demand both speed and clarity in market visualization. It seamlessly integrates smart candle-based analytics, adaptive ATR logic, and real-time economic event awareness — giving you a fully synchronized view of market volatility and momentum. Through an elegant and optimized interface, FlashScalp delivers   instant signal fee
CRT Master Indicator
Javier Sobrino Vega
CRT Master Indicator identifies market structure cycles based on Candle Range Theory (CRT) and institutional order flow principles: Accumulation, Manipulation, and Distribution. The indicator identifies range sweeps (liquidity grabs) where price manipulates past structural high/low levels before closing back inside the range. It provides visual zone mapping and multi-timeframe context through Ghost Candles. An automated trading version of this logic is available as the CRT Master EA on my MQL5 p
Time and Sales Tick
Pablo Filipe Soares De Almeida
Time & Sales Tick Indicator 是一款专为 MetaTrader 5 平台设计的实时报价与成交监控指标。 该工具能够在图表上实时显示每笔交易的价格、成交量与时间信息,帮助交易者观察市场的细微波动与订单流动。 功能说明 在图表中的独立面板上实时展示价格、成交量与成交时间,便于跟踪市场动态。 可根据用户自定义的时间或数量间隔对成交数据进行分组。 系统自动对价格变动进行颜色区分:上涨以绿色显示,下跌以红色显示,使趋势变化一目了然。 面板可自由放置在图表的任意角落,支持调整大小、字体、透明度和刷新速度。 与所有交易品种和时间周期兼容,可在 MetaTrader 5 平台上稳定运行,不影响主图性能。 适用于分析市场活跃度、监控流动性以及辅助短线或高频交易策略。 此指标为交易者提供了更直观的市场视图,使其能够在高波动市场中更好地识别短期机会并改进决策效率。
Gann Square of 144 for MT5
Taras Slobodyanik
5 (5)
江恩箱(或江恩方)是一种基于 W.D. Gann 的“市场预测的数学公式”文章的市场分析方法。 该指标可以绘制三种正方形模型:90、52(104)、144。有六种网格变体和两种弧形变体。 您可以在一张图表上同时绘制多个方块. 参数 Square — 江恩方格模型的选择: 90 — 90 的平方(或 9 的平方); 52 (104) — 52(或 104)的平方; 144 — 144的万能平方; 144 (full) — 正方形的“完整”版本,结合了其他正方形的线条。 据我们所知,W.D.江恩并没有这样的加价; for Arcs — 圆弧的简化正方形; Grid — 网格的变体: 4x4 (52) — 4 x 4 网格,52 个标记; 5x5 (40); 8x8 (90); 8x8 (104); 8x8 (144); 16x16 (144); 36x36 (144); disable — 禁用网格; Arcs — 弧线的变体: 4x4; 5x5; disable — 禁用弧; 开始时的方形参数: Length of Square, Bars (X-axis) — 正方形的长度(以条
MFI Divergence
Brian Robillos
MFI Divergence for MetaTrader 5 MFI Divergence is a practical and easy-to-use MT5 indicator that detects regular and hidden divergences using the Money Flow Index (MFI) . It is built for traders who want a cleaner way to spot possible reversals , continuation setups , and momentum weakness directly from chart structure. The indicator runs in a separate window and automatically analyzes MFI pivot highs and lows against price highs and lows . When divergence conditions are found, it draws cle
Adaptive Momentum CCI
Samuel Alfred Preston
AdaptiveMomentumCCI Indicator The AdaptiveMomentumCCI is a custom technical indicator for MetaTrader 5 that enhances the traditional Commodity Channel Index (CCI) by incorporating adaptive period adjustments, momentum analysis, and signal filtering. It calculates a smoothed CCI based on a user-defined price source (e.g., HLC/3, OHLC/4, or close), with its period dynamically adjusted using the Average True Range (ATR) to reflect market volatility. The indicator features a dual-line system with
No Demand No Supply MT5
Trade The Volume Waves Single Member P.C.
No Demand No Supply   This indicator identifies   No Demand –No Supply candles to your chart and plots volume bars colored according to the signal. It can be applied to all timeframes or to a specific one only. It can also be used as regular volume indicator  with exceptional future of WEIGHTED VOLUME. Furthermore is has an alert notification, sound and email when a signals occurs. The indicator does not repaint but the alert will come on two candles back due to the definition of No Demand No Su
Blahtech Market Profile MT5
Blahtech Limited
5 (10)
Was: $249  Now: $99   Market Profile defines a number of day types that can help the trader to determine market behaviour. A key feature is the Value Area, representing the range of price action where 70% of trading took place. Understanding the Value Area can give traders valuable insight into market direction and establish the higher odds trade. It is an excellent addition to any system you may be using. Inspired by Jim Dalton’s book “Mind Over Markets”, this indicator is designed to suit the
Price vs Vwap Mt5
Pieter Gerhardus Van Zyl
Price vs VWAP Mt5 is a clean, non-repainting indicator that compares raw market price directly against a rolling Volume Weighted Average Price (VWAP) over a configurable time window. It plots two lines in a separate window: the real closing price and a dynamically calculated VWAP based on recent volume and price interaction. By adapting the VWAP lookback to the chart timeframe, it delivers a clear view of value versus execution, helping traders see whether price is trading at a premium or discou
This indicator presents an alternative approach to identify Market Structure. The logic used is derived from learning material created by   DaveTeaches (on X) Upgrade v1.10: + add option to put protected high/low value to buffer (figure 11, 12) + add  Retracements  value to buffer when Show Retracements When quantifying Market Structure, it is common to use fractal highs and lows to identify "significant" swing pivots. When price closes through these pivots, we may identify a Market Structure S
Volume Delta Scanner MT5
Mariusz Franciszek Szczepanczyk
MT5 體積增量掃描儀 成交量變化掃描器是適用於 MetaTrader 5 的即時市場掃描指標,它能夠在一個面板中同時監控多個交易品種和時間週期。無需手動切換圖表,即可一目了然地查看整個自選清單中的買賣壓力概覽。 該指標基於成交量差值邏輯構建——它根據蠟燭圖結構和成交量計算買賣壓力之間的差異,從而為您提供您選擇監控的每個交易品種和時間框架的直接、未經過濾的市場主導地位視圖。 面板上顯示的內容 面板上會顯示一個簡潔的表格,表格中按行列出了您的股票代號。每行包含股票代碼名稱,後面跟著兩列訊號值和五列時間週期。 每個儲存格顯示以下三種狀態之一: 綠色三角形-買盤壓力占主導地位 紅色三角形 — 拋售壓力主導 — 中性 — 沒有明顯的支​​配地位,市場平衡。 M 欄位-市場偏見過濾器 M欄位採用的是我獨有的價格結構演算法,該演算法是我多年黃金及主要金融工具實盤交易經驗的結晶。該欄目的具體邏輯屬於我的專業商業機密,但它的作用清晰明確,且可量化。 M 指標即時解讀當前市場傾向-並非基於滯後指標或標準移動平均線,而是基於持續預示方向性走勢的特定價格行為模式。這一列指標會告訴你,
GoldPro Max
Taher Ahmed Mohamed Taha Elshafei
GOLDPRO MAX Advanced Multi-Timeframe and Smart Money Market Analysis for MetaTrader 5 GoldPro Max is a professional market analysis indicator for MetaTrader 5 designed to help traders study market direction, price structure, liquidity, market imbalance and potential trading areas from multiple perspectives. The indicator combines Multi-Timeframe Analysis, Smart Money Concepts, Market Structure, Liquidity Analysis, Order Blocks, Fair Value Gaps, Premium and Discount analysis, Smart Analytical Eng
Haven Fibonacci Volume Profiles — 您的自动市场区间分析师 隆重推出 Haven Fibonacci Volume Profiles — 一款将市场分析提升到新水平的强大工具。该指标可自动识别基于重要转向点(枢轴点)构建的关键价格区间,并在每个区间上叠加详细的成交量分布图和斐波那契水平。这使交易者能够即时了解流动性集中在哪里,以及真正的支撑位和阻力位位于何处。 其他产品 -> 这里 . 无需再猜测哪个区间是有效的。该指标为您完成所有复杂的工作,同时显示历史和当前的价格区间,让您全面了解市场背景。 指标主要功能 自动识别区间: 指标可独立找到重要的高点和低点(枢轴点),并在此之间构建价格区间。 详细的成交量分布图: 为每个区间计算并显示成交量分布图,突出显示交易活动最多和最少的区域。 可自定义的斐波那契水平: 斐波那契水平会自动应用于每个区间。您可以启用、禁用并自定义每个水平的颜色(0.0、0.236、0.5、1.0 等)。 POC(控制点)可视化: 成交量分布图清晰显示成交量最大的水平,该水平通常作为强支撑或阻力。 历史分析: 指标不仅显示当前的价格区间
该产品的买家也购买
Trend Sniper X
Sarvarbek Abduvoxobov
4.88 (32)
Trend Sniper X 是一款适用于 MetaTrader 5 的多周期趋势跟踪指标,可帮助交易者清晰精准地识别趋势方向和潜在的反转点。 适用于 MT4: https://www.mql5.com/en/market/product/193245 价格信息: 当前价格为促销价,随着后续更新和新功能的推出,价格可能会有所变动。 赠品优惠: 购买后联系作者,即可免费获取该指标的 Auto-Trade Assistant EA(自动交易助手 EA)。 Code2Profit 频道 通过多时间框架分析掌控市场! 如何使用 Trend Sniper X 最大化您的胜率:核心规则与交易时段技巧 技术规格 平台 MetaTrader 5 指标类型 多时间周期趋势指标 运行时间周期 任何图表时间周期,可独立选择更高的时间周期 (M1–MN1) 主要交易品种 外汇、黄金 (XAUUSD) 及其他差价合约 (CFD) 推荐账户 任何账户类型 可视化 彩色趋势蜡烛 (买入/卖出/微弱/变化) + 买入/卖出箭头 附加模块 交易时段方框 (悉尼、东京、伦敦、纽约) 主要功能 多时间周期趋势分析: 直接在
Neuro Poseidon MT5
Daria Rezueva
4.79 (53)
Neuro Poseidon is a new indicator by Daria Rezueva. It combines precise trading signals with adaptive TP/SL levels - creating best possible trades as a result! Message me and get  Neuro Poseidon Assistant  as a gift to automize your trading process! What makes it stand out? 1. Proven profitability on all assets and timeframes 2. Only confirmed BUY and SELL signals present on the chart 3. Adaptive TP & SL levels generated by the software for each trade 4. Easy to understand - suitable for al
UZFX {SSS} 超短线智能信号 v5.0 MT5 是一款无重绘的高性能交易指标,专为在快速波动的市场中需要精准、实时信号的超短线交易者、日内交易者和波段交易者设计。该指标由 (UZFX-LABS) 开发,融合了价格行为分析、趋势确认和智能过滤技术,可在所有货币对和时间周期内生成高概率的买卖信号、预警信号以及趋势延续机会。 别再对交易犹豫不决了,开始遵循这一专为追求清晰、精准和纪律性市场执行的交易者设计的结构化信号系统吧。 相信我,这是 MQL5 上最优秀的指标之一,所以千万不要错过!!“为睿智交易者打造的智能信号” 最新 5.0 版本现已发布,价格可能会在未事先通知的情况下上涨至 499.99 美元,所以请尽快入手,以免错失良机!! 最终购买前!如果您想获取免费试用版,请通过 WhatsApp 号码 +923030751987 联系我!! 如果您遇到任何问题“或”有任何不明白的地方,请在私聊中向我咨询!!! 主要功能更新 • 自动买入和卖出信号检测 • 先进的反转识别逻辑 • 潜在市场反转前的预警信号 • 趋势延续确认信号 • 内置风险管理功能,包含入场点、止损点、TP1、
Entry Points Pro for MT5
Yury Orlov
4.51 (150)
传奇回归:Entry Points Pro 10。 这款传奇指标曾 3 年稳居 MQL5 Market 前三,如今全面重启。 数百条热情好评(两个版本合计 589 条),每天有数千名交易者用它交易,演示版下载 31,000+   MT4+MT5  次。 五年来我读过你们的每一条评价——在第 10 版里,我没有给出许诺,而是把答案直接做进了产品。指标作者自 1999 年入市, 珍视诚信、自己的声誉和自己的客户 。 Entry Points Pro 给出的入场信号严格不重绘。 而且这一次不再只是作者的一面之词,而是可验证的事实:确认信号只在 K 线收盘后标出,自动化测试记录到 零重绘 (在 EURUSD、XAUUSD 和 BTCUSD 上共 2,486,568 次不变量检查——0 次违规)。测试方法完全公开——您可以在策略测试器中自行复现。 购买后请务必第一时间给我发私信。 我会发给您 扩展版说明书《交易者圣经》 ——使用本指标交易的完整指南——并告诉您如何免费获得 赠品:市场扫描器 ,它能同时分析多个品种和多个时间周期,并在一个界面上显示 Entry Points Pro 此刻在哪里表现
M1 Sniper MT5
Oleg Rodin
5 (7)
M1 SNIPER   是一款易于使用的交易指标系统。它是一个专为 M1 时间框架设计的箭头指标。该指标可以作为独立的系统在 M1 时间框架下进行剥头皮交易,也可以作为您现有交易系统的一部分使用。虽然该交易系统专为 M1 时间框架交易而设计,但它也可以用于其他时间框架。我最初设计此方法是为了交易 XAUUSD 和 BTCUSD。但我发现这种方法在其他市场交易中也同样有用。 指标信号既可以顺势交易,也可以逆势交易。我教授一种特殊的交易技巧,帮助您利用指标信号进行双向交易。该方法基于使用特殊的动态支撑位和阻力位区域。 购买后,您可以立即下载 M1 SNIPER 箭头指标。此外,我还为所有 M1 SNIPER 工具用户免费提供下方屏幕截图所示的 Apollo Dynamic SR 指标!这两个指标的组合可以帮助您更轻松、更准确地利用 M1 时间框架进行交易。 购买后请联系我,免费获取交易提示和奖励指标! 祝您交易成功!
货币强度向导是一个非常强大的指标,为您提供成功交易的一体化解决方案。该指标使用多个时间范围内所有货币的数据来计算这个或那个外汇对的力量。此数据以易于使用的货币指数和货币电力线的形式表示,您可以使用它们来查看这种或那种货币的力量。 您所需要的只是将指标附加到您要交易的图表上,该指标将向您显示您交易的货币的真实强度。该指标还向您显示买卖量压力的极值,您可以在顺势交易时利用这些压力。该指标还显示了基于斐波那契的可能目标。该指标可用于各种交易时间范围。该指标支持各种货币对的交易。   该指标为您提供所有类型的警报,包括推送通知。 购买后请联系我。我将与您分享我的交易技巧,并免费为您提供丰厚的红利指标! 祝您交易愉快,获利丰厚!
Gem SIGNAL
Shengzu Zhong
5 (1)
GEM Signal Pro GEM Signal Pro 是一款適用於 MetaTrader 5 的趨勢跟隨指標,專為希望在圖表上獲得更清晰訊號、更有結構的交易設定,以及更實用風險管理的交易者而設計。 它不僅僅顯示一個簡單的箭頭,GEM Signal Pro 還能以更清晰、更易讀的方式呈現完整的交易思路。當條件確認完成後,指標可在圖表上顯示進場價、止損價與止盈目標,幫助交易者更有效率地評估交易設定。 運作方式 該指標首先根據其內部邏輯識別有效的初始訊號。 當確認條件滿足後,GEM Signal Pro 會在圖表上顯示完整的交易設定。這讓交易者可以更清楚地看到交易結構,並減少手動分析與計算的工作量。 圖表上的交易價位 對於已確認的訊號,GEM Signal Pro 可顯示: 進場價 止損價 止盈 1 止盈 2 止盈 3 風險報酬比 這讓交易設定更容易理解,也有助於讓圖表分析更有條理。 內建風險管理 風險管理是此指標設計的重要部分。 止損位基於近期市場結構,結合附近的擺動高低點與可選的 ATR 緩衝距離。這能讓交易價位更貼近當前市場條件,而不只是依賴固定距離。 圖表資訊面板 GEM Si
Divergence Bomber
Ihor Otkydach
4.89 (94)
购买该指标的每位用户将额外免费获得以下内容: 原创工具“Bomber Utility”,该工具会自动跟踪每一笔交易,设置止损和止盈点,并根据策略规则自动平仓; 适用于不同交易品种的指标设置文件(Set 文件); 三种不同风险模式下的 Bomber Utility 设置文件:“最低风险”、“平衡风险” 和 “观望策略”; 一套详细的 视频操作手册,帮助您快速完成安装、配置并开始使用本交易系统。 注意: 要获取以上所有赠品,请通过 MQL5 的私人消息系统联系卖家。 我为您介绍原创的自定义指标 “Divergence Bomber”(背离轰炸机),它是一套基于 MACD 背离交易策略 的“全功能”交易系统。 该技术指标的主要任务是识别 价格与 MACD 指标之间的背离,并发出交易信号(包括推送通知),指示未来价格可能的运动方向。平均而言,这些信号的准确率超过 98%。有关该指标如何工作的详细说明,请观看本页面上的视频演示。 该系统使用 止损订单 和 动态回撤平仓机制 来管理交易。 Divergence Bomber 指标的主要特点: 支持交易的品种: AUDCAD、AUDCHF、AUDS
SR Liquidity MT5
Oleg Rodin
5 (2)
SR Liquidity   是一款旨在揭示市场流动性高度集中且价格反应最剧烈的隐蔽区域的交易指标。这些特殊的流动性区域充当着强有力的支撑位与阻力位,为您清晰呈现市场最可能发生反转的位置。 SR Liquidity 指标并非简单地绘制常规的支撑/阻力线,而是通过分析实际的价格行为,识别买卖压力积聚的区域。这些区域实际上是推动市场真实波动的流动性池。通过在图表上直观呈现这些区域,该指标能助您在价格反应发生前预判走势——这意味着它实际上能够预测价格方向可能发生的变化。它将原始的价格行为转化为清晰且具实操价值的市场蓝图,标示出那些可能成为市场转折点的关键价位。 该指标适用于任何交易品种和时间周期——包括外汇、指数、金属、加密货币等。支持任意时间周期。 购买后请联系我,以获取交易指南及免费赠送的优质附加指标!
Superhero
Ihor Otkydach
5 (3)
SUPERHERO 指標是一款基於「全方位」原則設計的多貨幣交易系統。該指標能獨立分析市場,並提供開倉與平倉的交易訊號。它採用止損與獲利了結訂單,風險報酬比(R:R)為 1:1。 此系統可向您的智慧型手機發送推播通知,讓您無需綁定電腦,即可「隨時隨地」進行交易。這對於自營交易公司而言再適合不過了。 每位顧客皆可享額外好禮: 每位購買此指標的買家,都將收到我贈送的一項特別實用工具,該工具: 自動下達止損與獲利了結訂單 當價格達到目標水準時,系統會自動平倉 支援待執行訂單交易 支援均值交易模式 如果您希望將這款優秀且極為便利的工具作為禮物獲贈,請在購買 SUPERHERO 指標後,立即透過 MQL5 平台的私訊與我聯繫。此外,您還將獲得培訓課程「如何安裝與設定 SUPERHERO 並開始穩定獲利」的存取權限。 關於「超級英雄」策略 SUPERHERO 策略是利用價格回調時,順應趨勢方向進行盤中交易。 「超級英雄」程式碼內含數個強大的技術指標,用以分析價格通道的趨勢方向與波動範圍,並能識別在修正性回調後形成的盤中波段反轉形態。 SUPERHERO 指標採用獨特的自我優化演算法,一旦添加至價格
M1 Quantum MT5
Hamed Dehgani
4.27 (11)
使用 M1 Quantum 的实盘交易信号 : 信号 (交易由 Quantum Trade Assistant 自动 执行,并作为本产品 免费 提供。) 最新消息: 版本 1.64 已发布。现在所有交易的止损都会设置在相应的支撑位/阻力位之后。Smart Close 功能也进行了改进,以提升此版本 EA 的性能。 自 8 月 9 日起,实盘信号一直运行在版本 1.64 上。 价格计划: 当前价格: $169 (早期用户优惠) 下一阶段计划价格: $189 计划零售价: $299 开发者提示: 购买后请联系我,以获取 最新推荐的参数设置文件(Set File) 、交易建议,以及加入 VIP 支持群组 ,与其他 M1 Quantum 用户交流经验。 常见问题 - 设置文件 - 安装指南 M1 Quantum 是一款专业的 M1 交易系统,提供快速且精准的交易信号,并内置止损(Stop Loss)、止盈(Take Profit)以及智能资金管理功能。 M1 Quantum 包含专业的资金管理系统,通过专注于 连续盈利交易 ,帮助交易者更快地增长账户资金。 M1 Quantum 指标 的主
ICT PO3 (Power of 3) AMD Protocol Framework Indicator True Time & Structure Integration   |  Non-Repainting | Real-Time  | Multi-Asset  | MT4 Version Available Full Setup Guide & Strategy Playbook: https://www.mql5.com/en/blogs/post/768683 MT4 Version: https://www.mql5.com/en/market/product/171742 Indicator Overview The ICT PO3 AMD Protocol Framework is a complete structural overlay for MetaTrader 5 that maps the True Daily Cycle directly onto your lower-timeframe execution chart. It project
Trend Forecaster
Alexey Minkov
5 (8)
Trend Forecaster 是一款 MetaTrader 5 指标,可将突破信号、潜在反转区域分析、市场波动区间数据和可视化统计面板整合到同一个图表工作区中。 它可以显示 Buy 和 Sell 信号,跟踪 Average Range 和 Current Range,并且可以根据当前交易品种和时间周期自动调整 Sensitivity。也支持手动设置 Sensitivity。 该指标可用于外汇货币对、金属、股票、指数和加密货币。支持不同时间周期,M5 可以作为一个实用的起点。 主要功能 突破和反转区域分析 Trend Forecaster 会分析已识别区域附近的价格行为,并在内部突破条件满足时显示 Buy 或 Sell 信号。该指标可用于研究趋势延续和潜在反转区域。 多过滤器信号逻辑 该指标将多个内部过滤器整合为一个简单的工作流程。用户在开始分析前不需要配置大量技术参数。 Auto-Tune Sensitivity 该指标可以根据近期历史数据,自动为当前交易品种和时间周期计算 Sensitivity。这有助于在切换不同交易品种时减少手动设置。 手动设置模式 如果你更喜欢固定设置,或
* 由于所有主要货币数据的真实性,——建议使用实时图表。 Get   UEX Reader - Expert Advisor   for free: https://www.mql5.com/en/market/product/166805 什么是纯美元欧元指数: 英文说明: https://www.mql5.com/en/market/product/152936 使用纯美元欧元指数,探索外汇市场的真实脉搏 ——这是一个创新指标,能够真正揭示全球两种最强势货币之间隐藏的优势和劣势。 与欧元美元等单一货币对不同,此工具衡量美元和欧元在多个主要货币对中的总体表现 ,从而提供清晰、均衡的真实市场情绪视角。 通过整合所有核心美元和欧元货币对的数据, 此指标构建了同步的指数图表,能够反映真实的货币走势 ——而不仅仅是单一货币对的波动。 当美元占据主导地位、欧元反击时,您将立即看到并收到通知, 并在两者之间的平衡发生变化时获得洞察力,这通常比市场做出反应提前几分钟。 这一概念将成为您应对市场的可靠抓手。 纯美元和欧元指数使交易者能够预测趋势变化, 过滤虚假信号,并根据真实的市场
Advanced Currency Strength28 MT5
Bernhard Schweigert
5 (3)
任何新手或专家交易者的最佳解决方案! 这个指标是一个独特的、高质量的、可负担得起的交易工具,因为我们纳入了一些专有的功能和一个新的公式。只需一个图表,你就可以读出28个外汇对的货币强度!想象一下,你的交易将如何得到改善,因为你的交易是在你的手中进行的。想象一下,你的交易将如何改善,因为你能够准确地确定新趋势或剥头皮机会的触发点? 用户手册:点击这里  https://www.mql5.com/en/blogs/post/697384 这是第一本,原版的! 不要买一个毫无价值的崇拜者的克隆品。 特别的 子窗口中的箭头显示强劲的货币势头GAP将指导你的交易! 当基础货币或报价货币处于超卖/超买区域(外盘斐波那契水平)时,在个人图表的主窗口中出现警告信号。 当货币力量从外围区间回落时,回撤/反转警报。 十字星模式的特别警报 可选择多个时间框架,以快速查看趋势! 货币强度线在所有的时间框架中都非常平稳,当使用较高的时间框架来识别总体趋势,然后使用较短的时间框架来确定精确的入口时,效果非常好。你可以根据自己的意愿选择任何时间框架。每个时间框架都由其自身进行了优化。 建立在新的基础算法
Advanced Supply Demand MT5
Bernhard Schweigert
4.53 (15)
任何新手或专业交易者的最佳解决方案! 该指标是一款独特、高质量、且价格合理的交易工具,因为我们已经整合了许多专有功能和新公式。 依据此更新,您将能够显示双重时间帧区域。 您不仅可以显示一个较高的时间帧,还可以同时显示图表时间帧,加上更高的时间帧:显示嵌套时区。 供需双方所有交易者都会喜欢它。 :) 重要信息披露 高级供需的最大潜力,请访问 https://www.mql5.com/zh/blogs/post/720245   想象您的交易如何得以改善,是因为您能够精准定位入场或目标位吗? 构建于新的底层算法,它可以更轻松地识别出买卖双方之间的潜在失衡。 这是因为它以图形方式展示供需最强劲区域,及其过去的表现(显示旧区域)。 这些功能旨在帮助您更轻松地发现最佳入场区域和价位。 现在您可以针对您的交易品种和时间帧来优化和编辑区域强度! 高级供需指标适用于所有产品和时间帧。 它是一个新的公式,非常新的功能是两个区域强度函数可由用户输入进行调整! 这在交易中是一大优势。 当您学习如何使用专有功能,例如带有价格游离最小 X 因子的区域强度时,您能够判断该区域强劲与否。 供需区域用作警报触发器。
对任何新手或专家交易者来说都是最好的解决方案! 这个指标是一个独特的、高质量的、负担得起的交易工具,因为我们已经纳入了一些专有的功能和一个秘密的公式。只需一张图表,它就能给出所有28种货币对的警报。想象一下,你的交易将如何改善,因为你能够准确地确定新趋势或剥头皮机会的触发点 建立在新的基础算法上,它使识别和确认潜在交易变得更加容易。这是因为它以图形方式显示了一种货币的强势或弱势是否正在加速,并测量了这种加速的速度--把它想象成你汽车中的速度表。当你加速时,事情显然会发生得更快,这在外汇市场上也是一样的,即如果你配对的货币正在向相反的方向加速,你就会发现一个潜在的有利可图的交易。 货币动量的垂直线和箭头将指导你的交易! 动态的市场斐波那契23水平被用作警报触发器,将适应市场活动。如果冲动触及黄色触发线,您将在MetaTrader或您的电子邮件或推送警报中收到警报。然后你就知道作为一个交易员应该做什么。货币对和方向已经给出。只要点击警报按钮,就可以切换到该货币对或打开一个新的图表,以便进一步分析。警报级别可以通过用户输入来改变,可以选择3个敏感度级别。 尽早获得新趋势的初始化触发
Azimuth Pro
Ottaviano De Cicco
5 (7)
Azimuth Pro V2:MT5合成分形结构分析与确认入场 概述 Azimuth Pro 是 Merkava Labs 推出的多层级波段结构指标。四层嵌套波段层级、锚定波段的VWAP、ABC形态识别、三时间框架结构过滤以及收盘确认入场——一个图表,一个从微观波段到宏观周期的完整工作流程。 这不是盲目的信号产品。它是一个以结构为先的工作流程,专为重视位置、背景和时机的交易者打造。 ️ 夏季促销 — 庆祝夏至与 The Oracle Pro 上市:Azimuth Pro 七折优惠,现价 279 美元(原价 399 美元)。限时夏季优惠。 1. V2的变化 合成多时间框架引擎 高时间框架分析从零开始重建,采用与Meridian Pro相同的专有合成架构。更清晰的HTF背景、稳定的实时行为、无经典MTF同步问题。合成引擎还解锁了 固定比率时间框架级联 (x2、x3、x4、x6)——不再在经纪商的固定时间框架之间任意跳转,您可以按图表时间框架的固定倍数分析结构,在每个尺度上保持相同的分形关系。 确认入场箭头 作为稳定且可恢复的执行层而设计的收盘确认箭头。当ABC设置形成且自适应确认逻辑
Precision Spike Detector
Francisco Mandomo Simbine
5 (2)
Precision Spike Detector V3 – Institutional-Grade AI Trading System Attention: The price increases by US$50 for every 10 purchases.  Final price: US$599 Precision Spike Detector V3   is a   state-of-the-art, institutional-grade market analysis system   for   MetaTrader 5 , designed to detect   high-probability market movements   in synthetic indices such as   Boom, Crash, GainX, and PainX . After purchase, send me a private message to receive the optimized configuration files,  the installation
SkyHammer Signal Pro
Shengzu Zhong
5 (4)
SkyHammer Signal Pro Professional No-Repaint Trend Signal Indicator with Locked Entry, SL and TP Levels SkyHammer Signal Pro is a structured trend and momentum signal indicator designed for traders who want clear, fixed, and verifiable trading signals. It works best on lower timeframes such as M1 and M5 . The indicator does not try to predict tops or bottoms. Instead, it waits for confirmed market structure, trend direction, momentum strength, volatility quality, and target space before generati
The Oracle Pro
Ottaviano De Cicco
5 (1)
The Oracle Pro:用于 MT5 的合成多周期偏向引擎 ️ 夏季上市优惠 — 早期买家可以 199 USD 获得 The Oracle Pro。价格将随关注度上升;最终价格 399 USD。 The Oracle Pro 是一款面向高要求与专业交易者的 MetaTrader 5 高级多周期 偏向引擎 。它以纪律回答一个问题:当前每个周期的方向偏向是什么、强度如何、各周期之间的一致程度如何?一切仅在已收盘的 K 线上计算——绝不重绘。 The Oracle Pro 是一套多因子共识系统。它将专有指标与优化算法整合为单一而精密的共识向量,并在单个指标实例内,跨当前周期与更高周期的堆栈进行读取——而不是在多个图表上堆叠互不相关的工具。 它是 Oracle 共识方法的专业进化版:完整重建为高级操作控制台,面向希望在一个纪律化工作流中获得深度、多周期背景与背离洞察的交易者。 是偏向引擎,而非信号生成器 The Oracle Pro 明确自身定位。它是一款提供纪律化方向背景的 多周期多因子偏向指标 。它 不是 信号生成器:不承诺入场、出场或盈利。偏向是背景——你在其方向上交易自己的设置
FX-AIEA 供给需求区智能识别指标(Supply and Demand Indicators MT5)——技术原理与参数讨论 版本:2.51 | 适用平台:MetaTrader 5 引言 供给需求区是机构订单流的重要表现形式,相比传统支撑阻力位能更直接地反映买卖力量的失衡。本指标尝试通过算法自动识别高概率供需区域,以减少手动绘制的耗时与主观性。其核心逻辑基于自适应 ZigZag 算法,提取波峰波谷并生成区域标识 。 核心技术特点 全自动绘制机制 :基于改良版 ZigZag 动态提取有效极值,标记潜在供给区与需求区。指标遵循 MQL5 原生   prev_calculated   机制,在新 K 线生成时自动重绘,支持跨周期强制计算( Forced_TimeFrame   参数)。 区域边界模式 :支持宽带(覆盖K线影线极值)与窄带(仅覆盖实体)两种模式,用户可通过   use_narrow_bands   参数切换,以适应不同交易风格。 滤噪算法 :启用   kill_retouch   后,自动剔除被后续行情反复轻触但未有效突破的弱势区域,以提升信号有效性。 视觉与性能 :支持自
MOST ELLIOTT WAVE TOOLS JUST DRAW LINES. THIS ONE VALIDATES EVERY PATTERN AGAINST THE 3 CARDINAL RULES — OR REJECTS IT. Elliott Wave analysis is one of the most powerful — and most difficult — methods in technical trading. Most indicators fake it. They draw zigzag lines and call them waves without checking a single Elliott Wave rule. Elliott Wave Detector Pro is different. It was built from the ground up to detect, v
KURAMA GOLD SIGNAL PRO(MT5)— 7层过滤 · 自动止盈止损 · 质量评分 · 信号历史保存 | 完整的XAUUSD交易系统 实时不重绘。信号出现的瞬间,箭头、入场、止盈、止损当场锁定,之后绝不移动。你交易的就是这个实时信号。而且在v7.20中,每一个真正发出的信号都会自动保存,并在重启后精确还原。 购买者专属赠品 购买永久授权,即可免费获得 AI Zone Radar(价值$59)+ 完整PDF手册。在产品价格之外,额外附赠价值$59的赠品。购买后在MQL5上给我留言即可。 AI Zone Radar: https://www.mql5.com/en/market/product/175834 在黄金交易者社区中被实际使用,因精度与易用性而广受好评。 你的难题 —— 以及解决方案 黄金一天波动$30–$50。你知道机会就在那里。但这些情况是否似曾相识: - 入场太早,价格逆行$10后才朝你的方向
PrimeScalping
Temirlan Kdyrkhan
PrimeScalping is a powerful trading companion designed to generate high-probability entry signals with dynamic TP/SL/DP levels based on volatility. Built-in performance tracking shows win/loss stats, PP1/PP2 hits, and success rates — all updated live. Key Features: Buy/Sell signals with adaptive volatility bands Real-time TP/SL/DP levels based on ATR Built-in MA Filter with optional ATR/StdDev volatility Performance stats panel (Success, Profit/Loss, PP1/PP2) Alerts via popup, sound, push, or e
TrendMaestro5
Stefano Frisetti
note: this indicator is for METATRADER4, if you want the version for METATRADER5 this is the link:  https://www.mql5.com/it/market/product/108106 TRENDMAESTRO ver 2.5 TRENDMAESTRO recognizes a new TREND from the start, he never makes mistakes. The certainty of identifying a new TREND is priceless. DESCRIPTION TRENDMAESTRO identifies a new TREND in the bud, this indicator examines the volatility, volumes and momentum to identify the moment in which there is an explosion of one or more of these da
Quant Direction MT5
Georgios Kalomoiropoulos
Quant Direction 是一款三维市场分析工具。它通过同时计算多个维度上的精确百分比偏差,提供完全客观的、基于算法的市场分析视角。该算法采用先进的人工智能建模工具开发,并经过全面测试,旨在以独特的精准度解读市场。它可以分析您平台上的任何货币对或金融工具。 无论您是短线 交易者、日内 交易者还是波段交易者,Quant Direction 都是您的理想之选。 交易者的真正优势 Quant Direction 的真正优势在于彻底消除情绪、屏幕疲劳和过度思考。它无需手动点击十几个图表来寻找方向并反复质疑自己的偏好,引擎即可在几毫秒内即时处理 8 个时间周期(从 5 个月到月线)。它能准确告诉你任何时刻谁在掌控市场,确保你始终朝着概率最高的方向进行交易。 市场分析的三个维度 该算法将市场分为三个不同的交易维度,为您提供完整的宏观和微观视角: 超短线交易分析: 捕捉即时、快速的动量变化和较低时间框架的执行点。 日内分析: 识别真实的、潜在的每日方向性偏差。 波动分析: 专注于宏观趋势,确保您不会与大盘机构的走势背道而驰。 独家评分引擎 Quant Direction 的底层采用了一套
Smart Market Structure Toolkit
Garry James Goodchild
5 (1)
Smart Market Structure Pro by G-Labs — ICT and Smart Money Concepts toolkit with built-in multi-symbol scanner for MetaTrader 5. Break of structure, change of character, order blocks, fair value gaps, liquidity sweeps, premium and discount zones, ICT sessions, confluence scoring, AI trade ideas, and a traffic-light scanner across up to 30 pairs and four timeframes from one chart. Map SMC and ICT on the active chart while the built-in scanner monitors your full watchlist. Each cell shows BUY, S
Quantum TrendPulse
Bogdan Ion Puscasu
5 (25)
介绍 Quantum TrendPulse   ,这是一款终极交易工具,它将 SuperTrend   、   RSI 和 Stochastic 的强大功能整合到一个综合指标中,以最大限度地发挥您的交易潜力。该指标专为追求精准和效率的交易者而设计,可帮助您自信地识别市场趋势、动量变化以及最佳进入和退出点。 主要特点: 超级趋势整合: 轻松跟随当前的市场趋势并乘上盈利浪潮。 RSI 精度: 检测超买和超卖水平,非常适合把握市场逆转时机,可用作 SuperTrend 的过滤器 随机精度: 利用随机振荡在波动的市场中寻找隐藏的机会, 用作超级趋势的过滤器 多时间范围分析: 从 M5 到 H1 或 H4,在不同时间范围内关注市场动态。 可定制的警报: 当您的自定义交易条件得到满足时收到通知,这样您就不会错过任何交易。 无论您是新手还是经验丰富的交易员,   Quantum TrendPulse 都能为您提供所需的优势,帮助您增强策略并自信地进行交易。借助这一强大的指标,将洞察力转化为利润 — 掌控您的交易! ***购买 Quantum TrendPulse,即可免费获得 Quantum Tr
Btmm state engine pro
Garry James Goodchild
5 (4)
BTMM State Engine Pro by G-Labs — Beat The Market Maker indicator for MetaTrader 5. Asian session range, London and New York kill zones, level progression (L1/L2/L3), peak formation detection (PFH/PFL), entry signals, and a multi-pair scanner from one chart. Stop scanning charts one pair at a time. The State Engine tracks the BTMM daily cycle automatically — Asian box, room boundaries, level blocks, peak formations, and filtered entries — while the scanner dashboard shows level, peak status, d
作者的更多信息
Apex Drawdown Zero
Tshivhidzo Moss Mbedzi
Current setup: Version 9.20 Use XAUUSD, EURUSD or EURJPY on H1. Earlier comments describing M15 settings, monthly growth targets or a March 2026 expiry relate to older releases and are not the setup guide for Version 9.20. Use the current description and settings for the version installed in your terminal. For version or activation questions, contact me through MQL5 private messages. Drawdown Zero is the product name, not a guarantee of zero drawdown or loss-free trading. Apex Drawdown Zero V9 —
SMC Fibonacci OTE
Tshivhidzo Moss Mbedzi
SMC Fibonacci OTE for MetaTrader 5 Automated chart analysis for traders who use market structure and Fibonacci retracements. This indicator draws analytical levels and alerts; it does not place or manage orders. SMC Fibonacci OTE is a technical indicator for MetaTrader 5 designed for traders following Smart Money Concepts (SMC) . It automates the detection of market structure shifts and maps the Optimal Trade Entry (OTE) zone, providing you with clear entry, stop loss, and multiple take-profit l
Super Signals Channel
Tshivhidzo Moss Mbedzi
Super Signals Channel Indicator Its channel is a non-repaint indicator that reacts more with recent price movements. For this reason, the Super Signals Channel Indicator is a better match for short-term or day trading strategy. The Super Signals Channel only plots swing trading opportunities. So most of its trade signals appear during consolidation or sidelined periods of the market. Super Signals Channel Indicator for MT4 Explanation The green band below the price shows the dynamic support le
FTMO Smart Trader EA
Tshivhidzo Moss Mbedzi
4 (3)
介绍 FTMO Smart Trader EA:您应对 Prop Firm 挑战的终极解决方案 您想通过像 FTMO、FundedNext 或 The Funded Trader Program 这样的 Prop Firm 挑战吗?FTMO Smart Trader EA 是专门为实现这一目标而设计的。凭借令人印象深刻的  胜率和仅  的回撤,该专家顾问精心制定了满足这些 Prop Firm 严格要求的策略。 限时优惠:在价格上涨至 $1,000 之前,以 $600 的价格购买仅剩的 4 份副本! FTMO Smart Trader EA 的关键功能: 高级算法:专家顾问采用先进的技术和复杂的算法,确保做出快速准确的交易决策。 全面的风险管理:通过先进的风险管理协议,您可以确保您的资金始终安全。 多时间框架和多货币对分析:FTMO Smart Trader EA 分析多个时间框架和货币对,以做出最佳可能的交易决策。 单图表设置:只需在 EURUSD 上运行 EA,它将为您交易一个符号。 与 Prop Firm 账户兼容:FTMO、MFF、ROYAL、The Funded Trader
Atm Gbpusd Robot v1
Tshivhidzo Moss Mbedzi
ATM GBPUSD Robot v1 for MetaTrader 4 Atm Gbpusd Robot v1 automates trading on GBP/USD using the M15 chart timeframe. It is intended for traders who want to evaluate an automated GBP/USD setup in MetaTrader 4 before using it on their own account. Platform and setup Platform: MetaTrader 4. Symbol: GBP/USD. Chart timeframe: M15. Use broker conditions with a low GBP/USD spread and sufficient free margin for your selected trading volume. Before purchasing Download the Market demo and run it in Strate
Super Signals Channel Indicator A professional non-repainting channel indicator designed for swing trading and short-term trading strategies. The indicator identifies dynamic support and resistance levels and generates clear buy/sell signals with visual arrows on the chart. KEY FEATURES • Non-Repainting Signals - All signals remain fixed once generated • Dynamic Channel Bands - Automatically adjusts to market volatility • Clear Visual Arrows - Green arrows for buy signals, red arrows for sell si
Auzar
Tshivhidzo Moss Mbedzi
5 (1)
Auzar MT5 – AI Prop Firms Forex Robot for Gold (XAUUSD) Scalping The Auzar MT5 Expert Advisor is a next-generation AI-powered trading system developed for MetaTrader 5 (MT5) . It provides a scalping solution for Gold (XAUUSD) , specifically engineered to meet the requirements of prop firm trading environments such as FTMO , Funded Next , and My Forex Funds (MFF) . Built on neural network technology , Auzar adapts dynamically to evolving market conditions, delivering precision, consistency, and
F T M O Range Breakout Pro MT5
Tshivhidzo Moss Mbedzi
1 (1)
FTMO Range Breakout Pro is a professionally developed Expert Advisor designed for breakout trading in structured environments such as evaluation accounts. Built for MetaTrader 5, it adapts to varying broker conditions using a proprietary range detection algorithm and risk control system. This EA offers configurable settings tailored for traders who aim to follow strict drawdown and execution criteria often found in prop firm accounts. Key Features Smart Range Detection – Dynamically identifies a
Gold Maximizer
Tshivhidzo Moss Mbedzi
Gold Maximizer is an Expert Advisor for MetaTrader 5 that trades support and resistance breakouts on XAUUSD. It combines nine independent breakout strategies on one chart. Each strategy works on its own timeframe, watches its own price levels, and opens at most one position at a time. Trading strategy The EA identifies recent highs and lows over different lookback periods and places pending stop orders beyond those levels. When price breaks out of its recent range, the pending order is trigge
SessionsPro
Tshivhidzo Moss Mbedzi
Sessions Pro is a trading sessions indicator for MetaTrader 5 that draws the London, New York, Tokyo and Sydney sessions with their high/low ranges, session VWAP, an economic calendar news filter, a candle countdown timer and a live dashboard panel. One indicator instead of the five most traders stack on a chart. It works on any symbol - forex, indices, metals, crypto - on every timeframe from M1 to H12. All four sessions are fully configurable: rename them, change their hours, restrict them t
Regression Breakout Map
Tshivhidzo Moss Mbedzi
Regression Breakout Map is a breakout indicator for MetaTrader 5 built around an adaptive linear regression channel. It finds periods where volatility has contracted, marks the breakout when price leaves the channel, and then draws the complete trade map on your chart: entry, stop loss, and a TP1 / TP2 / TP3 target ladder with a stop that ratchets forward as each target is reached. It works on any symbol - forex, indices, metals, crypto - on every timeframe from M1 to H12, and it does not repa
SMC Reversal Map
Tshivhidzo Moss Mbedzi
SMC Reversal Map is a Smart Money Concepts (SMC) indicator for MetaTrader 5 that marks change of character reversals - the moment market structure breaks and the trend in control loses it. It does something most SMC tools do not: before it shows you a signal, it looks up how the most similar setups in your chart's own history actually turned out, and tells you the result as a confidence score you can act on. It works on any symbol - forex, indices, metals, crypto - on every timeframe, and it d
Cheetah Gold Scalper
Tshivhidzo Moss Mbedzi
Cheetah Gold Scalper - XAUUSD Expert Advisor for MetaTrader 5 Tick-based XAUUSD scalping robot for MetaTrader 5 hedging accounts. The default limits are two baskets per day and up to two positions per basket. Fewer entries, including no trades, are possible. Cheetah Gold Scalper is an automated trading robot for XAUUSD on MetaTrader 5 (MT5). It trades one situation: a fast move in gold that the strategy attempts to trade for a reversal. When price travels a set distance within about a minute
Savanna Gold Trend
Tshivhidzo Moss Mbedzi
Savanna Gold Trend - XAUUSD Expert Advisor for MetaTrader 5 Trend-continuation trading robot for gold on MT5. Pyramids into a running move, never averages down, stop loss on every position. Savanna Gold Trend is an automated trading robot for XAUUSD on MetaTrader 5 (MT5). It waits for price to break out of its recent range in the direction of the higher timeframe trend, opens a position, and then adds further positions only while that move keeps running in profit. Each position is then manage
Apex Helios
Tshivhidzo Moss Mbedzi
APEX HELIOS - ONE QUALIFIED TRADE PER DAY ON GOLD Most gold robots trade constantly. Apex Helios does the opposite. It maps the opening range of each session, waits for one qualified break from that range, and then does nothing for the rest of the day. If no setup meets its quality thresholds, it does not trade at all. One position at a time. A stop loss attached from the moment it opens. Risk on any single trade capped by design. BUILT FROM A TRADE LOG, NOT FROM AN IDEA Version 11 is no
筛选:
无评论
回复评论