Trident Pressure
- 지표
-
Tshivhidzo Moss Mbedzi
 I build MetaTrader 5 Expert Advisors for gold and forex, and I publish the parts most sellers hide: the losing months, the strategies I rejected, and a test year I never tune on.
How I build:
• A stop-loss on every trade, from entry. No martingale, no grid, no averaging, no recovery mode. - 버전: 1.0
- 활성화: 15
Trident Pressure
Three pressure layers. One exhaustion state machine. A signal you can wait for.
An oscillator that reaches an extreme tells you nothing about timing. Markets stay extreme for days. Trident Pressure is built around the opposite idea: the tradeable moment is not when pressure peaks, it is when pressure releases.
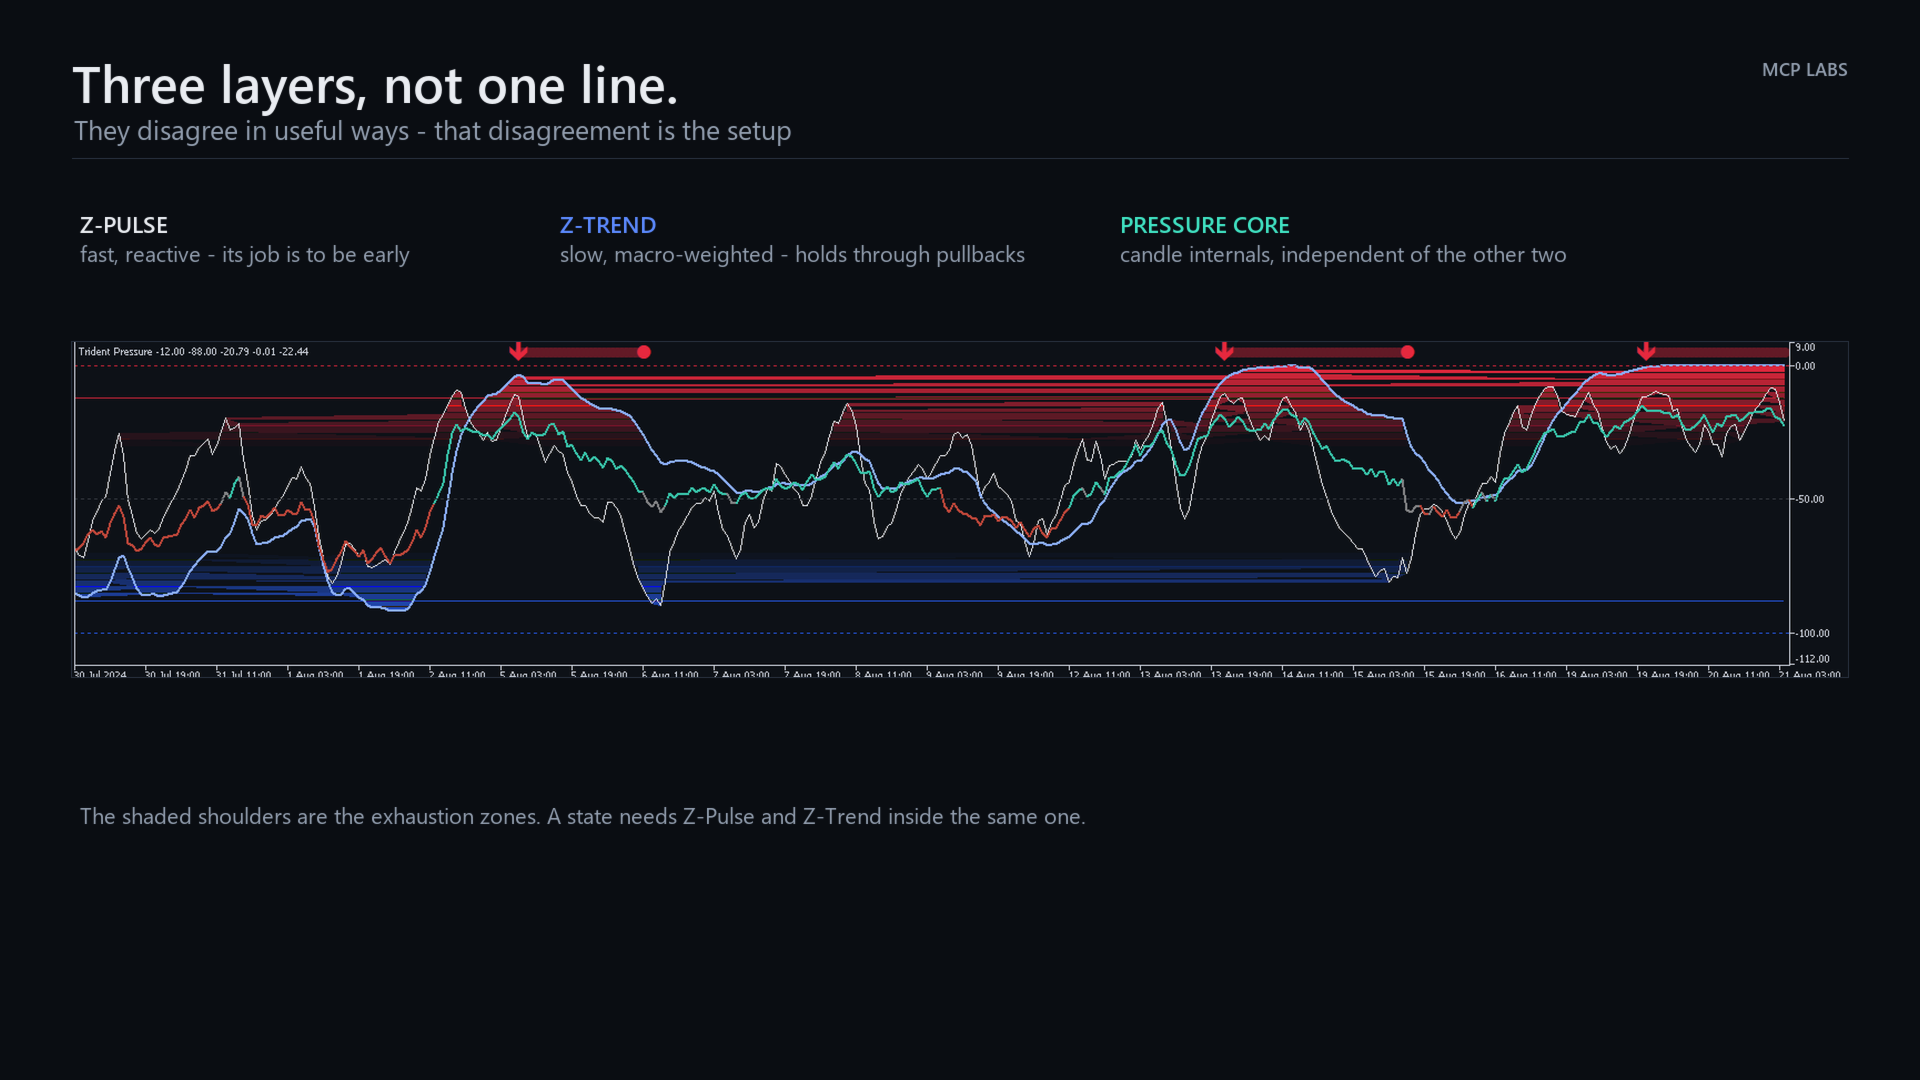
Three layers, read separately
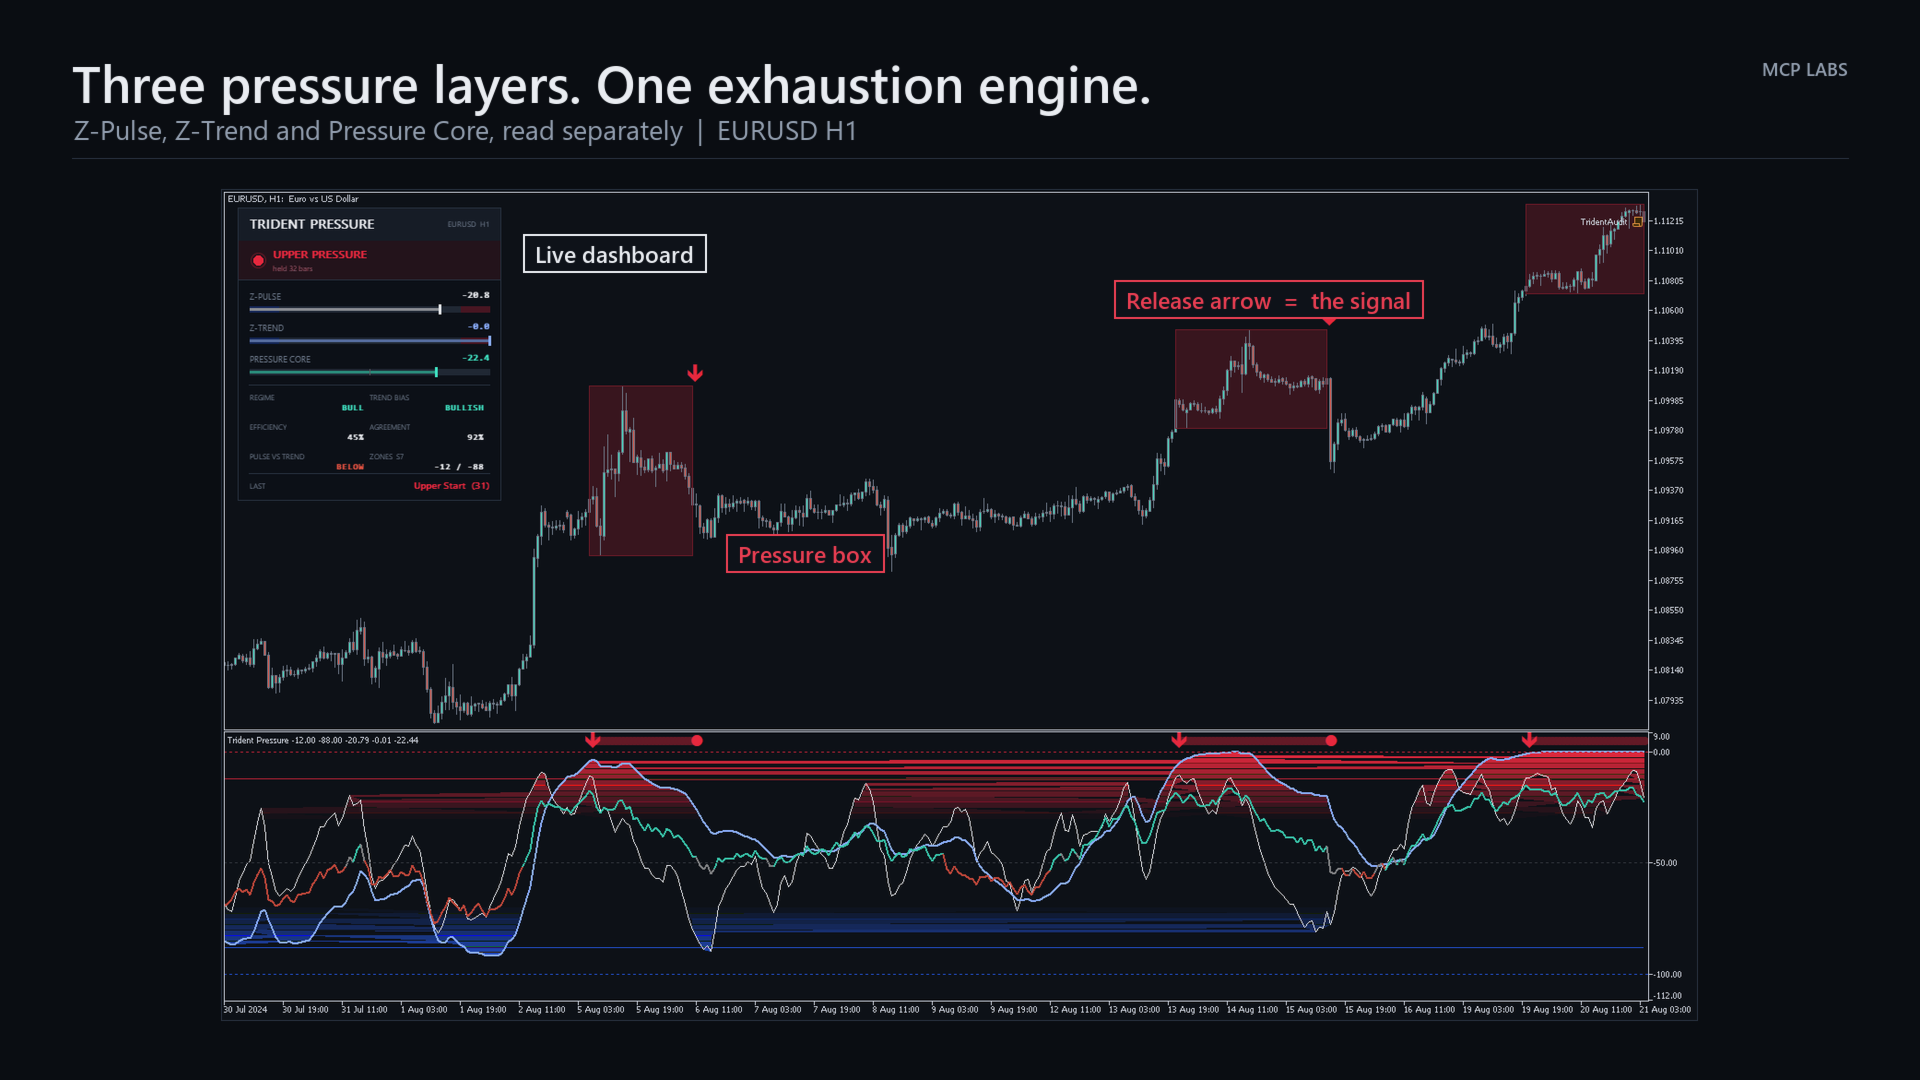
- Z-Pulse — fast, reactive range position. Moves with the current swing. Its job is to be early.
- Z-Trend — a macro-weighted blend of three range horizons. Slow on purpose. It resists counter-trend noise in proportion to how efficiently price is travelling and how closely the horizons agree, so it holds direction through pullbacks that throw Z-Pulse around.
- Pressure Core — an independent read on candle internals: where price closed in its range, where it spent its time, which way the body points, which wick dominates, and the recent impulse. Coloured bull, bear or neutral.
The exhaustion state machine
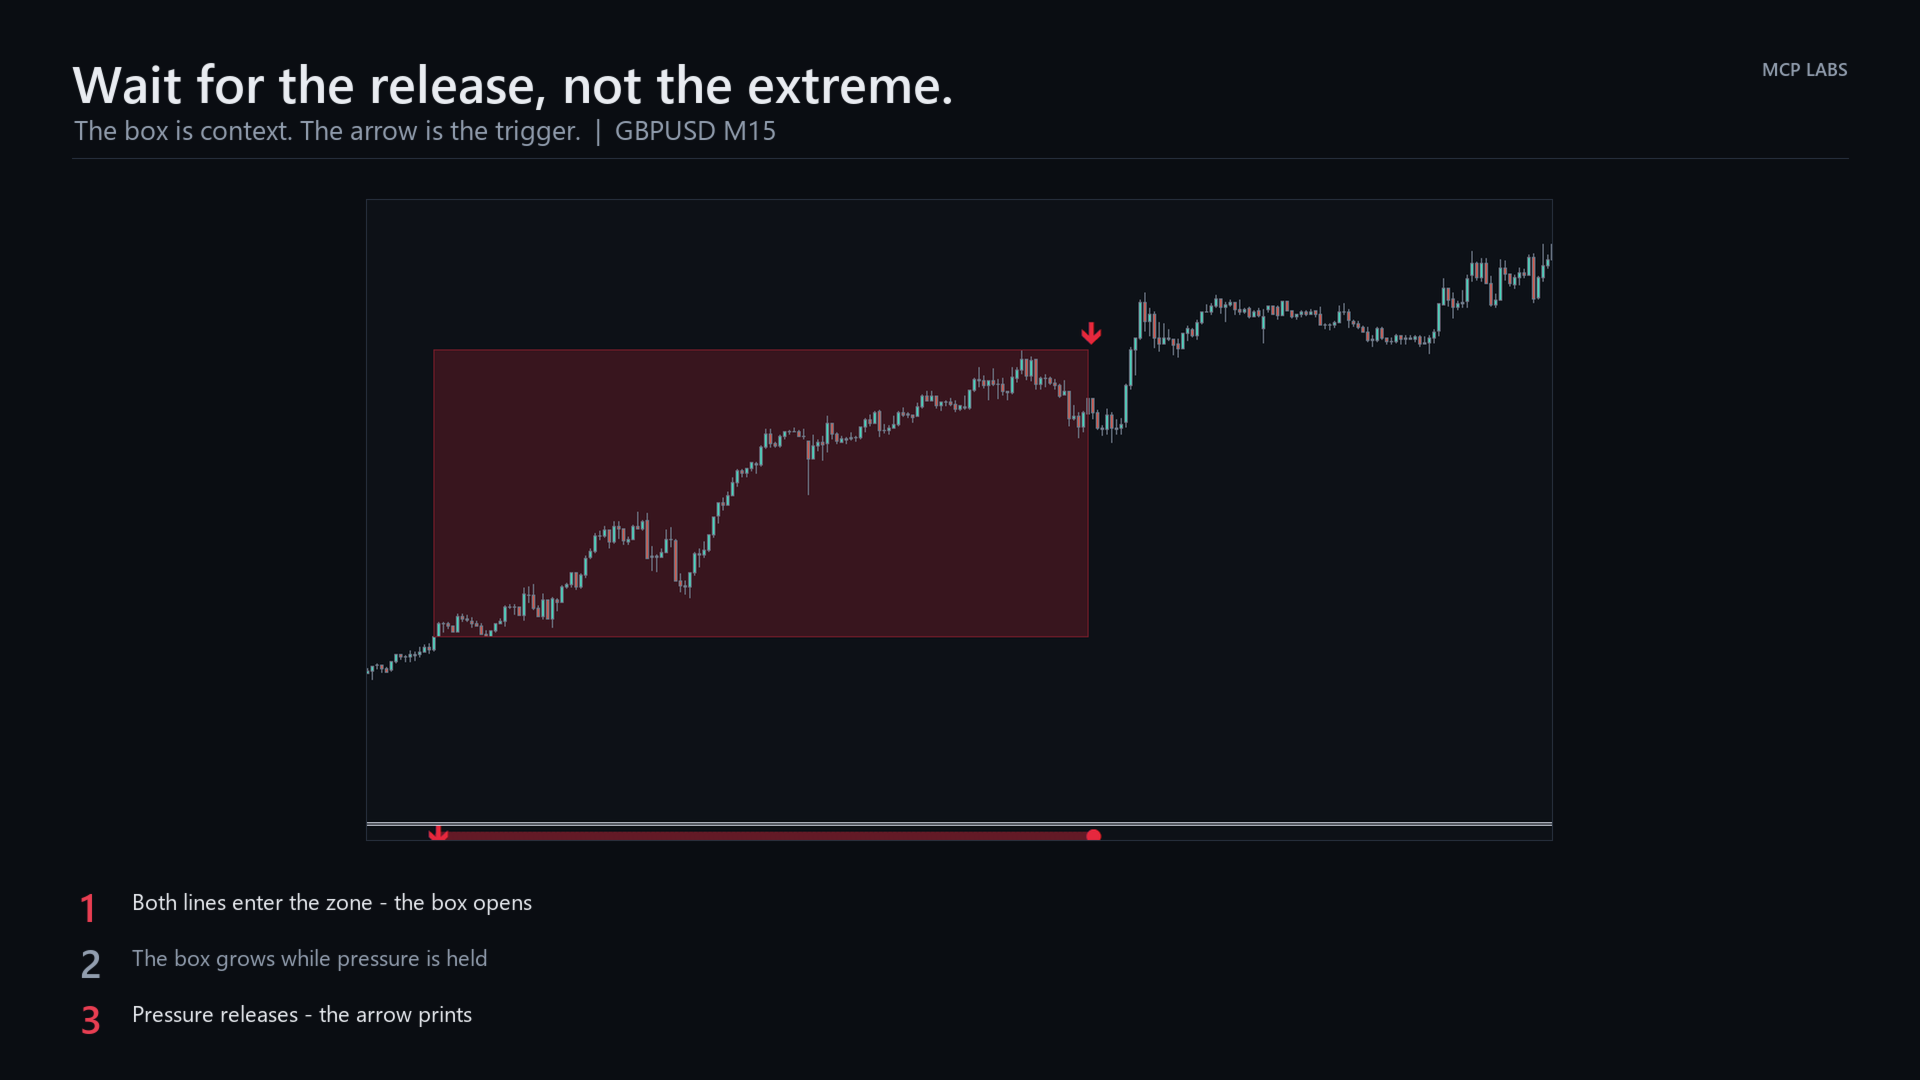
A pressure state opens only when Z-Pulse and Z-Trend are both inside the same extreme zone, and stay there for a confirmation period. It closes only when both have travelled back past a separate release level that sits further out than the entry level.
Entry and release thresholds are deliberately different. That gap is hysteresis, and it is why the state does not flicker on and off while price chops around a line.
What you see
- A box on your chart marking the price range carved out while pressure was on
- An arrow at the moment of release — this is the signal
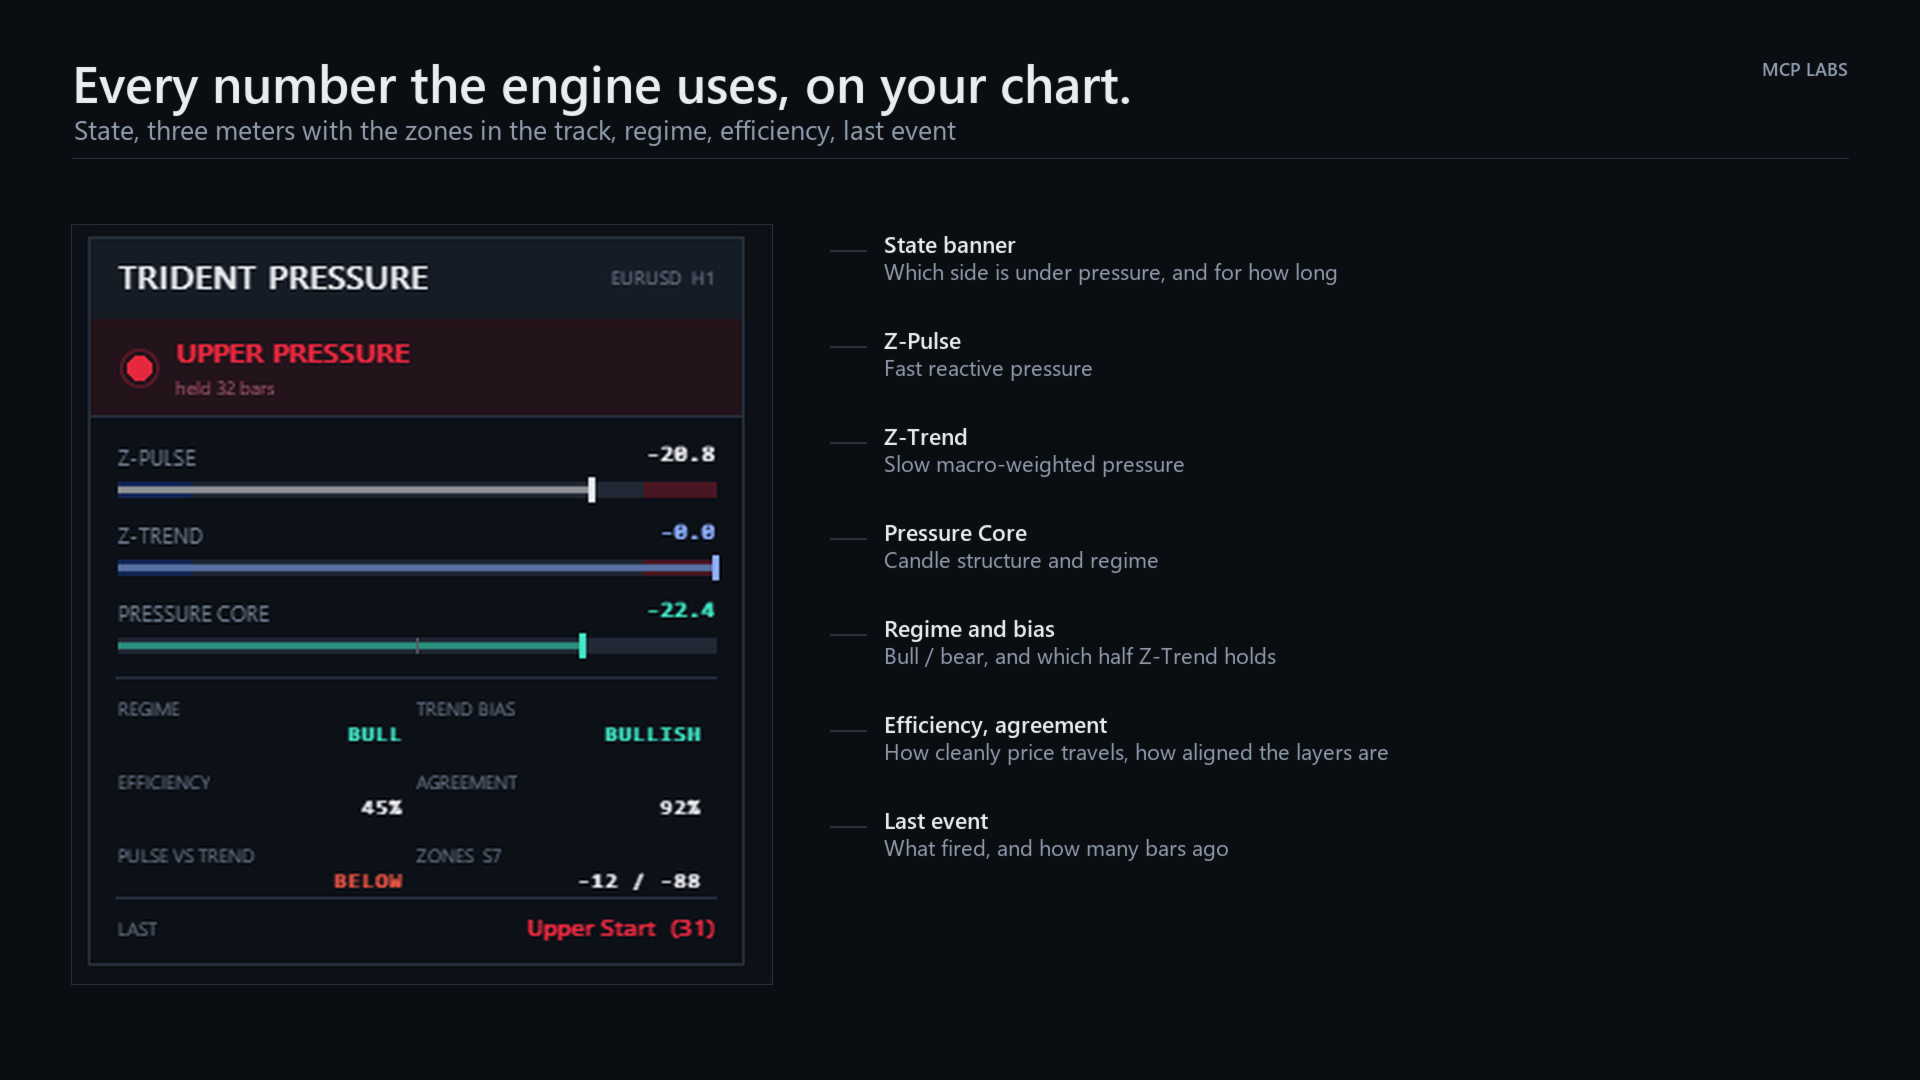
- A live dashboard: state, three meters with the zones drawn into the track, regime, trend bias, efficiency, layer agreement, and the last event
- A gradient-shaded oscillator pane showing all three layers at once
How to trade it
- Trend — Z-Trend holding the upper half with a bull-coloured Core favours longs. The mirror favours shorts.
- Continuation — in an established trend, Z-Pulse pulls back against it while Z-Trend and Core hold their direction, then turns back. The pullback is the entry, not the reversal.
- Reversal — a box forms and grows while pressure is on. Do not trade the box; while it is open, pressure is still being applied. Wait for the arrow.
The single most common way to misuse this tool is to sell a red box while it is still growing. A red box is not a sell signal. The red arrow is.
Settings
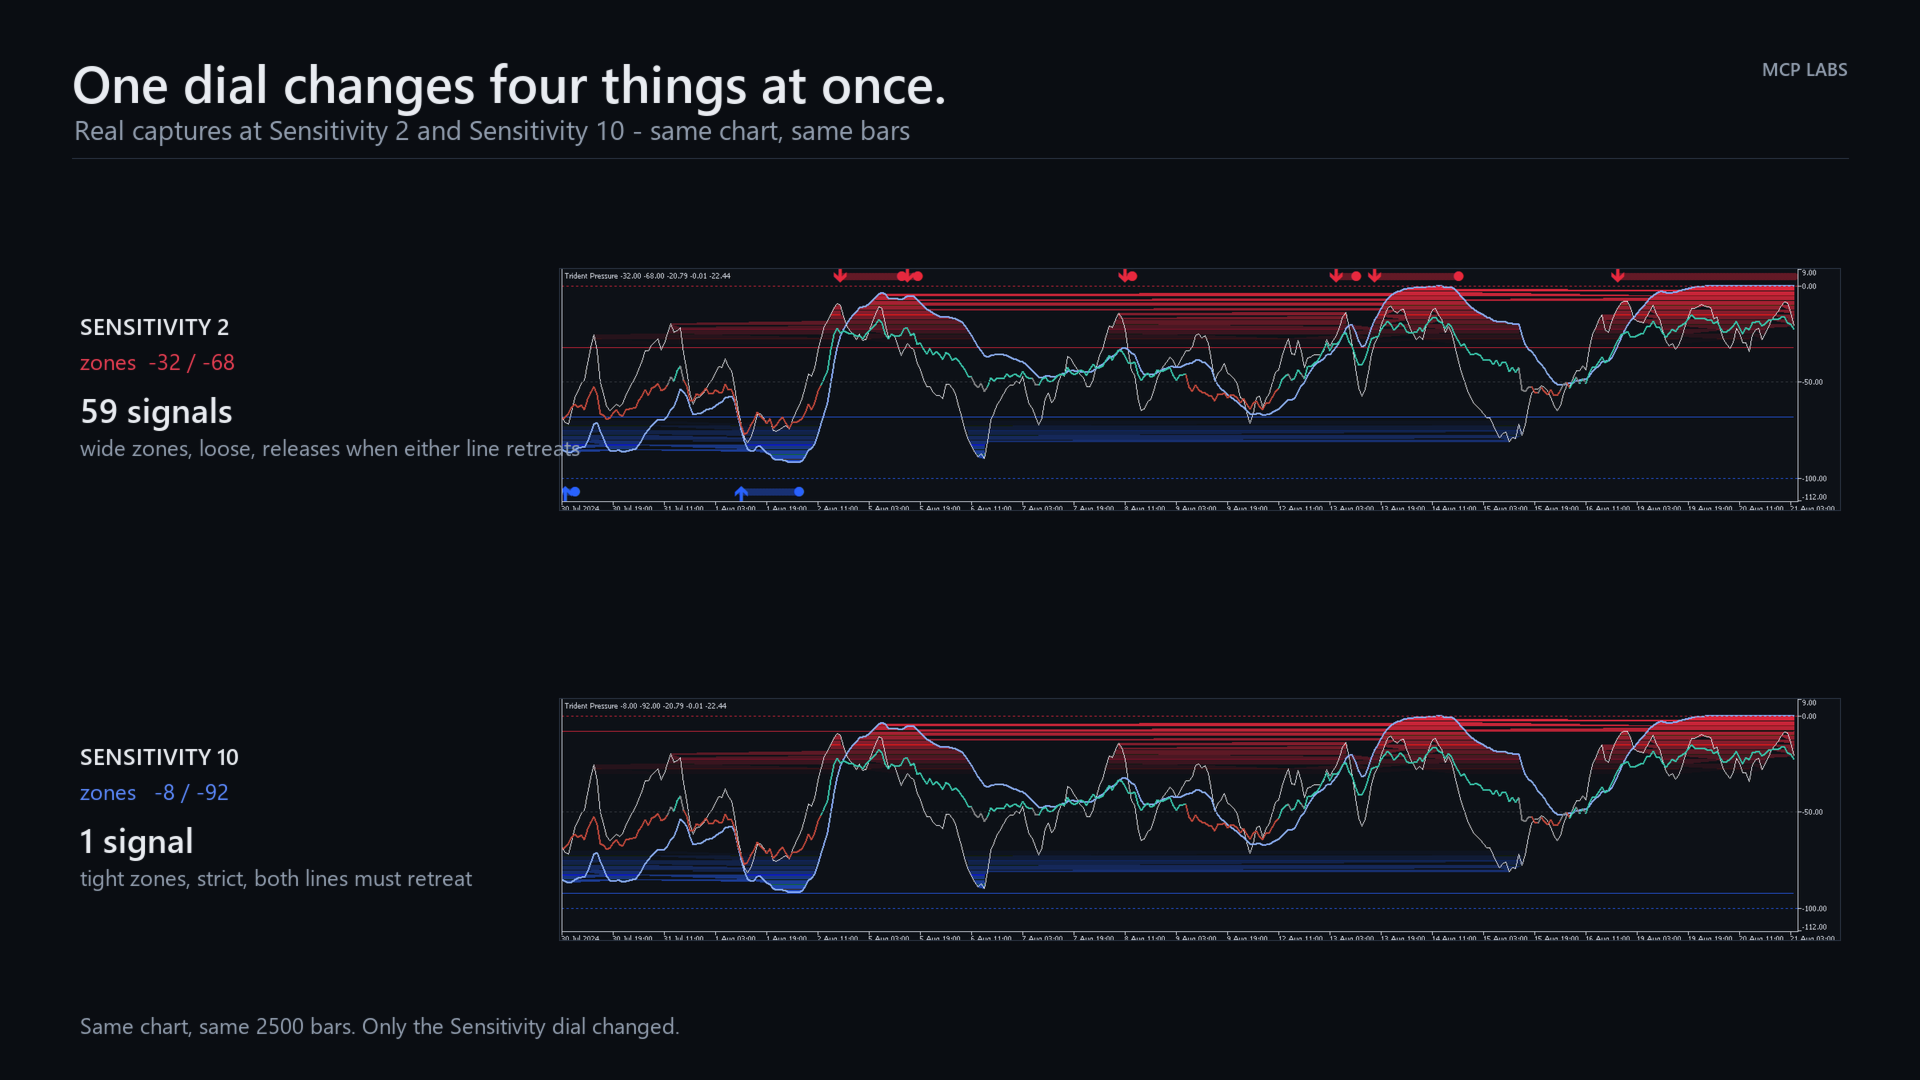
One dial does most of the work. Sensitivity is not a threshold — it moves four things together: where the zones sit, how far price must retreat to release, how many consecutive bars confirm an entry, and at its lowest settings whether release needs both lines to retreat or just one. 1 is loose and jumpy by design. 5 is balanced. 10 is strict and patient. Start at 7.
Everything else is exposed and documented across ten groups: three for the engine, plus colours, visibility, markers, dashboard, alerts and performance.
Alerts
Pressure release, pressure start, and Pulse/Trend crosses. Popup, push notification, email or sound, each independently switchable, with an option to signal only on closed bars.
Built properly
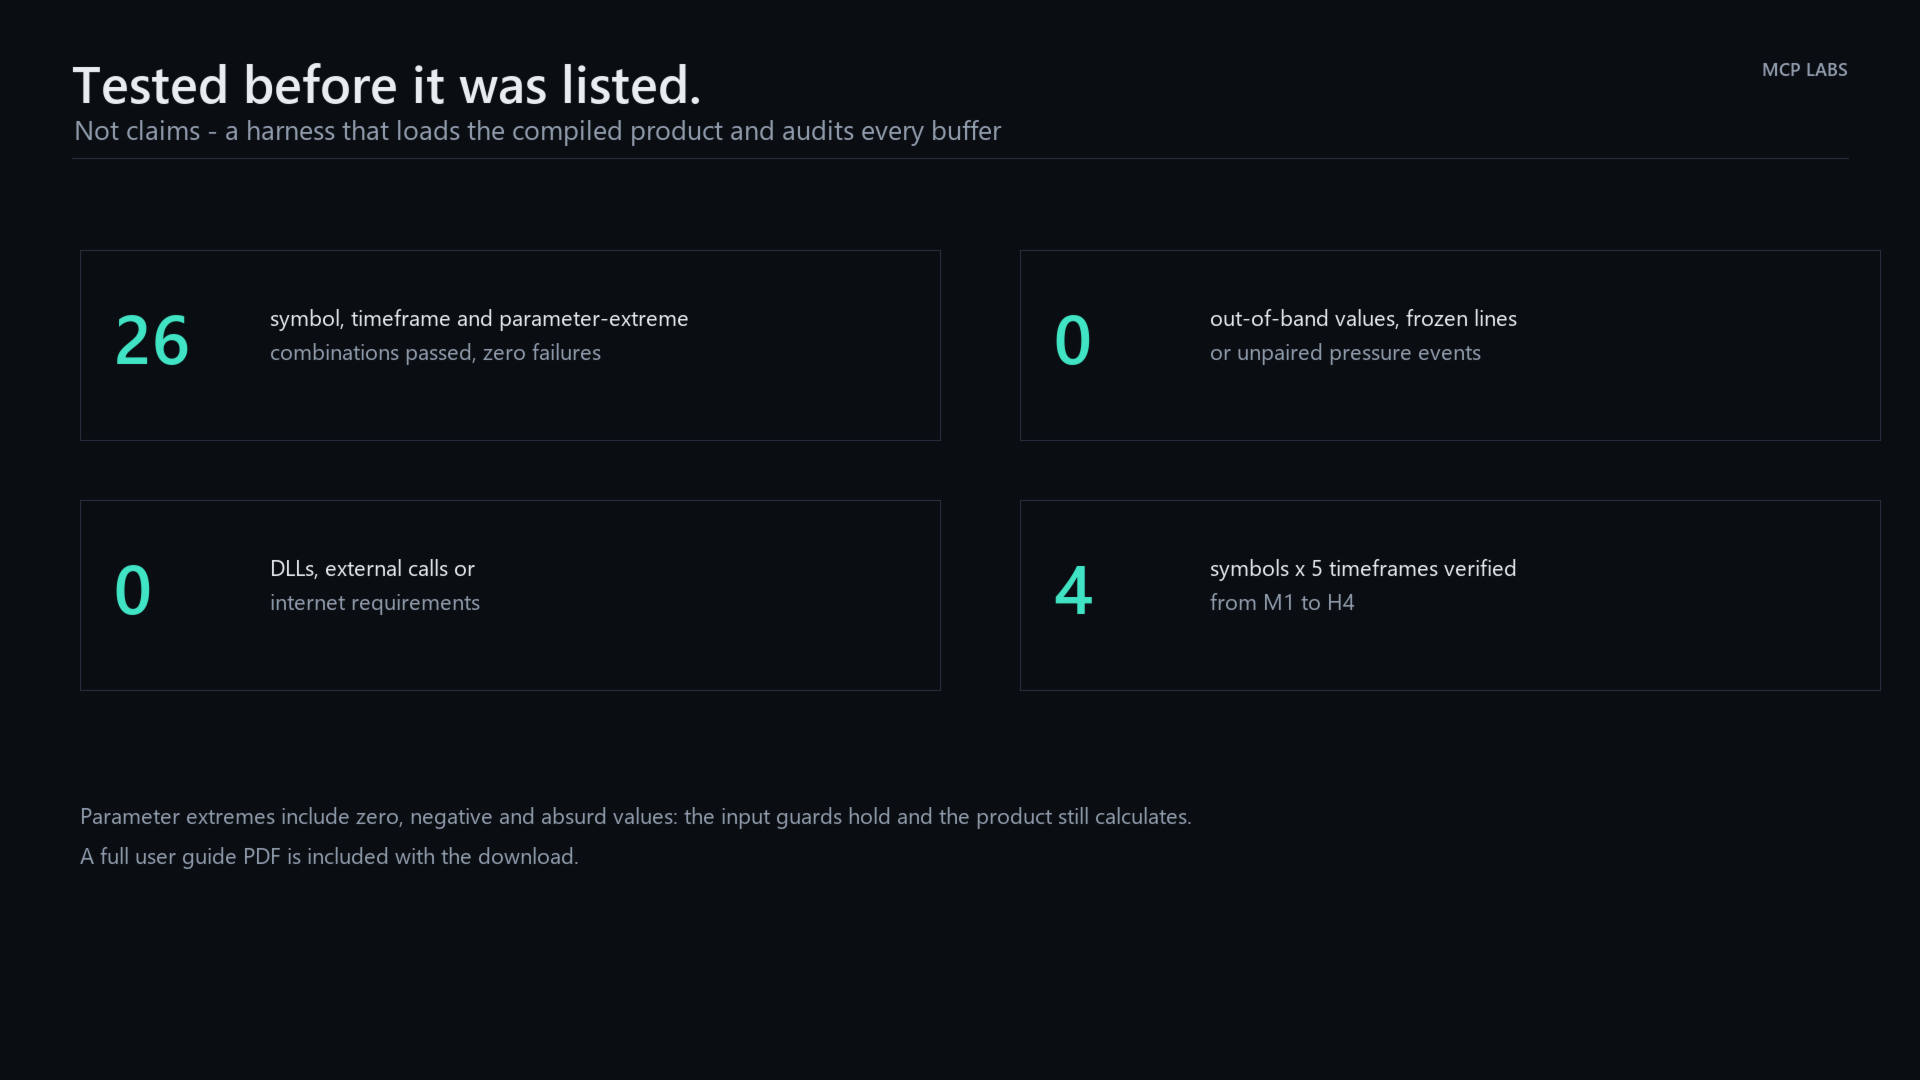
- Verified across 27 symbol, timeframe and parameter-extreme combinations with zero failures
- No DLLs, no external calls, no internet requirement
- Recursive state is held per bar, so re-running the live bar cannot drift
- Dashboard repaints on bar turn and state change, throttled otherwise
- Removes every object it creates when you take it off the chart
A full user guide PDF is included with the download.
Input parameters
1. Z-Pulse
- Pulse Range (21) — primary range window. Lower reacts faster to local range position.
- Pulse Stochastic (9) — stochastic window applied to the fast range reading. Lower is more reactive.
- Pulse Smoothing (7) — EMA smoothing of Z-Pulse. 1 leaves the pulse raw.
2. Z-Trend
- Trend Range (55) — medium horizon used to measure structural range position.
- Macro Trend (120) — long horizon. Carries the largest internal weight and gives Z-Trend its character.
- Trend Smoothing (5) — final smoothing. Higher is steadier.
- Trend Persistence (9.0) — how strongly repeated occupation of an outer zone pulls the line.
3. Pressure Exhaustion
- Exhaustion Zone (20) — base width of the upper and lower pressure zones.
- Sensitivity (7) — 1 to 10. Moves the zone, the release distance, the entry confirmation and, at 1 and 2 only, whether release needs both lines or just one. 1 is loose and jumpy by design; 10 is strict and patient.
- Pulse / Trend Crosses (off) — mark crossovers between the two lines.
4. Pressure Core
- Reactive Smoothing (16) — calms the reactive component.
- Regime Weight (0.65) — balance between the slow regime read and reactive pressure.
5. Colours and Style
- Cold / Hot — the two directional colours used throughout.
- Upper Level, Lower Level, Level Transparency — the pressure level lines.
- Z-Pulse, Z-Trend — line colours.
- Core Bull, Core Bear, Core Neutral, Core Width — Pressure Core styling.
- Gradient Fill (on) — fade the space between Z-Pulse and Z-Trend inside the pressure zones.
- Price Boxes (on) and max kept (60) — draw the exhaustion boxes on the chart, and how many to retain.
6. Visibility
- Show Z-Pulse, Show Z-Trend, Show Pressure Core, Show Pressure Levels, Show Pressure Markers — switch any layer off independently.
- Lock Pane Scale (on) — hold the pane at a fixed -112 to 9 so the geometry does not shift.
7. Markers
- Wingdings codes for the active/release dot (108), lower start (233) and upper start (234), plus Marker size. Change these to any glyph you prefer.
8. Dashboard
- Show Dashboard, Corner, X offset, Y offset — placement.
- Dashboard on main chart window — or put it in the indicator pane instead.
- Dashboard font and numeric font.
9. Alerts
- Terminal popup, Push notification, Email, Sound and Sound file — delivery.
- Only signal closed bars (on) — recommended. With it off a state can open and close inside one bar.
- Alert: pressure release (on), pressure start, Pulse / Trend cross — which events fire.
10. Engine
- Max bars to calculate (5000, 0 = all) — bound the history pass on very long charts.
Note
Trident Pressure is a measurement tool. It reads pressure and tells you when a pressure state has released. It does not predict, and it is not a trading system on its own. Test on a demo account until you understand how it behaves on the instruments and timeframes you actually trade. Trading carries risk of loss.