Volume Profile Auction Matrix

Volume Profile Auction Matrix

MetaTrader 5 机构级成交量分布图与锚定 VWAP 分析套件

大多数交易者仅仅依赖基于时间的 K 线进行分析。然而,市场的演变并不由时间决定,而是由双向拍卖机制驱动。当价格进入缺乏成交量的区域时,往往快速掠过;当大资金在某一价格充分换手时,市场便达成共识并形成价值中枢。

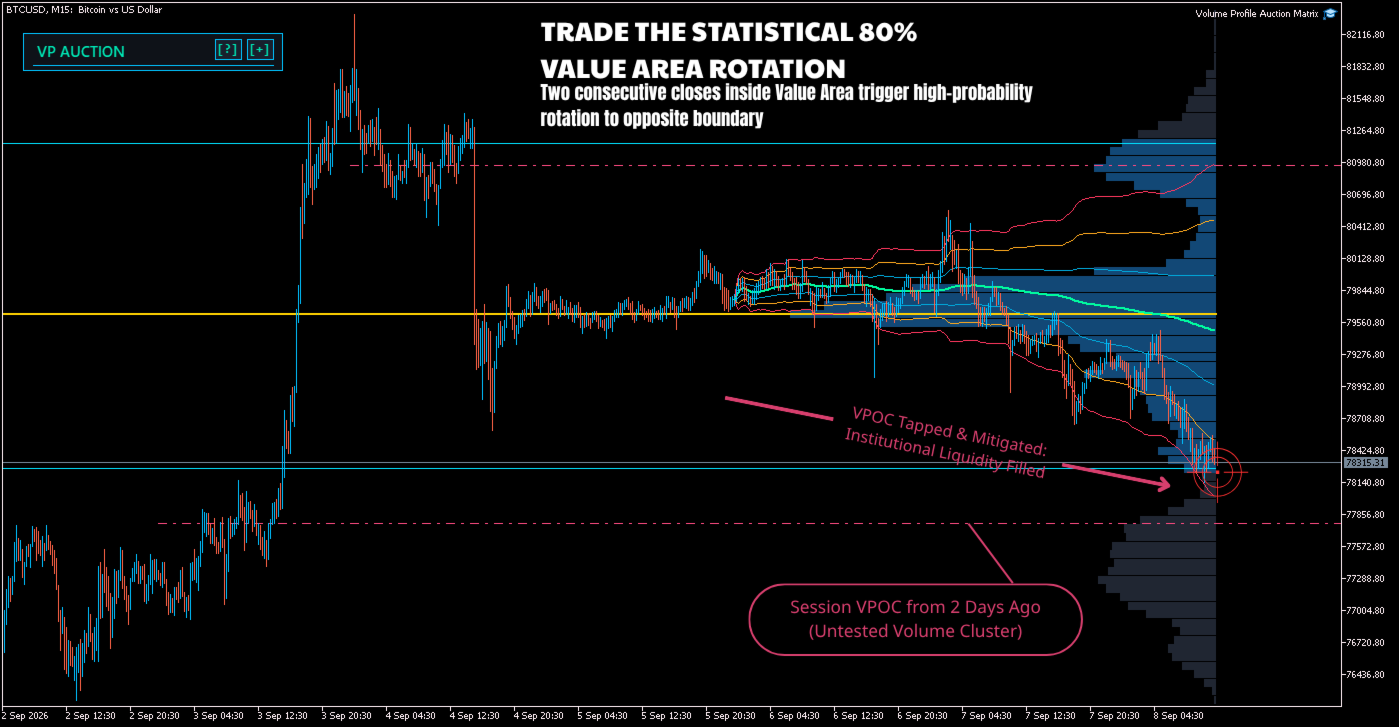
Volume Profile Auction Matrix 为 MetaTrader 5 带来专业的拍卖市场理论分析工具。它实时计算 Steidlmayer 成交量分布图、70% 价值区域(VAH 与 VAL)、控制点(POC)、未测试控制点射线(Virgin POC)以及带有高斯标准差离散通道的锚定 VWAP。全套界面基于 MT5 原生 CCanvas 画布开发,杜绝指标线穿透并支持一键交互。

核心拍卖理论概念

  • 价格是广告: 价格波动旨在发现潜在的买卖意愿,而成交量则是市场参与者接受或拒绝该价格的真实投票。
  • 控制点(POC): 所选周期内成交量最大的价格节点,代表当前市场各方公认的公平价值中枢。
  • 70% 价值区域(Value Area): 基于正态分布原理,约 70% 的成交量聚集在围绕 POC 的一个标准差范围内。价格在价值区内部运行表明市场均衡,突破价值区则预示趋势探索。
  • 80% 价值区轮动规则: 若价格突破价值区后未能延续,重新回到价值区内部并维持收盘至少两根 K 线,统计上有极大概率向价值区另一侧边界完成完整轮动。
  • 锚定 VWAP(Anchored VWAP): 机构基金与做市商通常以 VWAP 作为成交质量衡量基准。将 VWAP 锚定在重要开盘点、关键高低点或重要事件蜡烛,能够直观还原机构资金的实际持仓成本。

主要功能模块

1. 成交量分布图计算引擎

  • Steidlmayer 70% 算法: 定位 POC 并向上、向下成对累加成交量,精确划定价值区上限(VAH)与下限(VAL)。
  • 成交量模式支持: 外汇和差价合约(CFD)支持 Tick 成交量,期货、股票与加密货币支持真实成交量(Real Volume)。
  • 三种灵活分析模式:
    • 可见范围模式(VPVR): 在缩放、移动图表窗口时自动重算可视区域内的成交量。
    • 日内会话模式(Session): 自动锚定每日服务器时间 00:00 开盘,跟踪当日拍卖动态。
    • 固定范围模式(Fixed Range): 在图表上拖放起始与结束标记针,精准分析特定震荡箱体或单边脉冲。
  • 分布形态识别:
    • D 型分布: 对称分布,代表多空均衡与震荡洗盘。
    • P 型分布: 成交量集中在顶部,代表积极的主动买盘或空头回补。
    • b 型分布: 成交量集中在底部,代表积极的主动卖盘或多头平仓。
    • B 型分布: 双峰分布,存在两个被低成交量区域分隔开的独立价值区。

2. 多重锚定 VWAP 与波动率离散带

  • 锚定周期: 支持日线、周线、月线开盘锚定,主摆动高低点锚定,以及使用交互式图表图针锚定任意特定单根蜡烛(如非农数据、利率决议等)。
  • 波动率离散带: 基于累积成交量加权方差,实时投射 ±1.0σ、±2.0σ 及 ±3.0σ 统计轨道。
  • 性能采样优化: 针对长周期历史锚点启用自适应抽样渲染,保证图表操作丝滑流畅。

3. 未测试控制点(Virgin POC)磁吸追踪

  • 历史交易日未被回踩的 POC 通常作为强有力的流动性磁吸位。
  • 自动向右投射虚线水平射线,直至未来价格首次回踩并缓解该水平。
  • 一旦水平位被测试,系统自动清理射线,保持图表清晰整洁。

4. CCanvas 原生 HUD 控制面板

  • 基于 MetaTrader 5 底层 CCanvas 图形技术构建,图表趋势线、网格线和 K 线永远不会穿透面板。
  • 实时显示当前拍卖结构、POC/VAH/VAL 坐标、距 VWAP 的点数偏差与标准差倍数(Z-Score)以及战术建议。
  • 在图表上一键快速切换分布图模式、VWAP 锚点及通道开关,无需反复打开指标参数窗口。
  • 按住面板顶部标题栏可随心拖放至图表任意角落。
  • 计算时自动呈现半透明加载状态提示,提供直观的交互反馈。

5. 智能防抖报警系统

  • 针对 Virgin POC 首次回踩、80% 价值区轮动激活及价格触及 ±2.0σ/±3.0σ 极端区域触发预警。
  • 支持 MT5 弹窗通知、声音提示以及手机端 Push 推送。
  • 内置时间防抖过滤器,防止高频波动时警报轰炸。

实战交易设置

策略 1:价值区域 80% 轮动法则

当价格开在价值区外部但缺乏持续买卖动能,随后重新收回价值区内且收线确认两根 K 线,可顺势交易向 POC 及对侧价值区边界的完整回踩轮动。

策略 2:VWAP 极端离散均值回归

在均衡市场(D 型分布)中,价格触及外侧 2.0σ 或 3.0σ VWAP 通道通常代表统计学上的超买或超卖。结合价格反转蜡烛信号,寻找重回成交量加权均价的均值回归交易机会。

策略 3:未测试控制点(VPOC)回踩修复

遗留的大资金沉淀成本区在趋势日或深度回调行情中常以极高精度被触碰。可将 VPOC 水平作为高胜率的止盈目标位或逆势博弈的关键反应区。

参数配置表

参数分类 参数名称 默认值 说明
Auction Profile InpVPMode Visible Range 分布图范围:可见区域、日内会话或固定区间。
Auction Profile InpVolType Tick Volume 外汇/CFD 使用 Tick 成交量,期货/加密货币使用 Real 真实成交量。
Auction Profile InpTargetBins 80 分布图价格精度档位数(20 至 300)。
Auction Profile InpValueAreaPct 70.0% 价值区域所包含的总成交量百分比(68.2% 至 70.0%)。
Auction Profile InpTrackVirginPOCs true 开启历史未测试 POC 追踪与射线投射。
Anchored VWAP InpVWAPAnchorMode Daily Open VWAP 锚定基准:日线、周线、月线、波段高低点或自定义图钉。
Anchored VWAP InpShowVWAPBands true 开启标准差波动率通道显示。
Anchored VWAP InpBand1/2/3Multiplier 1.0, 2.0, 3.0 第 1、第 2、第 3 条标准差通道倍数。
Theme & HUD InpTheme Cyber Obsidian 界面主题:赛博黑曜石、彭博暗板岩或隐形单色。
Alert System InpAlertPopup / Sound / Push true / true / false 终端弹窗、声音提示与手机通知渠道配置。
About InpProfile 作者主页 访问开发者主页获取技术支持与后续版本更新。

适用市场与交易周期

  • 适用资产: 外汇主流与交叉盘(EURUSD, GBPUSD, USDJPY)、贵金属(XAUUSD, XAGUSD)、主要股指(US30, NAS100, DAX40)、原油(USOIL)及数字货币(BTCUSD, ETHUSD)。
  • 适用周期: 支持从 M1 到 D1 所有图表周期。日内高频多选用 M1、M5 和 M15,中长线波段分析建议使用 H1、H4 与 D1。
  • 交易类型: 全面兼容个人标准交易账户及各主流自营交易考核(Prop Firm)账户。

如需技术交流、配置协助或定制建议,欢迎通过 MQL5 社区私信留言。

推荐产品
Volume flow Profile
Israr Hussain Shah
大师版是一款专业级的分析工具,旨在通过成交量和资金流向的视角来可视化市场结构。与标准的成交量指标不同,该工具直接在图表上显示每日成交量分布,让您准确看到价格发现发生的位置以及“聪明钱”的定位。 此大师版专为清晰度和速度而设计,具有独特的自动主题同步系统,加载后即刻美化您的图表布局。 主要特点: 真实资金流向计算: 超越标准的跳动量。启用“Use Money Flow”时,成交量按价格加权,揭示了特定价格水平的实际资金投入。 价值区域 (VA) 可视化: 自动计算价值区域(默认为成交量的70%)。 VA填充: 为价值区域背景着色,以便即时识别控制区域。 关键水平: 清晰标记控制点 (POC)、价值区域高点 (VAH) 和价值区域低点 (VAL)。 专业标记系统: 扫描概况结构以识别关键交易区域: HVN (高成交量节点): 接受和盘整区域(支撑/阻力)。 LVN (低成交量节点): 拒绝区域或“快速通过”区域。 所有标记均向右绘制延长线,便于监控。 Delta 背离(左侧直方图): 左侧直方图可视化每个级别的买卖压力对比。这有助于识别隐藏的背离——即价格可能上涨,但卖家在这些水平上激进打
Boom Crash SMC
Israr Hussain Shah
Here   our more valuable tools SMC Trend Trading   ,  Easy SMC Trading  ,  Institutional SMC Architect Volume Analysis Tools  ,  Volume flow Profile  ,  Market volume profile  , FVG with Volume  , Liquidity Heatmap Profile  ,  Volume Spread Analysis Deriv boom and crash index spike killer system you can use it only on m5 timeframe  follow the structure and get signal with alert on phone open trade set sl tp and enjoy easy analysis and trading made simple 
Session Volume Heatmap
Dang Tam Tran
5 (1)
Volume Profile FREE — Multi-Session Heatmap (POC · VAH · VAL) See where trading activity actually occurs—not just where price moves. This indicator builds a clear, color-coded Volume Profile Heatmap directly on your chart and highlights the market's most important price levels: the Point of Control (POC) and the Value Area (VAH/VAL) , where price is most likely to react.
FREE
Liquidity HeatMap Profile
Israr Hussain Shah
5 (1)
Here   our more valuable tools SMC Trend Trading   ,  Easy SMC Trading  ,  Institutional SMC Architect Volume Analysis Tools  ,  Volume flow Profile  ,  Market volume profile  , FVG with Volume  , Liquidity Heatmap Profile  ,  Volume Spread Analysis 2. Key Features Dynamic Filtering : The core feature. As soon as the current price crosses a historical liquidity level, that level disappears. This reduces chart clutter and prevents you from trading off "dead" support/resistance. Liquidity Heatma
Here   our more valuable tools SMC Trend Trading   ,  Easy SMC Trading  ,  Institutional SMC Architect Volume Analysis Tools  ,  Volume flow Profile  ,  Market volume profile  , FVG with Volume  , Liquidity Heatmap Profile  ,  Volume Spread Analysis Short Description: Stop overloading your charts with dozens of indicators.   Bollinger Fibo  Pro   is a sophisticated, all-in-one trading system for MetaTrader 5 that merges two legendary concepts into a single, powerful tool. It enhances standard
Deriv Boom and crash
Israr Hussain Shah
Here   our more valuable tools SMC Trend Trading   ,  Easy SMC Trading  ,  Institutional SMC Architect Volume Analysis Tools  ,  Volume flow Profile  ,  Market volume profile  , FVG with Volume  , Liquidity Heatmap Profile  ,  Volume Spread Analysis Boom: Take SELL signals only (price spikes up then crashes) Crash: Take BUY signals only (price drops then spikes up) SL goes beyond the line as labeled Interactive Market Watch Panel : A left-side sidebar showing real-time strength indicators (po
Haven Volume Profile
Maksim Tarutin
4.62 (13)
Haven Volume Profile 是一个多功能的成交量剖面分析指标,帮助基于交易量分布识别关键价格水平。它旨在为专业交易者提供更深入的市场理解,并帮助识别重要的进出场点。 其他产品 ->  这里 主要功能: Point of Control (POC) 计算 - 最大交易活动水平,帮助识别最具流动性的水平 Value Area 定义(增加活动区)和可自定义的成交量百分比,帮助更准确地评估交易区间 支持tick成交量和实际成交量,适用于不同市场类型和交易策略 灵活的计算周期设置(天数),使工具能够适应任何时间范围 自动适应浅色和深色终端主题,提升用户界面的可视体验 清晰的水平可视化,支持自定义样式和颜色,便于图表分析和快速决策 该指标非常适合识别重要的价格水平和整合区,帮助交易者做出更加明智的交易决策。使用 Haven Volume Profile 有助于通过更准确的成交量和市场动态分析来降低风险并增加利润。
FREE
MR Volume Profile 5
Sergey Khramchenkov
The "MR Volume Profile 5" indicator is a charting tool that displays trading volume at different price levels rather than time intervals. A key concept in volume profile is the point of control (POC)—the price level with the highest volume traded during the session or time range. While tools like VWAP or OBV provide volume trends, the "MR Volume Profile 5" indicator offers granular detail about where the most market activity occurs at specific price levels. This makes it a more precise tool for
Market Profile Heat indicator  — is a classic Market Profile implementation that can show the price density over time, outlining the most important price levels, value area, and control value of a given trading session. This indicator can be attached to timeframes between M1 and D1 and will show the Market Profile for daily, weekly, monthly, or even intraday sessions. Lower timeframes offer higher precision. Higher timeframes are recommended for better visibility. It is also possible to use a fr
VP hidden
Emr Aljnaby
4.33 (12)
The indicator works to convert normal volume into levels and determine financial liquidity control points. It is very similar in function to Fixed Volume Profile. But it is considered more accurate and easier to use than the one found on Trading View because it calculates the full trading volumes in each candle and in all the brokers present in MetaTrade, unlike what is found in Trading View, as it only measures the broker’s displayed prices. To follow us on social media platforms: telegram
FREE
Volume Profile Density v2
Vincent Jose Proenca
Volume Profile Density V2.40 显示按价格水平分布的成交量,揭示机构交易兴趣区域。 不同于按时间统计的传统成交量,它展示成交量真正集中的位置。 主要概念: 水平条 = 各价格成交量 条越长 → 成交量越大 红色区域 = 关键支撑/阻力 主要用途: 识别真实支撑与阻力 确定 POC (控制点) 定义 价值区域 (占总量的70%) 低成交量区用于止损或目标 颜色说明: 蓝色 = 低成交量(快速通过区) 黄色 = 中等成交量(平衡区) 红色 = 高成交量(机构活动区) 交易策略: 红区反弹买入 红区或VAH受阻卖出 POC突破配合成交量进场 回测POC时入场 目标设在蓝区 参数设置: 初学者:1.0 / 100% / 1.0 短线交易:0.5 / 200% / 0.5 波段交易:2.0 / 50% / 1.5 技术信息: 版本:2.40 平台:MT5 品种:外汇、CFD、贵金属、加密货币 时间周期:M1–M15 类型:实时自适应指标 总结: 成交量不会说谎——顺应成交量区域交易,而不是逆势而行。
FREE
Volume Profile Trading System
Abdeljalil El Kedmiri
5 (1)
Volume Profile Trading System is NOT just another volume indicator. It's a   complete trading ecosystem   that combines professional volume profile visualization with an intelligent automated trading strategy.  While other indicators show you   WHERE   volume is concentrated, Volume Profile Trading System  shows you   WHERE ,   WHEN , and   HOW   to trade it! displaying real volume distribution by price instead of time. It helps traders identify fair value zones, institutional activity, and high
VOLUME PROFILE SAF-XII 专业级 MT5 市场轮廓(成交量概况)分析仪 —— 网格交易者的梦幻指标 什么是成交量概况 (Volume Profile)? 成交量概况是一种专业的机构级工具。与传统的随时间显示成交量的指标不同,它显示的是 特定价格水平 上的交易活动。它揭示了交易发生在 哪里 ,帮助您识别: 价值区 (VAH/VAL) :大部分交易发生的价格区间。 控制点 (POC) :成交量最高的核心价格水平。 流动性失衡 :每个层级的多空主导力量对比。 支撑/阻力 :基于实际交易活动形成的天然价格位。 三种操作模式 —— 真正的“设置后即忘” VP_MANUAL(波段交易与关键位分析) 用户通过拖动垂直线自定义分析范围。 仅在移动线条时重新计算。 适用场景 :新闻前夕分析、财报发布、特定日期范围。 VP_AUTO(头寸与动量交易) 随新柱线自动向后滚动。 使用自定义回溯周期(默认 100 根柱线)。 适用场景 :动量策略、突破交易。 VP_SESSION(日内交易与机构流向) 锚定逻辑交易时段(伦敦、纽约、亚洲盘开盘)。 适用场景 :日内交易、基于时段的机构化策略
Blahtech Supply Demand MT5
Blahtech Limited
4.54 (13)
Was: $299  Now: $99  Supply Demand uses previous price action to identify potential imbalances between buyers and sellers. The key is to identify the better odds zones, not just the untouched ones. Blahtech Supply Demand indicator delivers functionality previously unavailable on any trading platform. This 4-in-1 indicator not only highlights the higher probability zones using a multi-criteria strength engine, but also combines it with multi-timeframe trend analysis, previously confirmed swings a
Tick Profile Free
Elia Burstein
5 (3)
This indicator will show a vertical representation of the volume distribution within a selected user range. This is a free version of the full product. It is limited to use on a week old data or older. Find the full product at  https://www.mql5.com/en/market/product/42234 . Main features: This Indicator will create an image that will allow viewing the tick volume per price level in a graphical form. The indicator will work on any range size in any time-frame, limited only by your computer mem
FREE
AntaresX Volume Profile — Indicator for MetaTrader 5 AntaresX Volume Profile is an indicator that displays the price levels where the highest trading activity was concentrated during a selected period, and calculates the historical probability of the price reacting when it reaches each of those levels. What the indicator draws The indicator identifies three levels on the chart: POC (Point of Control): the price where the highest trading activity was recorded during the selected period. Displaye
FREE
Simple QM Pattern MT5
Suvashish Halder
3.33 (3)
Simple QM Pattern   is a powerful and intuitive trading indicator designed to simplify the identification of the Quasimodo (QM) trading pattern. The QM pattern is widely recognized among traders for effectively signaling potential   reversals   by highlighting key market structures and price action formations. This indicator helps traders easily visualize the QM pattern directly on their charts, making it straightforward even for those who are new to pattern trading. Simple QM Pattern includes d
FREE
BoxProfile MT5
Evgeny Shevtsov
4.6 (10)
The indicator displays volume profiles based on the nesting principle. Profiles periods are pre-set so that each subsequent profile has a length twice as long as the length of the previous profile. In addition to profiles, the indicator displays volume clusters sorted by color, depending on the volume they contain. Indicator operation features The indicator works on typical timeframes from M5 to MN, but for calculations uses historical data from smaller timeframes: M1 - for timeframes from M5
FREE
Value Chart Candlesticks
Flavio Javier Jarabeck
4.57 (14)
The idea of a Value Chart indicator was presented in the very good book I read back in 2020 , " Dynamic Trading Indicators: Winning with Value Charts and Price Action Profile ", from the authors Mark Helweg and David Stendahl. The idea is simple and the result is pure genius: Present candlestick Price analysis in a detrended way! HOW TO READ THIS INDICATOR Look for Overbought and Oversold levels. Of course, you will need to test the settings a lot to find the "correct" one for your approach. It
FREE
该指标建立当前报价,可以与历史报价进行比较,并在此基础上进行价格走势预测。指示器有一个文本字段,用于快速导航到所需日期。 选项: 符号 - 选择指标将显示的符号; SymbolPeriod - 选择指标从中获取数据的时段; IndicatorColor - 指示器颜色; HorisontalShift - 由指标绘制的报价移动指定的柱数; Inverse - true 反转引号,false - 原始视图; ChartVerticalShiftStep - 图表垂直移动(键盘上的向上/向下箭头); 接下来是文本字段的设置,您可以在其中输入日期,您可以通过按“回车”立即跳转到该日期。 接下来是文本字段的设置,您可以在其中输入日期,您可以通过按“回车”立即跳转到该日期。
Global Market Sessions – Visual Analyzer for MT5 A lightweight MT5 indicator that visually maps Tokyo, London and New York sessions, auto-detects broker timezone & DST, and highlights the best liquidity windows for smarter trading. See the market’s rhythm at a glance. Trade with clarity, precision, and confidence. Overview Global Market Sessions is a powerful yet easy-to-use MT5 indicator that visually displays the world’s major trading sessions (Tokyo, London, New York) directly on your chart
FREE
Last Swing Volume Profile
Charles Mwangi Ndungu
SWING VOLUME PROFILE Swing-Based Volume Profile + Fibonacci + RSI -------------------------------------------------- Auto-detected swings. Volume profile. Fibonacci. RSI. All-in-one. -------------------------------------------------- WHAT THIS INDICATOR DOES Swing Volume Profile (SVP) automatically detects structural swings and displays a volume profile for the most recent completed swing — with Fibonacci retracement and RSI overlay. No manual range selection needed. The indicator finds
Mirror Chart MT5
Andrej Hermann
5 (1)
The Mirror Chart MT5 is a overlay indicator specifically designed to project a second financial instrument directly onto the main chart window. This tool is invaluable for traders who rely on correlation analysis, as it visualizes the price movements of two different instruments in real time. Unlike traditional overlays, this indicator utilizes intelligent, dynamic centering and scaling logic. It continuously analyzes the visible price range in the current window for both symbols and calculates
FREE
Build a clear POC and value area from the chart range you choose. BrioQuant Range Volume Profile maps the selected MT5 volume feed across price and marks the POC, VAH and VAL. Profile the visible chart, a draggable fixed range, today or the latest number of bars, with configurable value-area shading and labels. Features: Modes: Visible Range, Fixed Range (drag two handles on the chart), Today, Last N Bars POC, configurable value-area percent, VA shading, price labels Instance tag lets two copies
FREE
Spike Blast Pro
Israr Hussain Shah
Here   our more valuable tools SMC Trend Trading   ,  Easy SMC Trading  ,  Institutional SMC Architect Volume Analysis Tools  ,  Volume flow Profile  ,  Market volume profile  , FVG with Volume  , Liquidity Heatmap Profile  ,  Volume Spread Analysis Spike Blaster Pro is a next-generation MT5 indicator designed specifically for synthetic markets. It works seamlessly on Boom Index and Weltrade Index , providing traders with sharp, reliable spike detection signals. What makes Spike Blaster Pro po
VisualVol EURUSD
Maxim Kuznetsov
The indicator highlights the points that a professional trader sees in ordinary indicators. VisualVol visually displays different volatility indicators on a single scale and a common align. Highlights the excess of volume indicators in color. At the same time, Tick and Real Volume, Actual range, ATR, candle size and return (open-close difference) can be displayed. Thanks to VisualVol, you will see the market periods and the right time for different trading operations. This version is intended f
FREE
Delta Profile Volume
Teresinha Moraes Correia
指标技术说明 – Delta Profile for MetaTrader 5 Delta Profile 是为 MetaTrader 5 开发的一款指标,用于在指定的 K 线区间内对成交量流进行详细分析。它能够在不同的价格水平上对正向成交量(与上涨相关)和负向成交量(与下跌相关)的不平衡进行结构化和可视化展示。最终,用户可以清晰地识别图表中成交最为集中的区域,以及真实的市场不平衡形成的位置。 以下是该指标的主要技术特征与参数说明。 核心概念 指标会识别 价格水平 ,并将其分类为正向成交量、负向成交量,以及净 Delta(正负成交量的差值)。 每个价格水平会在图表中以 水平条形 显示,帮助用户直观观察市场活跃区和不平衡区域。 用户可自由控制 分析的 K 线数量 、 价格精度(小数位数) 、 显示的最大水平数量 以及 可视化样式 。 主要功能 价格水平映射 :根据设定的精度对价格进行四舍五入,并累计对应 K 线的成交量。 净 Delta 计算 :显示正负成交量的差值,提供每个价格区间的客观数值。 最强 Delta 水平突出显示 :自动识别 Delta 绝对值最大的价格水平,并用特殊颜色标
BoxChart MT5
Evgeny Shevtsov
5 (7)
The market is unfair if only because 10% of participants manage 90% of funds. An ordinary trader has slim changes to stand against these "vultures". This problem can be solved. You just need to be among these 10%, learn to predict their intentions and move with them. Volume is the only preemptive factor that faultlessly works on any timeframe and symbol. First, the volume appears and is accumulated, and only then the price moves. The price moves from one volume to another. Areas of volume accumu
Breakout Boxes with Volume Pressure This indicator automates the identification of key consolidation zones (Supply and Demand) based on Market Pivots and Volatility (ATR). Unlike standard support/resistance tools, this indicator provides a unique   Volume Pressure Analysis   inside every box, giving you insight into the battle between Buyers and Sellers before a breakout occurs. Key Features Automated Supply & Demand Zones:   Automatically detects significant Pivot Highs and Lows to draw dyna
Here   our more valuable tools SMC Trend Trading   ,  Easy SMC Trading  ,  Institutional SMC Architect Volume Analysis Tools  ,  Volume flow Profile  ,  Market volume profile  , FVG with Volume  , Liquidity Heatmap Profile  ,  Volume Spread Analysis The    Liquidity Heatmap   is a sophisticated institutional trading tool designed to reveal where over-leveraged traders are trapped. By calculating estimated liquidation levels based on volume spikes and leverage, this indicator draws a dynamic "h
该产品的买家也购买
Farmed Hedge Yield Farming | All Markets (Manual - Hybrid - Semi/Automated EA) VERIFIED TRADING RESULTS - Farmed Hedge Yield Axi Copy:  https://www.mql5.com/en/signals/2356376 - Farmed Hedge Yield Exn Copy:   https://www.mql5.com/en/signals/2356404 - Farmed Hedge Yield V Copy:  https://www.mql5.com/en/signals/2357156 IMPORTANT NOTICE: FarmedHedge is a MANUAL-FOCUSED TRADING UTILITY ,not a fully automated EA. Results shown on this Signal include manual trades and overall strategic management.
AI Agent Supervisor is NOT an Expert Advisor. AI Agent Supervisor   is a   multi-agent AI risk & portfolio supervisor   that watches every EA on your account and intervenes in real time.  WANT AN AI PORTFOLIO MANAGER WATCHING YOUR FLEET 24/7?   Run your fleet on the same brokers I do:   IC MARKETS , IC TRADING   .  Unlike the centralized stock market, Forex has no single, unified price feed.  Every broker sources liquidity from different providers, creating unique data streams. The Supervisor r
YuClusters
Yury Kulikov
4.93 (43)
Attention: You can view the program operation in the free version  YuClusters DEMO .  YuClusters is a professional market analysis system. The trader has unique opportunities to analyze the flow of orders, trade volumes, price movements using various charts, profiles, indicators, and graphical objects. YuClusters operates on data based on Time&Sales or ticks information, depending on what is available in the quotes of a financial instrument. YuClusters allows you to build graphs by combining da
Copy your MT5 trades to Interactive Brokers You keep using MT5. Every order you open or close is sent to your IB account. In real time. No coding. No changes to your strategy or EA. Try it first Rent 1 month: $30. Test on a live or paper account. What it does Real-time copying: same direction, reverse, or one side only. Map any MT5 symbol to any IB symbol. Set a lot ratio for each. Forex, Futures, Stocks, CFDs, Metals and Crypto. Position sync: both accounts checked, any difference fixed. Optio
FUTURES ORDERFLOW FOOTPRINT CHART Professional OrderFlow EA for MetaTrader 5 Version 1.01| Professional tool for real traders | Institutional-Grade Visualization STRATEGY TESTER USERS - PLEASE SELECT EVERY REAL TICK WHEN TESTING AND YOU HAVE DOWNLOADED HISTORICAL DATA. IF YOU SEE A WAITING SCREEN AND IT IS NOT DOWNLOADING, IT MEANS YOU HAVE LOW HISTORICAL DATA. TRY 1 MIN AND 5 MIN FIRST ON 1 DAY DATA. ONE DAY DATA SHOULD BE THE NEWEST AND MOST CURRENT DATE. PLEASE WAIT UNTIL THE MARKET HAS ROL
Quant AI Agents
Ho Tuan Thang
5 (1)
Quant AI Agents are independent trading Expert Advisors. Instead of trading using a fixed strategy like other conventional EAs, Quant AI Agents   is a   multi-agent AI trading framework   that turns natural-language strategy prompts into live.  WANT THE SAME RESULTS AS MY LIVE SIGNAL?   Use the exact same brokers I do:   IC MARKETS , IC TRADING   .  Unlike the centralized stock market, Forex has no single, unified price feed.  Every broker sources liquidity from different providers, creating un
Global Investing FX Terminal
Santiago Nicolas Pla Casuriaga
5 (1)
Global Investing FX Terminal 是一款面向 MetaTrader 5 的一体化外汇仪表盘——涵盖央行政策利率、CFTC COT 持仓、利差排名、经济意外指数、期权偏斜、散户情绪与相关性,共十三个分析面板——以单一无闪烁画布呈现,每 10 秒从单个挂载 EA 刷新一次,无需任何外部软件。 专业外汇分析需要同时调取通常分散在不同平台的数据:利率衍生品、政府数据门户、券商掉期规格、期权台。此 EA 将所有这些整合到交易终端内的单一界面中,在您执行决策的地方完成分析。 仪表盘上显示的内容 市场概览 外汇对列表 — 所有 28 个 G10 货币对,加上当券商 Market Watch 中存在 NOK/SEK 交叉盘时显示的交叉盘——最多共 36 个货币对——的实时买卖价。每行显示点差、日度与周度变化、以点数表示的绝对区间,以及 ADR%——当前交易时段区间占 14 日平均日区间的百分比。ADR 达到 95% 的货币对已消耗其统计日内延伸空间;伦敦盘中场 ADR 仅 25% 的货币对仍有运行余地。颜色逐 Tick 实时更新。 货币对详情 — 点击列表中的任意行,即可打开该
Prop Firm Os
Gayathiri Gopalakrishnan
5 (1)
PROP FIRM OS Structured Trading Assistant for MetaTrader 5 PROP FIRM OS is a structured trading assistant designed for MetaTrader 5 users who prefer rule-based market analysis and organized trading workflows. The Expert Advisor combines market analysis tools, scanner functions, dashboard monitoring, alerts, risk-control settings, and trade management features inside one system. PROP FIRM OS is designed to help traders follow selected rules, filters, and monitoring conditions during trading activ
Trading Chaos Expert
Gennadiy Stanilevych
5 (11)
世界上没有本软件的同等产品,它代表一个覆盖交易信号的通用交易 "控制台",自动入场,设置止损和止盈,还有在单一窗口里同时进行多交易尾随终止。EA 的 "三次点击" 直观控制,确保在不同计算机上全方位使用所有功能,包括平板电脑。 与附加的信号指标交互来标记图标,给出实际市场的全貌,EA 令您做出正确的选择,以及在大多数情况下成为胜者一方。内置资金管理算法, 还有自动计算手数, 虚拟订单交易, 以及一些其它从崩溃账户里挽救交易者的 "诀窍"。它不是一个 "黑盒子"。而是一个深思熟虑的交易员的不可或缺的助理, 至少要尝试一次它的动作。 注,在面板上形成的 EA 不能在策略测试员中测试。可以在您的模拟账户里以实时模式检查它, 您可以下载本 EA 的免费版 - 混沌交易 EA 演示 。 EA 表现为一个面板,带有内置功能的交易机器人的,自动基于交易者可直观检查的交易信号入场,完全按照比尔·威廉姆斯的策略“混沌交易:第二版”和“新贸易维度”。在单独的窗口里,EA 识别价格走势的导向,用于指定品种和时间帧的全自动交易模式,也可以多品种并发。 它同时分析 MetaTrader 5“市场观察”窗口中显示
EasyInsight AIO MT5
Alain Verleyen
4.92 (12)
EASY Insight AIO – 全能智能交易一站式解决方案 概述 想象一下,您可以在几秒钟内扫描整个市场——外汇、黄金、加密货币、指数,甚至股票——无需手动筛选图表、繁琐安装或配置指标。 EASY Insight AIO 是您专为 AI 交易打造的即装即用数据导出工具。它将整个市场快照一次性输出为简洁的 CSV 文件,直接支持 ChatGPT、Claude、Gemini、Perplexity 等各类 AI 平台的即时分析。 无需窗口切换,无需图表叠加,也没有任何杂乱。只需纯净、结构化的数据自动导出,让您专注于基于数据的高效决策,无需再盯盘耗时。 为什么选择 EASY Insight AIO? 真正的一体化 • 无需设置,无需安装指标,无图表叠加。只需安装、运行并导出——就是这么简单。 多资产全覆盖 • 扫描分析外汇、金属、加密货币、指数、股票——您的券商所能提供的一切市场。 AI 专属数据导出 • 高度结构化、针对 AI 优化的 CSV 文件,直接适配主流智能工具和平台。 完整导出内容: • 三个可选周期的货币强度分析 • 净多头头寸变化体现市场情绪 • 成交量变化、
TradePad
Ruslan Khasanov
5 (1)
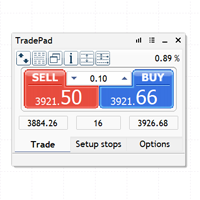
TradePad 是一種既可用於手動交易又可用於演算法交易的工具。我們為您提供一個簡單的解決方案,用於快速交易操作和控制多種交易工具的持股。 注意,該應用程式不適用於策略測試器! 模擬帳戶應用程式的試用版和所有工具的描述 應用程式介面適應高解析度顯示器,簡單直覺。為了方便工作,我們為交易者提供了以下工具: 熱鍵管理器,用於管理交易操作、在主圖表的週期之間切換、在 TradePad 工具之間切換; 標記交易等級的工具,用於在開倉或設定掛單時評估虧損風險並計算潛在利潤; MultiCharts 工具用於直觀地監控多個交易符號,以及接收演算法交易的交易訊號。為了方便起見,您可以組織交易對的集合,這將使您有機會在多個時間範圍內監控價格並進行多幣種交易; 用於查看任何歷史時期的交易統計資料的資訊模組,能夠產生擴展的 HTML 報告、查看交易符號的特徵和有關交易帳戶的資訊; 掛單管理器用於管理掛單 - 設定單一或一組(網路)掛單,可按訂單類型和單一符號或交易帳戶上的所有類型進行分組刪除; 設定賣出停損限價和買入停損限價掛單的工具; 頭寸管理器用於管理一個或多個頭寸(取決於帳戶類型) - 全部
The real‑time view of what is happening inside the market. Footprint Secrets brings detailed analysis directly into MetaTrader 5. It shows where volume is trading, how buyers and sellers are interacting, and how liquidity shifts as the market evolves. Designed for traders who want a precise, real‑time understanding of market behavior. Check out the free preview version here:  https://www.mql5.com/en/market/product/172398 Benefits for the Trader See the real activity behind price . Footprint ch
HINN Lazy Trader
ALGOFLOW OÜ
5 (1)
The core idea: using the user interface, you configure the parameters the chart must meet before entering a position (or positions), choose which entry models to use, and set the rules for when trading and planning should end. Lazy Trader  handles the rest: it  takes over all the routine chart watching and execution! full description  :: 3 key videos [1] ->  [2]   ->  [3] What can it do? - Understands Larry Williams market structure - Understands swing market structure by Michael Huddleston
Custom Alerts AIO:多市场智能监控,一键启动,无需设置 概述 Custom Alerts AIO 是一款“开箱即用”的高级市场扫描工具,无需额外安装任何其他指标或进行复杂设置。它内置了 Stein Investments 的所有核心指标(FX Power、FX Volume、FX Dynamic、FX Levels 和 IX Power),可帮助您轻松监控所有主要资产类别,如外汇、黄金、指数和加密货币。如果您的经纪商支持股票,您也可以手动添加个股进行监控。 1. 为什么选择 Custom Alerts AIO? 无需额外购买任何指标 • 所有关键指标均已内置,开箱即用。 • 专注于实时预警,不包含任何图形元素,性能高效,界面简洁。 全面覆盖所有主要市场 • 支持监控外汇、金属、加密货币和指数市场。 • 无需手动输入任何交易品种,只需在设置中勾选资产类别即可启用。 • 股票并不属于默认类别,如有需要可手动通过参数输入添加。 高效、专业、便捷 • 无需图表模板和手动加载,适合自动化或远程交易环境。 • 非常适合 VPS 上长期运行,或作为后台市场预警工具使用。 2
Check EA performance  https://www.mql5.com/en/signals/2376164?source=Site +Profile+Seller Spot vs Future Arbitrage EA for MT5 Spot vs Future Arbitrage EA is an automated Expert Advisor designed for MetaTrader 5 that operates using price differences between Gold spot and Gold futures instruments. The strategy opens positions on both instruments simultaneously to take advantage of temporary differences between spot and futures prices. Requirements The trading account must provide both Gold spot
The product will copy all  Discord  signal   to MT5   ( which you are member  ) , also it can work as remote copier.  Easy to set up. Work with almost signal formats, support to translate other language to English Work with multi channel, multi MT5. Work with Image signal. Copy order instant, auto detect symbol. Work as remote copier: with signal have ticket number, it will copy exactly via ticket number. How to setup and guide: Let read all details about setup and download Discord To MetaTrader
Telegram to mt5 pro
Janet Abu Khalil
4 (4)
Telegram to MT5 Pro — 高级 Telegram 信号复制器(Auto-Fix,多TP,风险控制,完整交易管理) Telegram to MT5 Pro — 专业 Telegram 信号复制系统 Telegram to MT5 Pro 可将来自 Telegram 的交易信号实时复制到您的 MetaTrader 5 账户,并提供完整的风险控制、执行管理与交易管理功能。 系统由两个组件组成: • 运行在 MetaTrader 5 内的 Expert Advisor(EA) • 连接 Telegram 并将信号发送到 EA 的桌面桥接程序 两个组件必须在同一台电脑运行。由于 MQL5 限制,EA 无法直接连接 Telegram。 支持与安装 提供完整 PDF 安装指南。 支持内容: • 完整 PDF 使用手册 • 分步安装指导 • 在线聊天支持 • 交易商设置帮助(前缀、后缀、符号映射) 功能说明 • 读取任意 Telegram 群组或频道信号 • 自动解析交易品种、方向、入场、止损、止盈 • 秒级执行交易 • 管理交易(移动止损、保本、部分平仓) • 支持多账户与多信号
ManHedger MT5
Peter Mueller
4.83 (6)
THIS EA IS A SEMI-AUTO EA, IT NEEDS USER INPUT. Manual & Test Version Please TEST this product before BUYING  and watch my video about it. The price of the ManHedger will increase to 250$ after 20 copies sold. Contact me for user support or bug reports or if you want the MT4 version! MT4 Version  I do not guarantee any profits or financial success using this EA. With this Expert Advisor, you can: Implement your own Zone Recovery strategy to capitalize on trending markets. Create Grid trading s
Unlimited Trade Copier Pro MT5 is a tool to copy trade remotely to multiple MT4, MT5 and cTrader accounts at different computers/locations over internet. This is an ideal solution for you if you are a signal provider and want to copy your trades to other receivers globally on your own rules. One provider can copy trades to multiple receivers and one receiver can get trade from multiple providers as well. The provider can even set the subscription expiry for each receiver, so that receiver will n
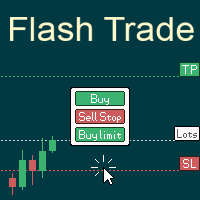
# 如果您有任何其他需求或對合作感興趣,請聯繫 zion.quantech.london@gmail.com。 Flash Trade (FT) 最友善的手動交易工具。 使用最直觀的操作來確保您的資金。 FT的特點 點擊任意位置快速交易 FT支持市場訂單和掛單 兩次點擊完成訂單並設置SL和TP 三次點擊完成掛單並設置SL和TP 自動將每個訂單的止損金額設置為您設置的餘額百分比或固定金額 下訂單時實時預估利潤 超簡單的界面和操作 支持拆分訂單 使用方式 市場訂單: 點擊圖表決定止損價位 點擊Buy或是Sell鈕 掛單: 點擊圖表決定入場價位 選擇掛單類型 點擊圖表決定止損價位 暫停FT: 點擊右上方的"On/Off"按鈕來切換開關 當按鈕從綠(On)變為紅(Off),代表FT已被停止 點擊"Off"按鈕再次開啟FT 如果有任何疑問、改善建議或是bug回報都可以聯繫e50310@gmail.com或留下評論 功能將持續於未來的版本推出
RiskGuard Management
MONTORIO MICHELE
5 (22)
注意 :要获取免费试用版,请访问我的网站。 使用手册 用户手册 RiskGuard Management — 您进行无妥协交易的终极盟友。 Lot Calculator — 自动计算手数。 Quantum — 自动风险控制,最大化利润并减少回撤。 Automatic Journal — 包含并可从我的网站免费下载。 Automatic Screenshot — 两张截图:开仓时一张,平仓时一张。 Partial Profit — 智能管理的部分平仓功能。 Smartphone Trading — 可通过手机下单,自动管理。 Stop Loss & DD Block — 每日资金的全面保护。 Automatic Break-Even — 轻松降低风险。 Closing Time — 精准控制交易时间。 Automatic Spread — 实时正确设置止损和止盈。 详细的多语言文档以及意大利语和英语的视频教程,可在我的网站上获取。
Adam FTMO MT5
Vyacheslav Izvarin
5 (2)
ADAM EA Special Version for FTMO Please use ShowInfo= false for backtesting ! Our 1st EA created using ChatGPT technology Trade only GOOD and checked PROP FIRMS  Default parameters for Challenge $100,000 Tested on EURUSD and GBPUSD only  Use 15MIN Time Frame Close all deals and Auto-trading  before Weekend at 12:00 GMT+3  Friday For Prop Firms MUST use special Protector  https://www.mql5.com/en/market/product/94362 --------------------------------------------------------------------------------
Crystal Trade Manager – Advanced MT5 Risk and Trade Control Utility Overview Crystal Trade Manager (CTM) is a professional MetaTrader 5 utility designed for risk management, trade automation, and instant execution control. It provides traders with an integrated system for protecting equity, managing daily drawdowns, controlling lot sizes, and applying automation features such as automatic SL/TP, break-even, and trailing stop. The tool is suitable for manual traders, prop-firm challenge particip
Royal Copier
Janet Abu Khalil
5 (1)
Royal Copier — 专业版 MT5 交易复制器 Royal Copier 是一款适用于 MetaTrader 5 的专业本地实时交易复制器。 现在它已将两种功能整合到一个 MT5 Expert Advisor 中。 您只需在参数中选择 EA 运行于 Master 模式 或 Client 模式 。 这意味着同一个 EA 既可用于源账户,也可用于接收账户,同时保留原有复制器的运行逻辑。 Royal Copier 支持以下常见账户复制方式: MT5 到 MT5 MT5 到 MT4 MT4 到 MT4 MT4 到 MT5 如需与 MT4 进行复制,请使用 MT4_Copier 。 工作原理 Royal Copier 是一个本地复制器,通过同一台 Windows 电脑上的共享文件运行。 当 EA 设置为 Master 模式 时,它会监控源账户并将所有交易活动写入共享文件。 当 EA 设置为 Client 模式 时,它会读取该文件,并在接收账户上镜像执行相同操作。 复制器可以同步以下内容: 市价单 挂单 交易平仓 部分平仓 止损和止盈修改 挂单更新和删除 两个终端必须运行在同一台 Win
Features   With MT5 to Interactive Brokers(IB) Trader, you can: 1. Load chart data from IB to MT5, and Analyze with all standard or customer Indicators. 2. Place Orders to IB Account Directly in MT5. 3. Make your Own EAs upon IB Securities by only making minus changes of the trading function. Usage 1) Installation Copy the "Mt5ToIBTraderEn.ex4" and sample files to [MT5 Data Folder]->MQL5->Experts.  2)  MT5 Settings Add the IP Address to the MT5 Allowed URLs in 'Tools->Options->Expert Adviso
QCML Assistant
Maxime Turcotte-lafreniere
QCML Assistant MT5 Your Trading. Our Assistant. Your Edge. Looking for a tool that completely transforms your experience on MetaTrader 5? QCML Assistant is the all-in-one solution built by traders, for traders. Just one tool installed on your chart, and you get access to an ultra-complete, ultra-fast, and ultra-simple trading platform. No more hours wasted setting up your workspace. No more complicated trade entries. With QCML Assistant, everything becomes simple, smooth, and efficient right fro
Latency Arbitrage
Heri Yusufu Kaniugu
Latency Arbitrage – Ultra Fast Execution & Price Inefficiency Capture Latency Arbitrage  utility tool is designed to exploit short-term price inefficiencies between fast and slow price feeds. Instead of predicting market direction, the EA focuses on execution speed and price deviation opportunities, allowing traders to capture micro-movements before the market fully adjusts. With built-in risk controls and smart filtering, it ensures precise and disciplined trading performance. Price increases b
Forex Analyzer Pro MT5 交易账户分析仪表板 Forex Analyzer Pro 是一款专为 MetaTrader 5 用户设计的网页交易分析平台。 Forex Analyzer Pro 可同步 MetaTrader 5 账户活动,并通过结构化仪表板将交易数据整理为分析、报告、监控和交易日志工具。 该平台允许用户通过支持的桌面和移动设备网页浏览器访问其交易仪表板。 Forex Analyzer Pro 可连接您的 MT5 账户,并将交易活动集中到统一的仪表板中,方便您监控持仓、查看历史记录、分析统计数据以及管理交易记录。 功能特色 • MT5 账户仪表板 • 持仓监控 • 交易历史分析 • 交易日历 • 策略跟踪 • 交易日志 • 账户统计分析 • 绩效报告 • 交易通知 • 多账户支持 MT5 账户仪表板 查看 MetaTrader 5 账户中的重要信息。 仪表板显示: • 账户余额 • 账户净值(Equity) • 可用保证金 • 保证金水平 • 当前持仓 • 浮动盈亏 • 交易量 • 经纪商信息 • 账户详情 所有账户信息均以结构化界面呈现,方便监控和管理。
Telegram to MT5 Bridge Client EA Turn Any Telegram Trade Signal into Live MT5 Orders Uses AI to help you Adapt to future changing signal messages. Never miss a trading opportunity again. This Expert Advisor connects your MetaTrader 5 to your Telegram channels or groups – and executes trades automatically as soon as a signal is posted. Receive market orders, limit orders, and even multi‑level take‑profit signals (up to three targets). The EA does the heavy lifting for you: it detects entry price
MT5 Trading Deck
Manuel Michiels
5 (2)
One button. One trade. MT5 Trading Deck is a hotkey trading panel for MetaTrader 5 that turns the platform into a keyboard-driven execution cockpit. Stop loss, take profit and lot size are pre-calculated for every key; the moment you press, a market order is live on the broker. A complete technical user manual is attached in the product Comments section. It documents every input parameter, the full hotkey map, the recommended Stream Deck XL layout, and the advanced workflows for Pre-Limit orders
作者的更多信息
Manual position management. Missing SL. Price moves against you. No protection. Trade Manager Lite automates Stop Loss, Take Profit, Trailing Stop, and Break-Even for your open positions. Attach to one chart. Configure your default SL/TP distance. Let it manage your positions automatically. What's Included (FREE Version) Auto SL/TP: Applies missing Stop Loss and Take Profit to positions based on your configured distance in points Trailing Stop: Adjusts SL dynamically as price moves in your favor
FREE
SMC Liquidity Channel Guard
Nguyen Thanh Trieu
4.67 (3)
SMC Liquidity Channel Guard Prices reverse just as your breakout trade triggers. Account suffers unexpected drawdown. Because standard channels ignore institutional liquidity sweeps and trap retail stop-loss orders. This utility automatically monitors highest buy-side and lowest sell-side liquidity pools to flag false breakouts. Key Features: Dynamic Liquidity Tracking: Maps Buy-Side (BSL) and Sell-Side (SSL) boundaries without lagging moving averages. Sweep Identification: Prints precise direct
FREE
Prop Firm Risk Guard
Nguyen Thanh Trieu
5 (1)
资源与快速链接 下载模拟版 PropFirm Risk Guard 是一款高级工具,旨在对您的交易账户执行严格的风控和资金保护协议。它作为一个自动化的合规层运行,确保您的净值保持在预设的每日和整体回撤限制内。非常适合具有严格回撤指南、资管挑战评估以及专业资金管理要求的账户。 该工具在后台实时监测(每100毫秒)您整个账户的所有持仓,无论它挂载在哪个图表或货币对上。它在后台静默运行,在接近或突破阈值时执行资金保护操作。 --- 关键功能表 功能类别 技术规范 / 机制 实际运行效益 回撤守护 实时每日和整体净值亏损跟踪(美元或%) 当达到限制时关闭所有交易以防止账户爆仓或违规。 移动净值锁定 带有移动偏差的利润锁(棘轮)系统(美元或%) 通过锁定净值高点来在市场逆转时锁定利润。 宏观过滤 按影响度、货币对和关键字过滤的新闻阻断器 在高影响的经济新闻发布前限制交易或删除 SL/TP。 隐形目标水平 隐形止损 (SL) 和止盈 (TP) 水平 在本地内部监控价格水平,对外部经纪商隐藏交易目标。 已平仓盈亏限制 滚动业绩跟踪(每小时、每日、每周、每月) 如果达到特定的亏损/利润限制,则阻
Trade Command Center
Nguyen Thanh Trieu
5 (2)
附加材料和说明 安装说明 - 用于模拟账户的应用程序试用版 ; 官方信息 官方频道 卖家个人资料 告别手数猜测。精准掌控每一笔交易。 你是否曾因为在网页计算器上浪费15秒算手数,而眼睁睁看着完美的入场位溜走?或者更糟,在黄金(XAUUSD)上输错手数,仅仅一次手抖就抹平了数周的交易成果? Trade Command Center (TCC) 将您的 MetaTrader 5 图表打造成专业级交易驾驶舱。它彻底告别心算与外部表格,通过硬性风控规则守护您的账户本金,并支持直接在图表上进行毫秒级一键下单。 无论您是专注高频超短线(Scalping)、多货币对波段交易(Swing Trading),还是在 自营交易公司(Prop Firm 考核账户) 中面临严苛的每日回撤限制,TCC 都能确保每笔订单在开仓前严格遵守您预设的风险底线。 为什么手动交易者信赖 Trade Command Center 1秒精准风险算仓: 拖动止损线(Stop Loss)到市场结构位,TCC 立即自动计算出精准手数——无论是净值的1%、固定150美元风险,还是账户余额百分比。告别计算器,彻底杜绝输入错
Smart Session Box MT5
Nguyen Thanh Trieu
Smart Session Box Displays Asia, London, and New York trading sessions with automatic timezone adjustment and session overlap highlighting. Main Features Complete session analysis with no limitations. Key Features The indicator draws session boxes with high and low lines for each trading session. Session overlaps are highlighted with distinct colors to identify high liquidity periods. Breakout alerts notify when price crosses previous session levels. A control panel provides quick toggles for al
FREE
Volume Pressure Meter breakdown tick volume to reveal the buying and selling pressure inside every candle. Unlike standard volume which only shows total activity, this indicator splits volume to show who is actually in control of the market. It helps you identify trend strength and spot potential reversals through volume divergence. Key Features: Pressure Gauge: Visual bar showing real-time Buy vs Sell percentages. Trend Bias: Automatically identifies if the market is dominated by Buyers or Sell
FREE
Confluence Bias Map
Nguyen Thanh Trieu
Confluence Bias Map 将关键的市场指标整合为一个单一的实时评分,以支持您的交易分析。 在分析图表时,单独查看多个独立的指标(均线、MACD、ADX、RSI、Stochastic、布林带、MFI、ATR)往往会导致信号冲突和决策瘫痪。在没有结构化方法的情况下,对比不同时间框架的趋势、动能、波动率和成交量很难定义真实的市场偏向。 Confluence Bias Map 通过将这 4 个核心市场维度跨 3 个时间框架整合为一个单一的实时评分,解决了这一问题。 它显示的内容: 圆环仪表盘 (Donut Gauge): 在仪表盘中心显示 0 到 100 的综合汇聚评分 (Confluence Score)。 类别拆解: 显示趋势(基于 EMA、MACD、ADX)、动能(基于 RSI、Stochastic)、波动率(基于布林带)和成交量(基于 MFI)的各自平均评分。 时间框架扫描: 显示 3 个时间框架的独立评分和实时进度条:当前图表周期以及两个更高周期(例如 M15、M30、H1)。 历史实证: 直接在面板上计算并显示信号触发(评分 >= 75 或 <= 25 在 10 根
FREE
Session Box And Timer
Nguyen Thanh Trieu
Session Box And Timer 日内交易需要监控各大交易时段之间的过渡,然而手动重叠时间表容易出现计算错误。若没有清晰的标记,前一时段的关键价格水平和流动性区域很容易被忽略。 Session Box And Timer 直接在您的图表上直观显示交易时段、波动趋势和倒计时器。 它显示什么: - 时段框(Session Boxes): 代表亚洲、伦敦和纽约时段的彩色矩形,标签中会显示自动计算的点数范围(pip range)。 - 亚洲时段区间水平: 亚洲时段最高价和最低价的投影向右延伸为水平线,作为日内突破的参考。 - 前一日最高价/最低价 (PDH/PDL): 标记前一天最高和最低边界 landlords 的虚线水平线。 - 时段周期线和倒计时标签: 在即将开盘的时段画出垂直线,显示距离下一时段开盘的精确剩余倒计时时间(时:分:秒)。 - 波动率热力图 (Volatility Heatmap): 图表底部的连续多色块状指标,显示过去20天的历史每小时波动率。 - 仪表板面板 (Dashboard Panel): 简洁的叠加层,显示活跃或即将到来的时段、实时倒计时、本地GMT
FREE
Impulse Momentum Shift
Nguyen Thanh Trieu
5 (1)
一根大实体蜡烛收盘。看起来像突破。您入场。 下一根K线反转,触发了您的止损。成交量只是平均水平。动能早已衰减。 Impulse Momentum Shift 识别具有真实冲量的K线,并标记冲量反转的时刻。 大多数交易者只看蜡烛大小。真正的冲量由三个因素构成:实体主导性、成交量突破近期均值、以及经ATR标准化的方向性动能。 本指标对每根K线进行三维评分,以5色冲量色阶绘制图表,并在强冲量阶段反转方向的瞬间放置转变箭头——仅在已收盘的K线上触发。 显示内容: 5色冲量K线: 亮蓝色代表强烈看涨冲量,浅蓝色代表适中,灰色代表中性,珊瑚色代表适中看跌,深红色代表强烈看跌。每根K线实时评分0–100 冲量追踪线: 基于ATR的动态追踪线,随主导冲量方向棘轮式移动。趋势结构转变时变色,作为视觉偏向锚点 动能转变箭头: 仅在确认的冲量K线序列反转后触发。无重绘。信号仅出现在完全收盘的K线上 状态标签: 实时显示当前状态——IMPULSE BUY、MODERATE SELL、LOW MOMENTUM——以及百分比评分和追踪线方向 K线倒计时计时器: 当前K线收盘前的剩余时间,显示在图表上 冲量评分机制
FREE
Morvan
Nguyen Thanh Trieu
3 (1)
MORVAN 我是 Morvan。 我读取方向。我等待结构形成。我只在价格到达最有可能发动行情的位置时出击。 不猜测。不报复交易。不在噪音中追逐K线。 只有当结构对齐时我才执行 — 并且从入场到出场,纪律管理每一笔仓位。 大多数交易者亏损不是因为看不懂图表。他们亏损是因为入场太晚、仓位太随意、止损放在流动性猎杀的位置,以及让情绪凌驾于出场计划之上。 我被设计来消除这个弱点。 我不预测市场。我不需要。 我读取方向偏差,等待结构建立,只在延续或突破成为更高概率结果时部署。 运作方式 我的执行框架建立在三个原则之上: 趋势优先。结构其次。风控始终。 首先,我从高时间框架结构中读取主导市场方向。如果方向不明确,我保持空仓。 然后我寻找延续压力最强的价格区域。我不跳入噪音中。我等待价格来找我。 当设置有效时,我带着预定义的止损入场,管理订单并保护仓位。 如果市场条件恶化,挂单将被移除、重新计算并重建。如果结构破裂,我退出观望。 三重策略。一个方向。 MORVAN 同时运行三个独立的执行层 — 每一层校准于不同的波动率维度。 第一层 响应更快的日内动量 第二层 跟踪中等结构的延续 第三层 监控更深
Murrey Math Channels
Nguyen Thanh Trieu
Murrey Math Channels Identifying key market reversal points and core trading ranges can be challenging. Traditional analysis often lacks clear mathematical structure, leading to inconsistent entries. Murrey Math Channels provides a mathematically grounded price framework based on the Law of Octaves to help traders define precise support, resistance, and reversal zones. How to Read the Chart: The indicator divides the price action into 8 main octaves (levels), each representing a different marke
FREE
Pullback Execution Map
Nguyen Thanh Trieu
4.5 (2)
Price breaks out. You want the continuation, but the entry usually comes too early, too late, or directly into a weak pullback. Without structure, most traders can see the move but still cannot define where the retracement remains healthy and where the setup starts to fail. Pullback Execution Map turns the current swing into a visual execution plan on the chart and a pullback meter below price. What it shows: Fibonacci execution pocket: Maps the active swing with a clear pullback pocket from the
FREE
Volume Pressure Meter MT5 蜡烛看起来很强。成交量似乎很高。您在突破时进场。 价格在几分钟内反转。这个走势没有真正的参与。 Volume Pressure Meter揭示了机构所看到的:价格走势背后是否存在实际的买压或卖压,还是您在对着空量交易。 专为日内与波段交易者设计,用于分析黄金(XAUUSD)、指数和主要外汇货币对,时间周期从M5到H4。将八种机构级成交量分析工具整合到一个系统中,配备AI模式识别和实时概率计算。 它显示什么 抬头显示器(HUD)界面: 信号状态: 当前市场建议(BUY、SELL、WAIT、AVOID)实时更新 压力平衡仪表: 买卖参与度的可视化表示,带有颜色编码强度 信号评分: 基于多个成交量确认因素的强度评级,从0到10 胜率概率: 根据当前条件和历史表现数据计算的实时成功概率 市场状态分类: 有效压力、虚假压力、吸筹、派发或压缩区域 多时间框架确认: 显示更高时间框架的偏向以提供背景 图表上的可视化分析: 买卖压力直方图: 在独立指标窗口中分离每根蜡烛的买压和卖压 浮动背景标签: 在当前价格附近显示行动建议(Entry Now、Wa
Keltner Breakout MT5
Nguyen Thanh Trieu
Keltner Breakout Caught in market chop. Fake breakouts trigger unwanted trades. Because standard indicators lack dynamic volatility context. This utility automatically combines a Dynamic Volatility Channel, Dual MA trend detection, and RSI momentum filtering into one visual system. Key Features: Trend Cloud: Visually fills the trend zone with a dynamic Keltner-style volatility channel. Multi-Factor Breakout: Only issues a signal when price breaks the volatility channel AND trend/momentum confirm
FREE
Parabolic Trend Corridor Identifying trend direction and volatility boundaries is a common challenge for day traders. Standard indicators often lack a holistic view of both trend structure and market noise. Parabolic Trend Corridor solves this by combining the adaptive nature of Parabolic SAR with dynamic ATR volatility bands. Key Features: Adaptive Trend Core: Uses Parabolic SAR as the foundation to follow price movement and volatility changes without lag. Dual-Color Cloud: Dynamic visual feedb
FREE
Smart Confluence Radar
Nguyen Thanh Trieu
Smart Confluence Radar 分析三个独立指标以寻找共振需要时间。要获得多时间框架叠加、提醒和交易时段过滤功能,请参阅 Smart Confluence Radar Advanced 。 Smart Confluence Radar 将 ATR 扩展、成交量动能和变化率组合成直接叠加在蜡烛图上的单一可视层。 显示内容: 彩色蜡烛: 亮色 = 高共振(得分 ≥70)。暗色 = 中等共振。灰色 = 低动能。 动能线: 直接绘制在图表上。蓝色 = 买方压力,红色 = 卖方压力,灰色 = 中性。 Bar 标签(+/-): 仅显示在高共振的已收盘 Bar 上。看涨 Bar 下方显示 "+",看跌 Bar 上方显示 "-"。 Bar 倒计时: 右上角显示当前时间周期和剩余秒数。 适用于: 黄金(XAUUSD)、主要外汇对和指数的日内交易。M5 至 H4。 不具备的功能: 不自动生成买卖信号。 不预测未来价格走势。 仅可视化共振数据,决策权完全属于您。 设置: 附加到图表后,根据需要调整周期参数即可使用。 您的反馈有助于未来更新。请访问我的主页。
FREE
您打开终端,三笔交易正在运行,图表在移动。 但伦敦时段现在真的活跃吗,还是只是纽约开盘前的噪音? Session Pulse Monitor 在图表上直接显示交易时段实时状态、波动率背景和持仓入场时段。 专为跨时段管理仓位的交易者设计,帮助判断市场是否有机构参与还是无方向漂移。 适用于所有品种 — 针对黄金(XAUUSD)、主要外汇货币对和指数优化。 显示内容: 实时时段状态: 亚洲、伦敦和纽约时段的LIVE/倒计时显示。 波动率背景: 每个时段显示历史波动率状态(HIGH / MED / LOW)。 持仓标记: 每个持仓显示入场时段 — 亚洲、伦敦、纽约或重叠时段。 时段倒计时: 当前时段剩余时间和下一时段开启时间,每Tick更新。 本工具不会: 不会开仓、修改或平仓。 不会管理风险或限制回撤。 不会预测价格方向。 提供时段信息,让您的决策更明智。 免费版包含: 时段面板(LIVE / 倒计时) 按时段的波动率评级(HIGH / MED / LOW) 持仓跟踪器与入场时段标签 紧凑型图表面板,可配置位置和字体 需要更多功能? Session Pulse Monitor Advance
FREE
附加材料和说明 安装说明 - 用于模拟账户的应用程序试用版 ; 官方信息 官方频道 卖家个人资料 Trade Command Center — 专业交易执行与实时 Risk Guard 控制面板 Trade Command Center 是一款面向 MetaTrader 5 的高性能直观交易执行、手数计算器及风险管理工具。它专为需要严格风险控制、资金保护以及实时回撤监控的自主交易者而设计,完美适配具有每日/最大回撤限制的资金账户或实盘投资组合。 通过单张图表上的五个专用功能模块,该面板提供机构级风险控制、自动化持仓管理和精准订单规划,且无需外部 DLL 或 network 连接。 界面与模块架构 控制面板由五个专用选项卡组成,便于无缝导航并优化图表空间管理: 选项卡 / 模块 核心功能 屏幕操作与指标显示 TRADE 直观视觉规划、基于风险的动态手数计算、UTC 交易时间管理。 拖拽式参数线、实时 R:R 计算器、一键下单。 ARMOR 高级保护设置、全局与单笔保本(BE)、多级止盈、移动止损。 ATR 波动率、Fractal 波段高低点、Parabolic SAR、K线
Gold Structure Pro
Nguyen Thanh Trieu
GoldStructure Pro 是专为 XAUUSD 设计的市场结构与波动性分析指标。它通过结合多状态波动性引擎、基于摆动结构的假突破过滤以及自动止损与止盈计算,识别高概率的突破信号。所有信号均基于已收盘K线逻辑,确保在 M5 至 M30 的所有时间框架内保持稳定一致。 工作原理 指标持续测量当前 ATR 与其历史均值之间的关系,以判断市场的波动性状态。基于该状态,指标将市场划分为五种内部状态之一:压缩(Compression)、流动性陷阱(Liquidity Trap)、动能形成(Momentum Building)、已确认扩张(Expansion Confirmed)或中性(Neutral)。只有同时通过成交量确认测试和摆动结构过滤器的突破,才会被标记为已确认信号。其余均归类为假突破并单独显示,以提示回避错误入场。 当已确认信号出现时,指标会自动在图表上绘制入场价位、基于最近摆动结构的止损价位,以及使用可配置风险收益比的两个止盈目标。止损距离设有上限,防止在较高时间框架上出现过大的风险级别。 主要功能 五状态波动性模型,并在面板上实时显示当前状态 使用摆动回溯和成交量过滤器对确
准备充分。市场状态错误。交易在执行前就已失效。 宽点差、非交易时段、波动率飙升以及临近重要新闻——所有这些都会在执行前摧毁优势。 Market Bias Monitor 实时分类市场环境,将执行质量从0评分到100,并在条件变化时立即通知您。 专为分析黄金(XAUUSD)、外汇货币对和指数的自主裁量及半自动交易者设计。在M5至W1时间框架上实时监控市场制度、交易时段、点差、新闻风险和多时间框架偏差对齐。 它显示什么: 市场制度分类: 使用ATR波动率和价格与移动平均线的偏差来识别TREND、RANGE、TRANSITION或HIGH RISK——让您可以避免在不稳定制度下执行。 Market Quality Score (0-100): 由制度、点差、波动率、时段、偏差清晰度和新闻临近度组成的综合评分——让您可以客观地过滤条件。 6时间框架偏差面板: M5、M15、H1、H4、D1、W1方向偏差同时显示——让您一眼就能识别时间框架之间的一致或冲突。 执行状态(Lock/Clear): 面板显示LOCKED及最多四个具体原因,或在条件满足时显示CLEARED——让您无需持续监控图表就能等
The Overseer MT5
Nguyen Thanh Trieu
在快速波动的市场中,价格极值点(High/Low)通常构成关键的执行边界,手动下单与止损调整往往存在显著的延迟。 The Overseer 作为一个持续的多时间框架监控系统,能够自动计算基于波动率调整的极值水平,并精确管理挂单与持仓。 "全天候持续守护。设定您的参数,让严谨的逻辑在 24/5 市场中守护您的执行。" 系统监控内容 本系统在多个时间框架下持续扫描市场状况: 价格极值 (Price Extrema): 识别在可配置 K 线周期(H3、M1、D1 等)内的最高价与最低价。 波动率 (ATR): 利用 M15 或指定周期上的 ATR 指标值计算动态挂单间距。 趋势方向 (Trend Direction): 评估 H4、H6、H12、D1、W1 和 MN1 上的多时间框架方向一致性。 点差与时间过滤: 实时监控点差是否超过上限,并执行服务器时间交易窗口限制。 触发时的执行逻辑 当市场状况符合配置规则时: 挂单执行: 在距离极值点基于波动率调整的位置自动摆放或修改 BuyStop 与 SellStop 挂单。 持仓保护: 当达到预设盈利目标时自动触发保本止损 (Breakeven)
筛选:
无评论
回复评论