Confluence Edge

Adaptive trend indicator with 6 selectable trading styles, built-in multi-timeframe (massive update to v3!)


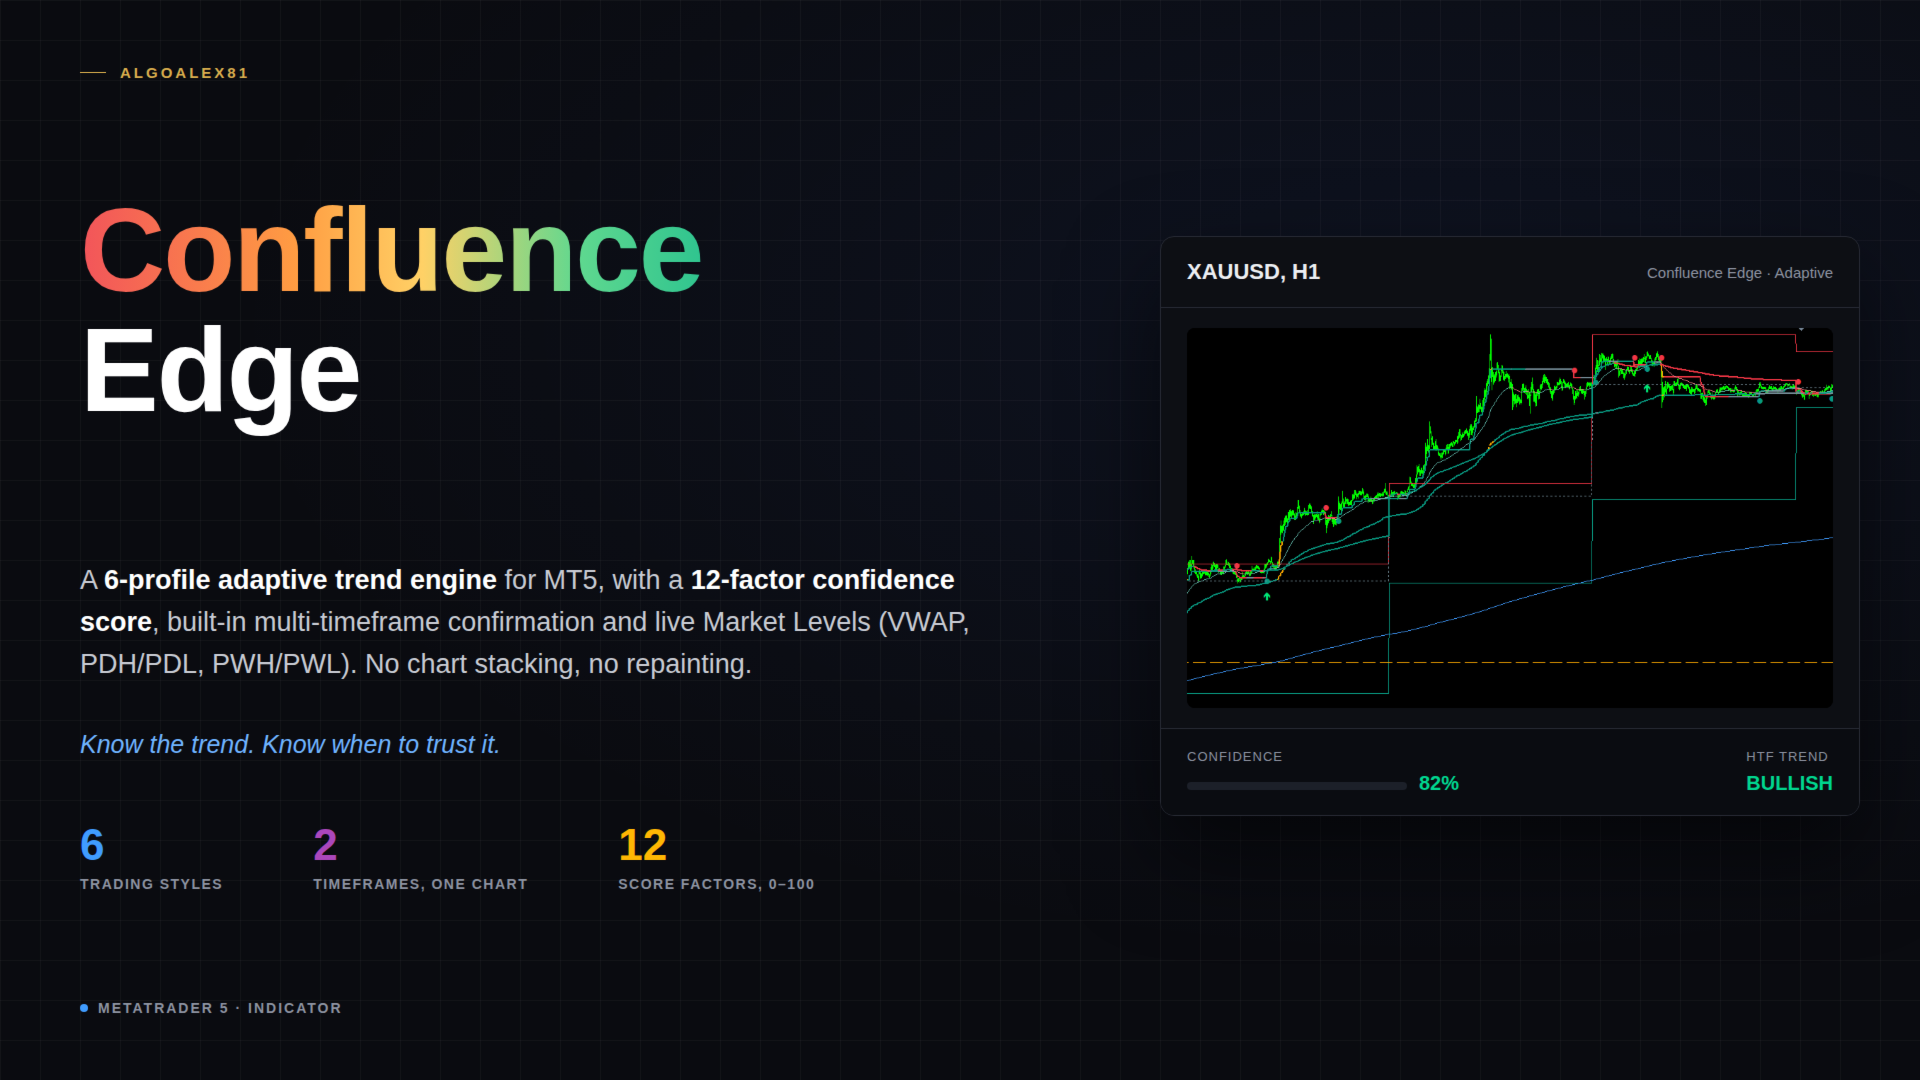
Confluence Edge is a trend-following indicator for MetaTrader 5 built around one idea: a signal is only as good as the context around it. Instead of a single fixed moving average, it lets you choose how the trend engine behaves, confirms every reading against a higher timeframe and against intraday/weekly price levels, and scores its own confidence — all from one chart, one indicator instance.

How it works

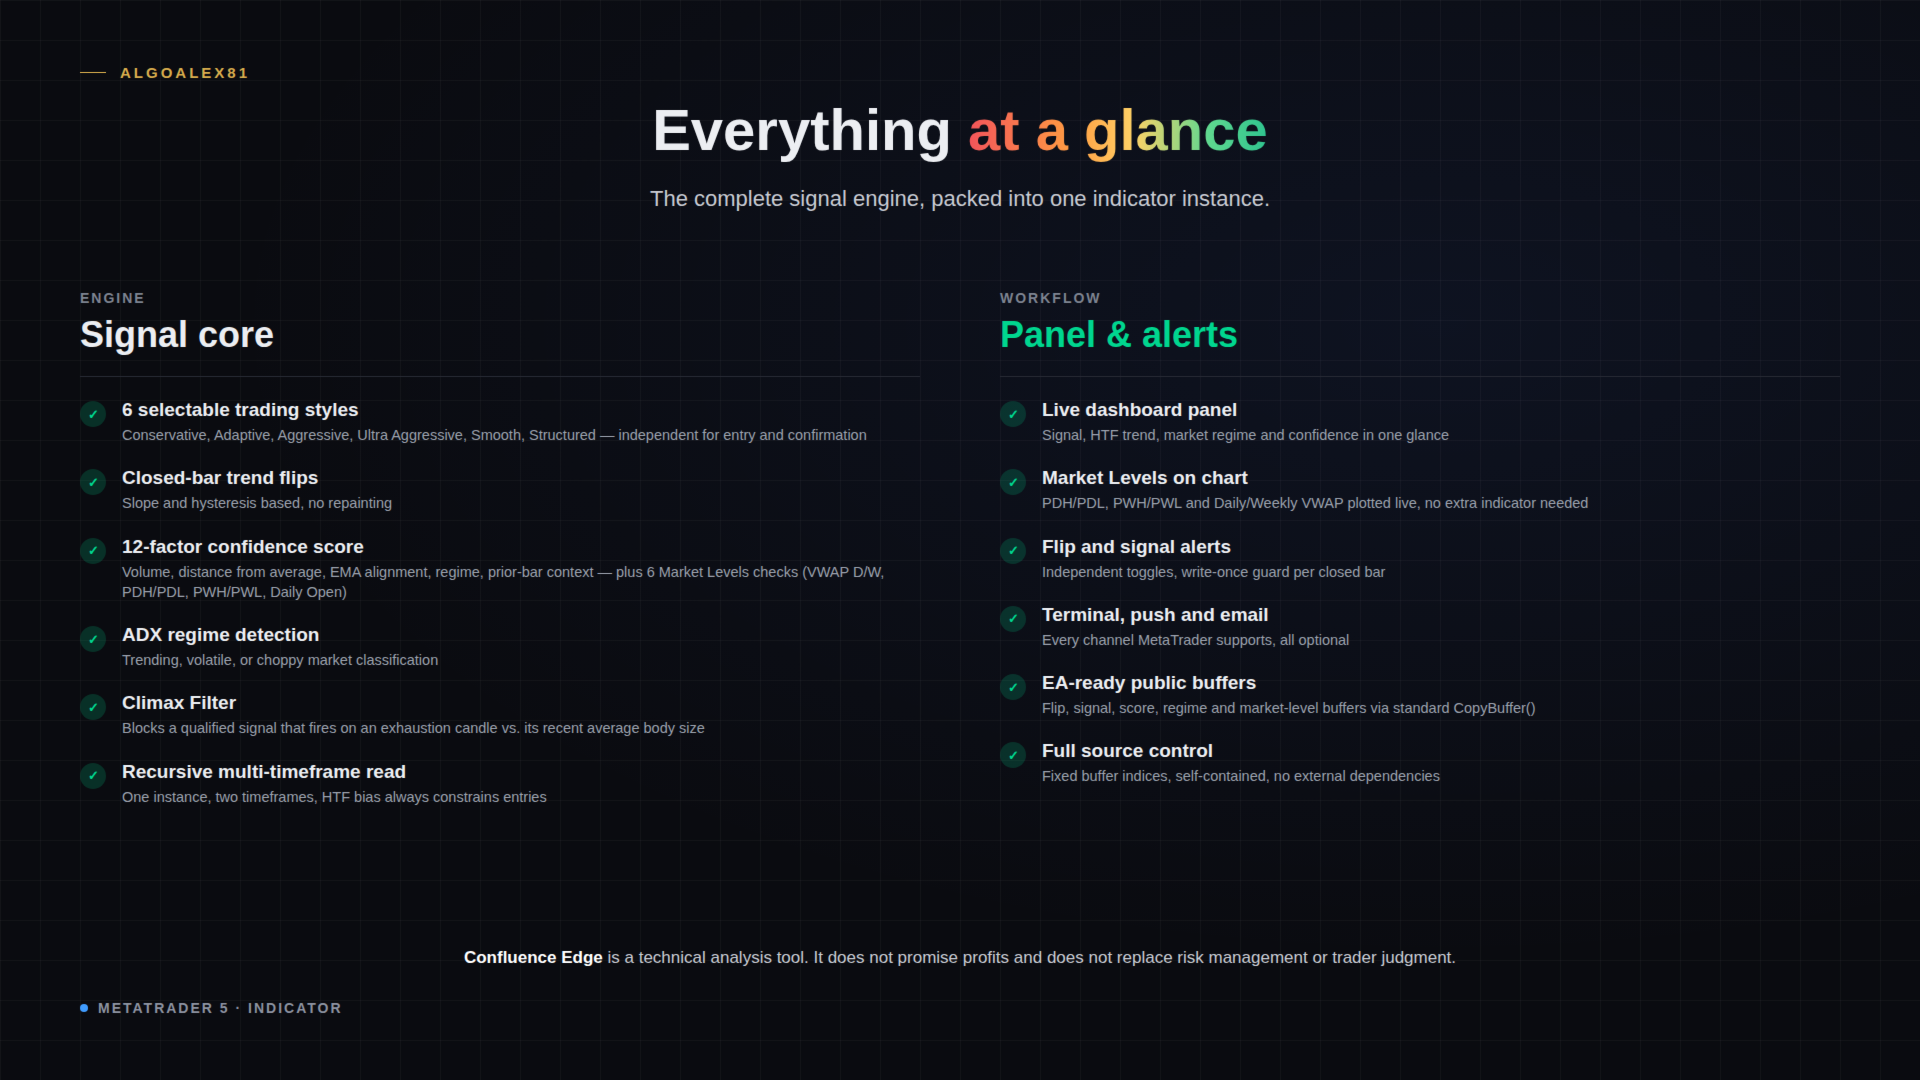
At its core, Confluence Edge tracks trend direction using an adaptive moving average and flags a flip only when the move is confirmed on a closed bar — no repainting, no early signals that disappear on the next tick.

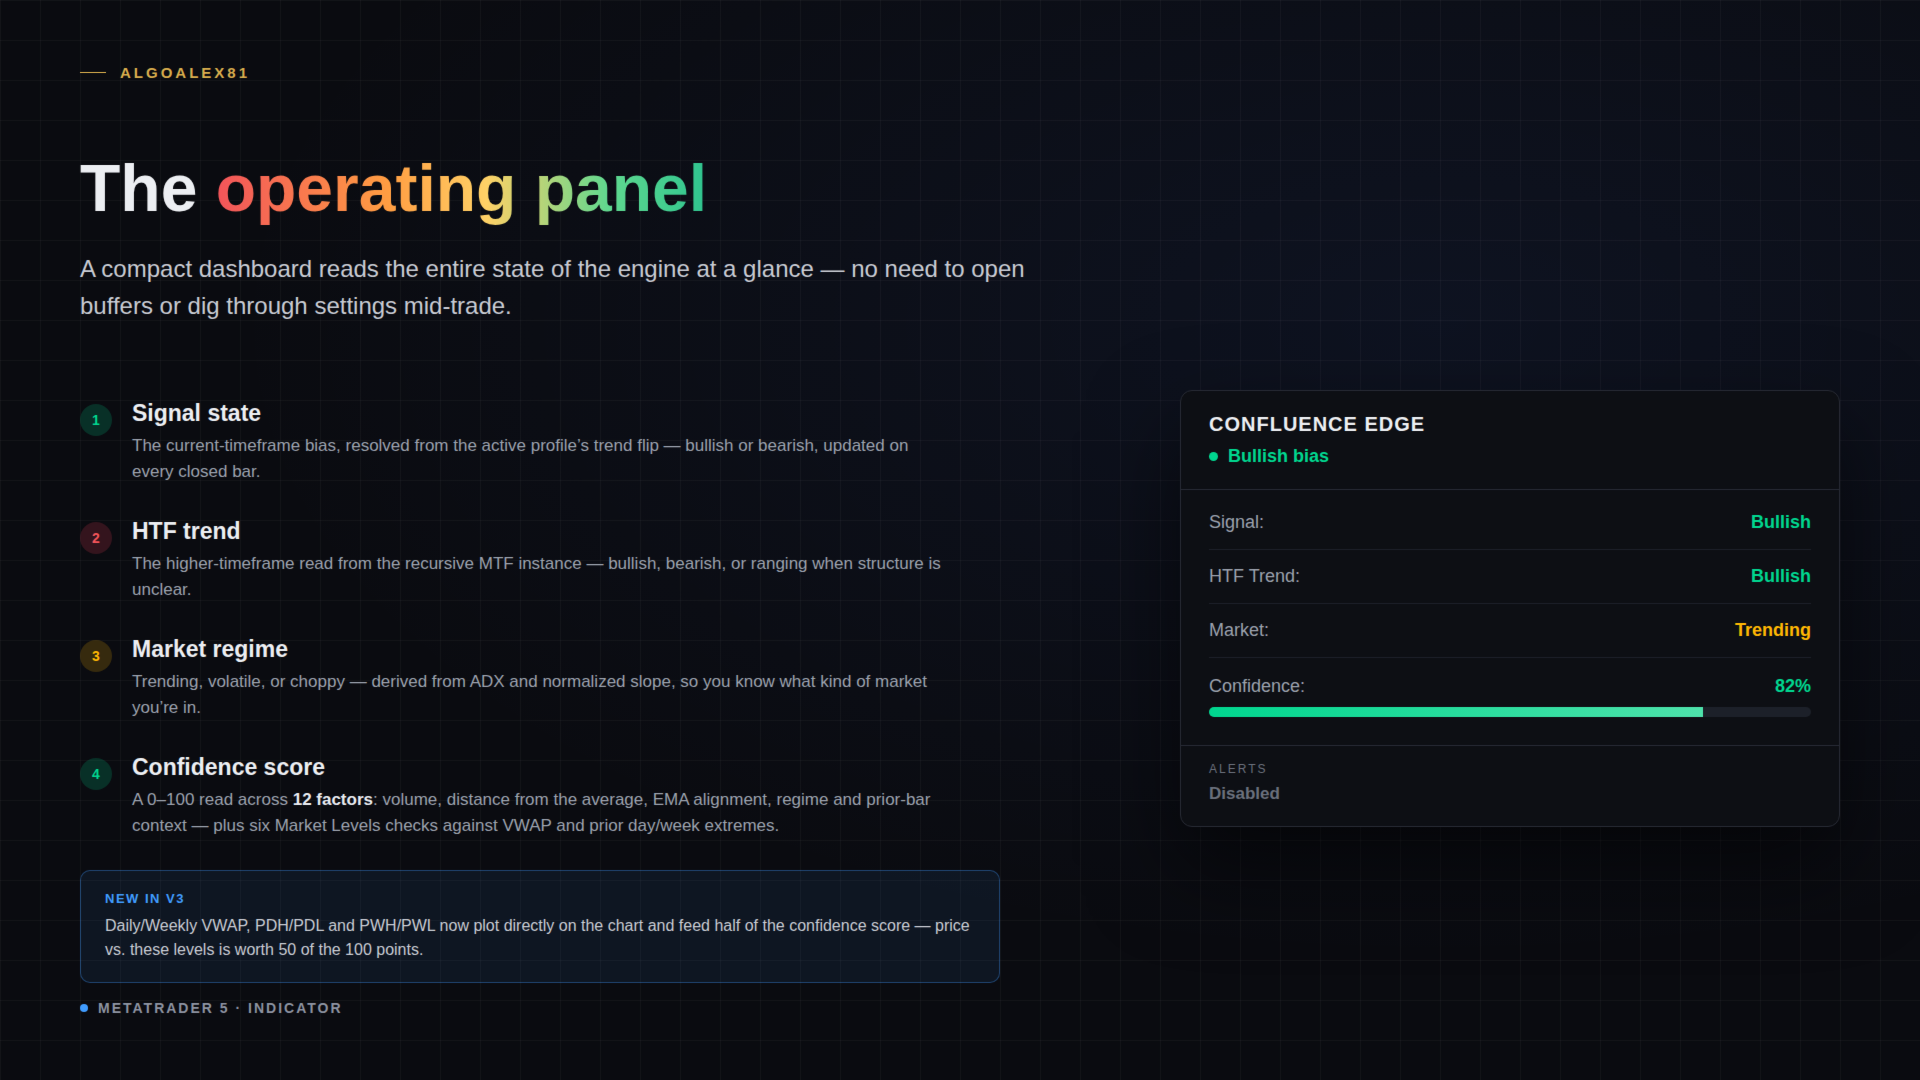
Every potential signal is scored from 0 to 100 across twelve factors: volume behavior, distance from the average, alignment with a longer-term EMA filter, the current market regime, prior-bar context, and six Market Levels checks — price versus the daily open, the daily VWAP, the previous day's high/low, the previous week's high/low, the weekly VWAP, and its standard-deviation distance from the daily VWAP. You set the minimum score you're willing to act on.

The indicator also classifies the market itself — trending, volatile, or choppy — using ADX and normalized slope, so a flip in a strong trend and a flip in a sideways chop are never treated the same way. A separate Climax Filter blocks a signal outright if it fires on an outsized "exhaustion" candle relative to its recent average body size, regardless of score.

Only a confirmed flip becames a signal arrow.

Six trading styles, your choice 

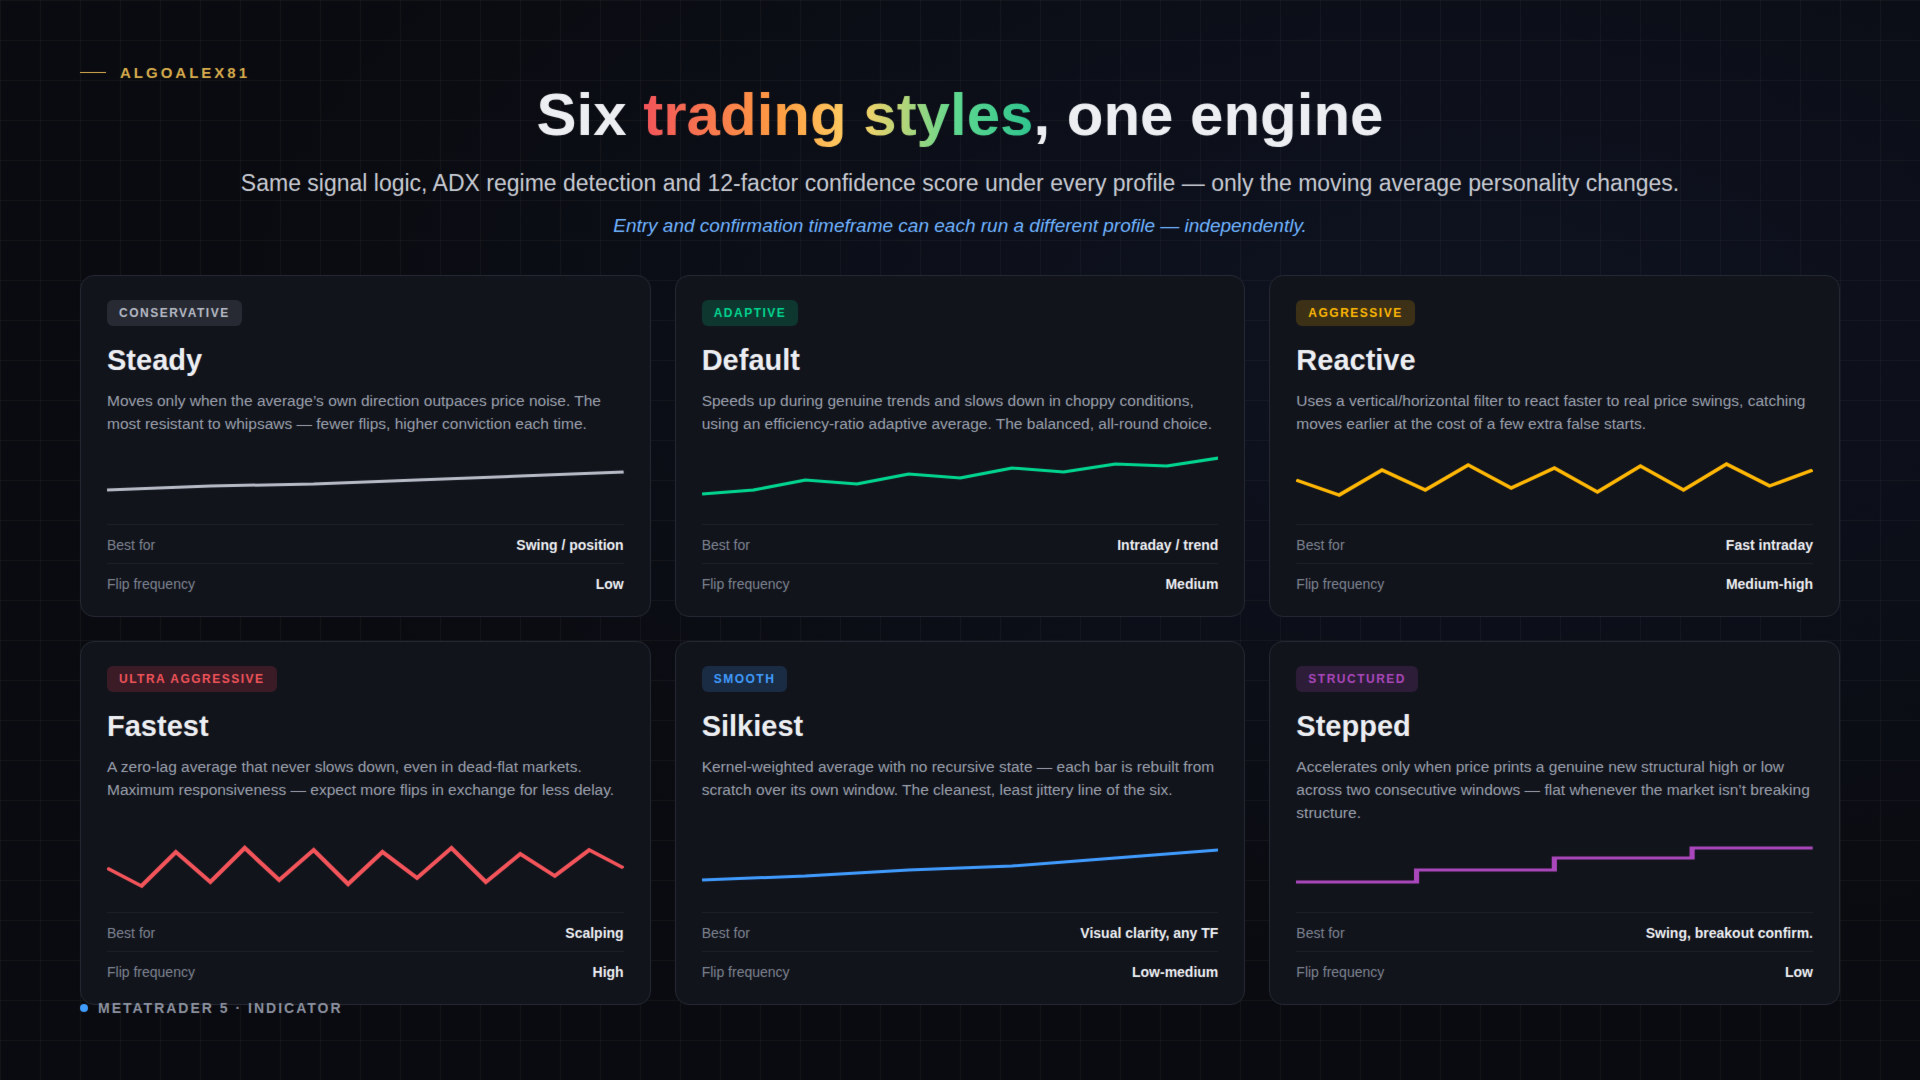
Rather than exposing a long list of technical parameters, Confluence Edge offers four named profiles: 
  • Conservative — moves only on confirmed direction, the most resistant to noise 
  • Adaptive — speeds up in trends, slows down in choppy conditions (the balanced default) 
  • Aggressive —reacts faster to genuine price swings 
  • Ultra Aggressive —fastest response, no slowdown even in flat markets 
  • Smooth — kernel-weighted average with no recursive state; the cleanest, least jittery line of the six
  • Structured — accelerates only when price prints a genuine new structural high or low, flat otherwise
Entry (current timeframe) and Confirmation (higher timeframe) can each run a different profile and a different period, independently. 


Multi-timeframe confirmation, without stacking charts 

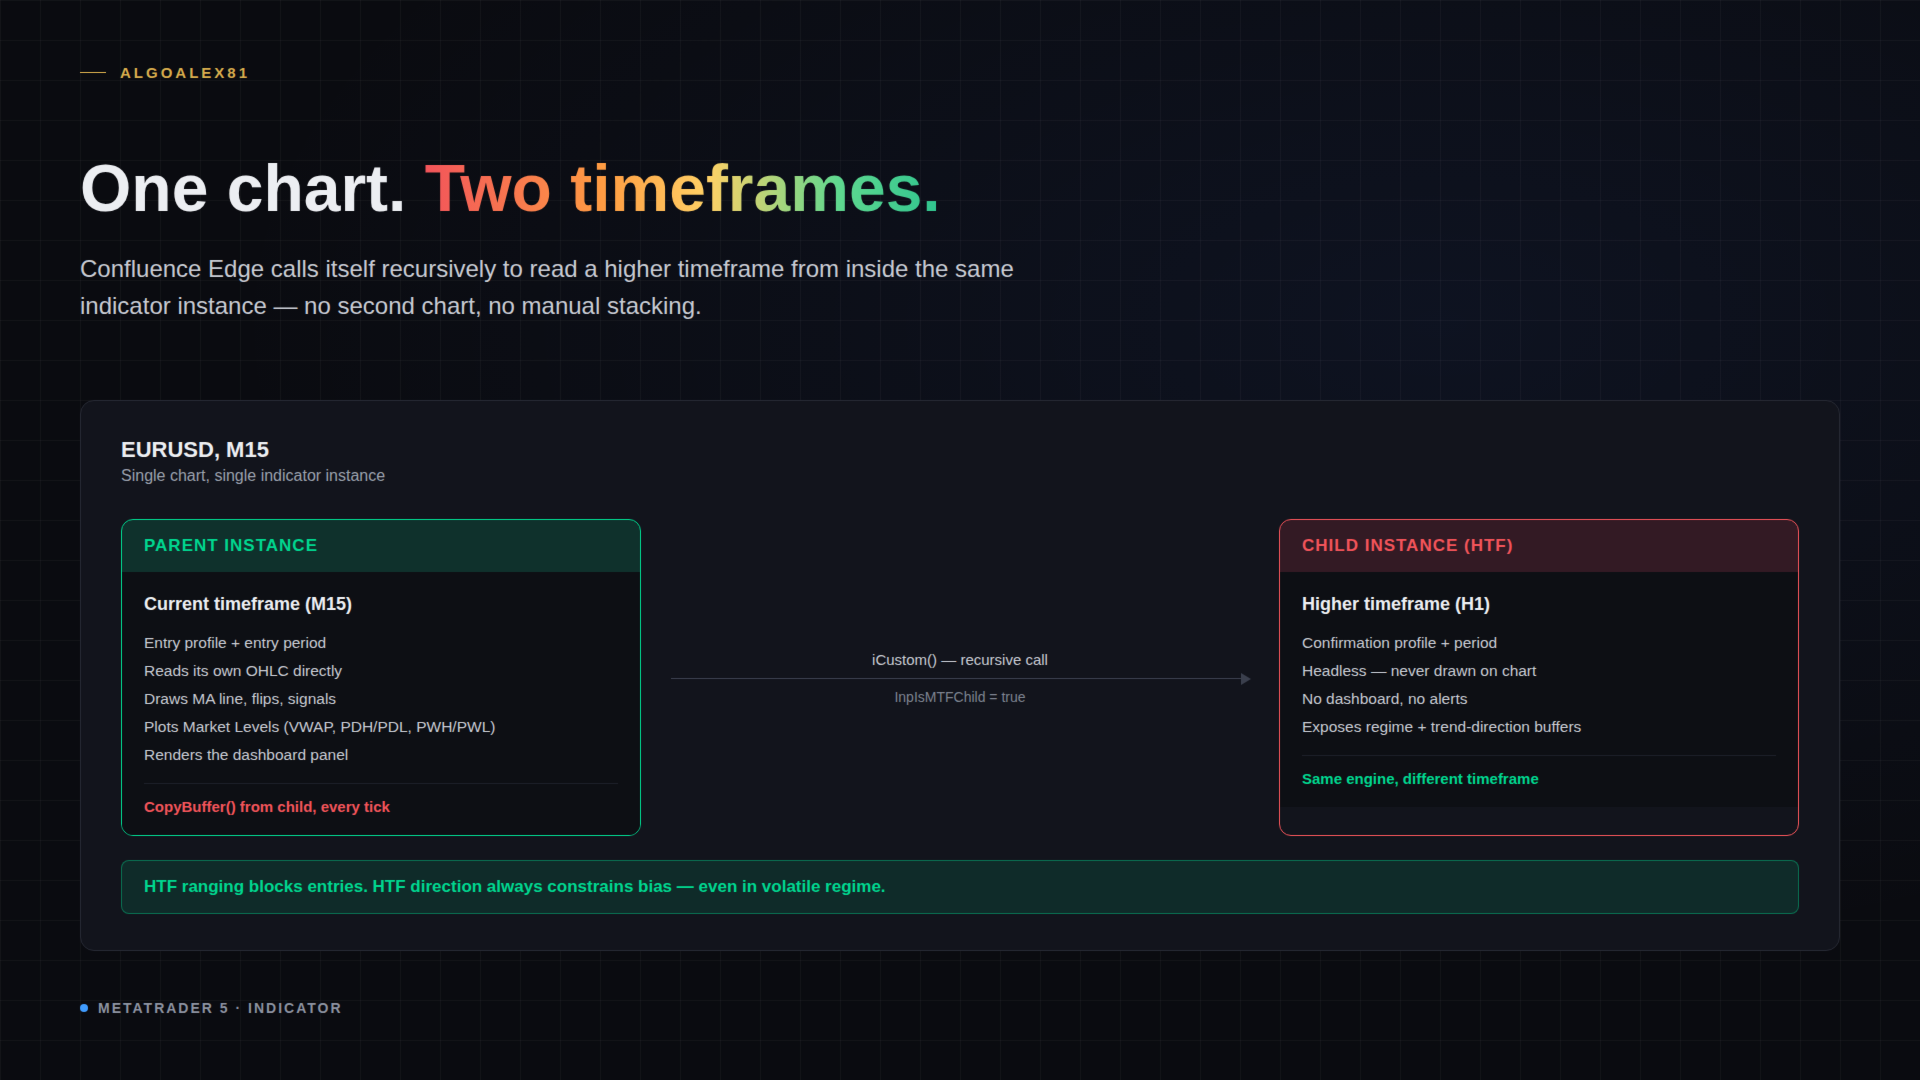
Confluence Edge can read a higher timeframe from inside the same indicator instance, using a recursive call to itself. There's no need to open a second chart or stack multiple 
indicators — the higher-timeframe bias is checked automatically, and a ranging higher timeframe blocks new entries outright. 


Market Levels, plotted and scored

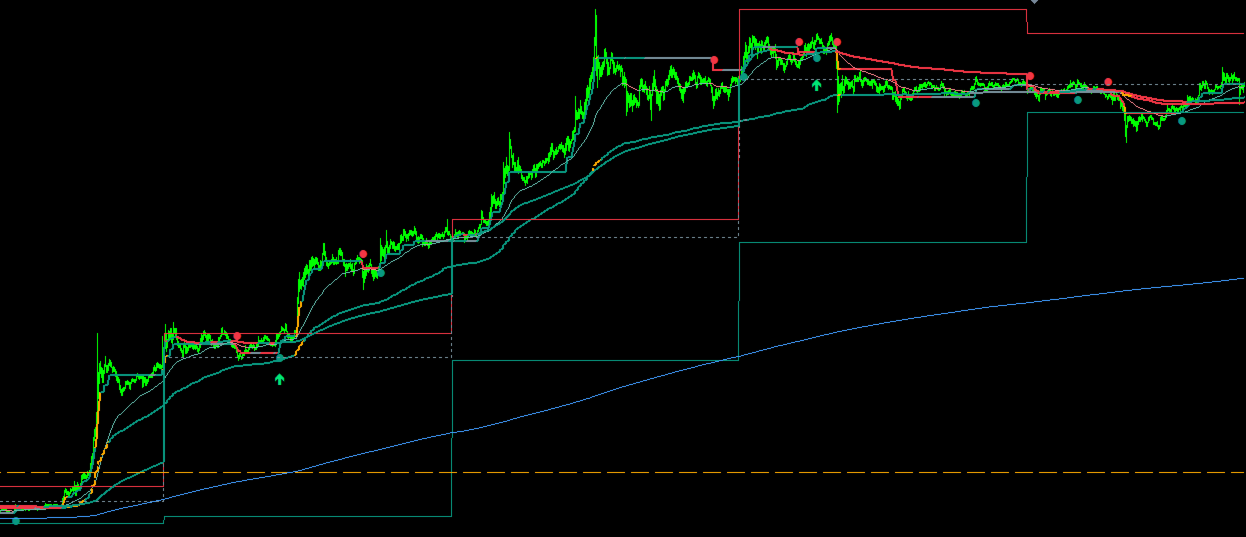
Daily Open, Daily and Weekly VWAP, and the previous day's/week's high and low are calculated with an incremental, stateless engine and plotted directly on the chart — no separate levels indicator needed. Price's position relative to these levels feeds directly into the confidence score.


The panel 

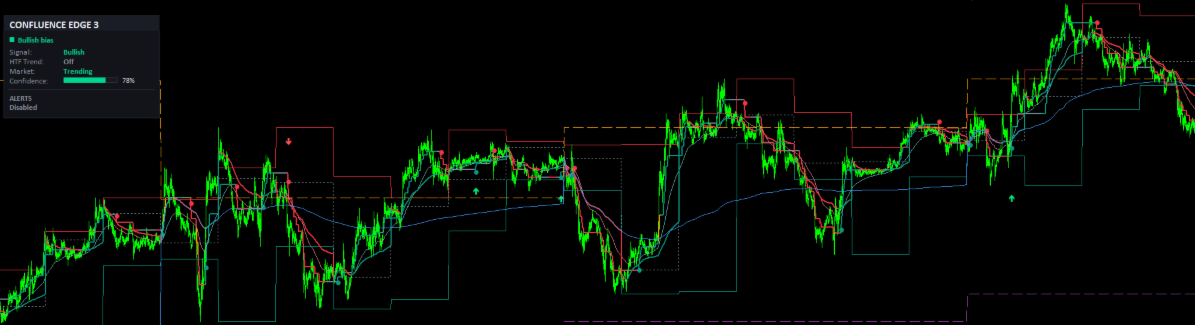
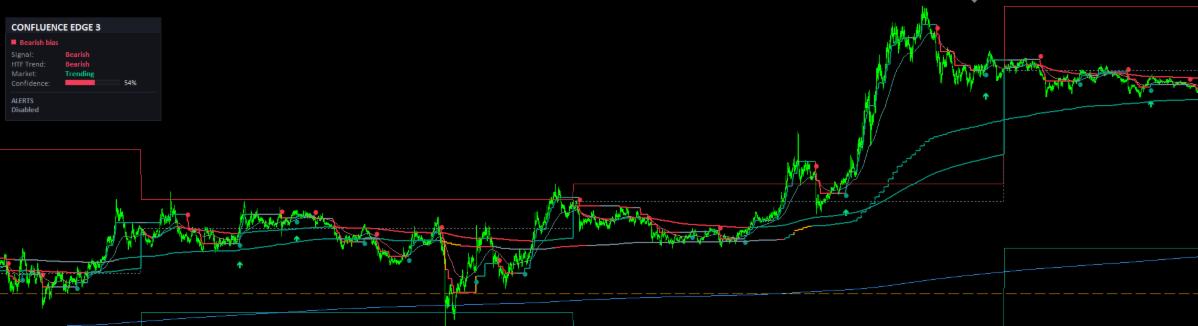
A compact on-chart dashboard shows the current signal, the higher-timeframe trend, the market regime, and the live confidence score — everything you need to check before acting 

on a signal, without digging through buffers or settings. 


Alerts 

Optional alerts on trend flips and on qualified signals, through terminal pop-up, push notification, or email —your choice, independently toggled. A write-once guard means 

each event fires exactly once per closed bar. 


Built for EA integration 

All signal, flip, score, and regime data is exposed through public buffers at fixed indices, readable via standard (CopyBuffer) calls —so Confluence Edge can serve as a building 

block inside your own Expert Advisor, not just a visual tool. 


Who it's for 

Confluence Edge is aimed at discretionary and semi-automated traders working on intraday to swing timeframes who want a configurable trend framework rather than a fixed 
one-size-fits-all average — and who value having a higher-timeframe check built in instead of managing it by hand across multiple charts. 
It is a technical analysis tool. It does not place trades, does not guarantee results, and does not replace risk management or trading judgment. 


Key features

  • 6 selectable trading styles (Conservative / Adaptive / Aggressive / Ultra Aggressive / Smooth / Structured)
  • Independent profile and period for entry and higher-timeframe confirmation 
  • Closed-bar trend flips — no repainting 
  • 0–100 confidence score across 12 factors, including 6 built-in Market Levels checks
  • Daily Open, Daily/Weekly VWAP, and previous day/week high-low plotted live on the chart
  • Automatic market regime detection (trending / volatile / choppy) 
  • Recursive multi-timeframe read from a single chart 
  • Live on-chart dashboard panel 
  • Flip and signal alerts —terminal, push, and email 
  • Public buffers ready for Expert Advisor integration 
  • Self-contained — no external indicator dependencies 


Input parameters 
Timeframe 
Input What it does Suggested Range
HTF Timeframe
 Higher timeframe read via recursive confirmation engine.
Leave on Current for a standalone, single-timeframe read. Current, or one clear step above your trading timeframe


Trading Style

Input What it does Suggested Range
Entry Trading Style
Trend engine profile used on the current chart timeframe (Conservative / Adaptive / Aggressive / Ultra Aggressive/Smooth/Structured).
Adaptive as a starting point; Conservative or Structured for swing, Ultra Aggressive for scalping
Entry Period
Lookback length for the entry engine. Shorter reacts faster, longer is smoother.
20–100
HTF Confirmation Trading Style
Same profile choice, applied to the higher timeframe instance. Ignored when HTF Timeframe = Current.
Adaptive or Conservative, for a steadier confirmation read
HTF Confirmation Period
Lookback length for the confirmation engine. Ignored when HTF Timeframe = Current.
20-100
Smooth Profile — Kernel Relative Weight  Bandwidth weighting used only by the Smooth profile; lower values react faster, higher values approach a pure Gaussian average. Ignored by all other profiles.  4-12

Signal engine

Input What it does Suggested Range
ATR Length ATR period used for both the confidence score and the regime slope measurement.
8–14
Regime Lookback
Number of bars used to classify the market as trending, volatile, or choppy.
30–50
Volatile Regime Threshold
Current ATR vs. its average — above this ratio, the market is tagged volatile.
1.2–1.6
Regime Slope Threshold
Normalized MA slope below which a trending-ADX market is instead tagged ranging.
0.5-2.5
Trend EMA Length
Length of the longer-term EMA used as a directional filter for the confidence score.
40–60
Volume MA Length
Averaging period for the volume component of the confidence score.
15–25
Min Signal Score
Minimum 0–100 confidence score required before a signal is drawn.
>60
Max SD Distance from VWAP Maximum allowed distance from the daily VWAP, in standard deviations, for the SD-distance score component to award points.  1.5-3.0
Climax Filter — Body Average Lookback Number of preceding bars averaged to measure a "normal" candle body size for the Climax Filter.  15-25
Climax Filter — Body vs Average Multiplier A signal bar with a body this many times larger than the recent average is treated as an exhaustion candle and blocked.  2.5
Show Signals
Toggles the Buy/Sell arrow markers on the chart.
On / Off
Signal Cooldown
Minimum bars between two signals, to avoid clustering.
3–8
Arrow Distance
Vertical offset of the signal arrows from price, in ATR multiples.
2–3
 Bull Color / Bear Color  Colors used for the trend line and signal markers.  -

Dashboard

Input What it does Suggested Range
Show Dashboard Panel
Toggles the on-chart status panel.
On / Off

Alerts

Input What it does Suggested Range
Enable Alerts
Master switch for all alert notifications.
Off unless actively monitoring
Alert on Trend Flip
Fires when a confirmed bull/bear flip closes.
On / Off
Alert on Buy/Sell Signal
Fires when a qualified signal (above Min Signal Score) closes.
On / Off
Terminal Alert
Pop-up alert inside the MetaTrader terminal.
On / Off
Push Notification
Sends to the MetaTrader mobile app.
On / Off
Email Alert
Sends via the terminal's configured email.
On / Off
Defaults are tuned to work reasonably out of the box on most intraday timeframes — the ranges above are starting points for fine-tuning, not requirements.


推荐产品
RBreaker
Zhong Long Wu
RBreaker Gold Indicators 是黄金期货一种短线日内交易策略,它结合了趋势跟踪和日内反转两种交易方式,既能捕捉趋势行情的利润,又能在行情反转时及时止盈并顺势反手。 该策略曾连续15年被美国《Futures Truth》杂志评选为前十大最赚钱的交易策略之一,具有很长的生命周期,至今仍在国内外普遍使用与研究。 本指标结合了2026年期货黄金的走势,依据14日ATR指标,分别定义了突破系数A,观察系数B,反转系数R更合理的数值,非常不错的指标,已实现年稳定盈利,值得推荐~ 以上指标适合高波动品种,参数适合期货黄金,股指期货等,如果需要其他品种行情,需要单独设定 突破系数A,观察系数B,反转系数R,进行回测才能使用。 欢迎指标售后有问题可以加+V:504282029
Structure King AI Signal
Shingala Gautamkumar
Structure King AI Signal Structure King AI Signal is a professional MetaTrader 5 trading indicator designed to help traders analyze market structure, trend direction, multi-timeframe confirmation and trade management from one clean dashboard. Key Features • Market Structure & Trend Analysis • BUY / SELL Signals • Multi-Timeframe (HTF) Confirmation • Entry Price Levels • Dynamic Stop Loss (SL) • TP1 / TP2 / TP3 Levels • ATR Volatility Analysis • ADX Trend Strength Filter • Adaptive Market Filter
Divergent Stochastic Filter II Catch Reversals Early, Filter Noise, Trade with Confidence The Edge: Why This Stochastic is Different  Every trader knows the Stochastic oscillator. But knowing when to trust its signals, that's the real challenge. The Divergent Stochastic Filter II transforms this classic indicator into a precision reversal detection system by adding critical elements: divergence intelligence, signal filtering and exhaustion detection.  While standard Stochastic oscillators fire s
Maximum Trend Arrows OT MT5
Mulweli Valdaz Makulana
STRICTLY FOR BOOM INDEX ONLY!!!!! Here I bring the Maximum Trend Arrows OT1.0 MT5 indicator. This indicator is made up of a combination of different trend indicators for entries and exits, for entries an orange arrow will paint on the chart below the current market and a red flag for closing of trades and it produces buy arrows only. When the orange arrow appears, it will appear along with it's sound to notify you. The 1H timeframe is recommended, don't use it anywhere else than on the 1H timefr
TradeAQ
Guo Sheng Zhao
这个量价结构指标是一款适用于   MetaTrader 4 和 MetaTrader 5   的图表分析指标,集量价结构、成交量分布、市场情绪、波动提示和关键价格区域展示于一体。指标直接运行在主图窗口,可帮助交易者快速观察市场的重要价格位置与活跃程度。 主要功能 1. 量价结构支撑与阻力 自动标记连续量价结构形成的潜在支撑位和阻力位,辅助识别价格可能出现停顿、反应或突破的位置。 支持两种分析模式: 成交量结构 价格结构 线条颜色、宽度和样式均可自定义。 2. 成交量尖峰提示 当市场成交量显著放大时,在图表中显示醒目标记,帮助发现异常活跃、加速、衰竭或可能发生方向变化的行情。 可选功能包括: 尖峰图标提示 尖峰价格水平线 高点、低点、收盘价或组合价位显示 自定义成交量阈值 3. 高波动行情提示 自动标记波动明显扩张的 K 线,方便交易者及时发现突破、加速和快速行情。 支持: 高波动图标 关键价格水平线 自定义检测周期与敏感度 自定义线条颜色、宽度和样式 4. 成交量分布 在图表右侧显示指定范围内的成交量分布,直观呈现不同价格区域的交易活跃程度。 主要显示内容包括: 高成交量节点 低成交量
DAILY OH/OL SDEV QUANT MODEL - STATISTICAL TRADING WITH PRECISION RISK MANAGEMENT TRADE WITH MATHEMATICAL CERTAINTY - KNOW YOUR EXACT STOP-LOSS AND TAKE-PROFIT BEFORE YOU ENTER This indicator analyzes 5,000+ days of price history to give you: Exact entry levels (sigma bands locked at daily open) Exact stop-loss distance (from M
PREngulfing
Slobodan Manovski
PR EA - 吞没形态交易系统 自动识别吞没形态,均线确认信号 PR EA是一款MetaTrader 5专家顾问,专门用于识别并交易看涨/看跌吞没形态,并通过移动平均线过滤确认信号。优化适用于30分钟图表,同时兼容M15和H1时间框架。 核心功能: 形态识别 - 精准检测有效的吞没K线形态 趋势确认 - 238周期SMA过滤器(参数可调) 风险管理 - 自定义止损、止盈 + 可选追踪止损 时间框架优化 - 专为M30图表设计(兼容M15/H1) 仓位控制 - 同一时间仅持有一个仓位 推荐设置: 最佳表现:M30时间框架 不建议使用:高于H1的时间框架 自定义选项: 可调整交易手数 灵活设置止损/止盈值 追踪止损功能 均线周期调节 点差过滤,避免低效执行 适合以下交易者: 偏好自动K线形态交易 需要均线确认的反转策略 波段交易(30分钟-1小时图表) 规则明确的交易系统 "通过均线确认的吞没形态交易信号" MT5专用 • 需MetaTrader 5平台 • 兼容所有经纪商
Has rsi signal
Evgenii Savinov
HAS RSI Signal — 带有止损/止盈计算的专业趋势指标 HAS RSI Signal 是一款强大的交易工具,结合了经典指标与现代噪声过滤算法。该指标通过 Heiken Ashi Smoothed (HAS) 平滑蜡烛图和 RSI 震荡指标进行市场分析,在趋势反转或价格退出超买/超卖区域时,为交易者提供清晰的人场信号。 主要优势: 双重过滤: 使用 Heiken Ashi Smoothed 算法消除市场“噪音”,同时通过 RSI 确认动能强度。 自动计算点位: 指标不仅提供信号,还会根据当前市场波动率 (ATR) 自动计算 止损 (Stop Loss) 和 止盈 (Take Profit) 点位。 视觉直观: 信号以彩色蜡烛图的形式直接显示在主图表上,保持交易界面的整洁有序。 多维度通知: 内置终端弹窗警报、声音提示以及手机推送通知 (Push),确保您不会错过任何交易机会。 核心原理: 指标持续监控 RSI 的极端区域。当价格离开临界区且 HAS 算法确认方向转变时,即生成交易信号。ATR 参数允许止损和止盈根据市场当前的波动性进行动态调整。 核心参数设置: InpPeri
# RSI Pro Alert - 高级RSI指标 一款功能强大的专业级RSI指标,具备智能警报、定时快照和多维度通知功能,助您精准把握市场机会! --- ## 核心特性 ### 智能信号识别 - **精准交叉检测** :自动识别RSI穿越超买/超卖水平的关键时刻 - **状态跟踪机制** :实时监控市场状态变化(超买/超卖/中性) - **首次加载通知** :指标加载时立即报告当前市场状态 ### 多维度警报系统 - **弹窗警报** :MT5原生弹窗提醒 - **声音警报** :支持自定义买入/卖出提示音 - **文件通知** :自动生成带时间戳的警报日志文件 - **冷却机制** :可自定义警报间隔,避免频繁打扰 ### 定时快照功能 - **定期报告** :可设置15分钟/30分钟/60分钟等间隔自动生成市场快照 - **完整信息** :快照包含RSI值、价格、状态、交易建议等完整信息 - **历史记录** :所有快照自动保存,便于复盘分析 ### 个性化定制 - **自定义水平** :支持调整超买(默认70)和超卖(默认30)
ATrend
Zaha Feiz
4.83 (18)
ATREND: 工作原理及使用方法 工作原理 “ATREND”指标针对MT5平台设计,旨在通过结合多种技术分析方法为交易者提供强有力的买卖信号。该指标主要利用平均真实波幅(ATR)来测量波动性,并结合趋势检测算法来识别潜在的市场动向。 购买后请留言,您将获得特别的赠品。 主要特点: - 动态趋势检测:该指标评估市场趋势并相应调整信号,帮助交易者与当前市场条件对齐策略。 - 波动性测量:通过使用ATR,该指标衡量市场波动性,这对于确定最佳止损(SL)和止盈(TP)水平至关重要。 - 信号可视化:该指标在图表上直观地表示买卖信号,增强交易者的决策能力。 操作步骤 输入和设置: - 时间框架:此输入允许您设置指标计算的主要时间框架,默认值为15分钟。 - 时间框架2:此输入可用于定义额外分析的辅助时间框架,默认值为1分钟。 - 移动:此参数允许您将指标的计算向回移动,默认值为0。 - SLATR:此输入定义用于根据ATR计算止损水平的乘数,默认值为2.56。 - TPATR:此输入定义用于根据ATR计算止盈水平的乘数,默认值也为2.56。 - AlertsOn:启用或禁用交易信号的警报,
PipFinite Trend PRO MT5
Karlo Wilson Vendiola
4.84 (560)
Breakthrough Solution For Trend Trading And Filtering With All Important Features Built Inside One Tool! Trend PRO's smart algorithm detects the trend, filters out market noise and gives entry signals with exit levels. The new features with enhanced rules for statistical calculation improved the overall performance of this indicator. Important Information Revealed Maximize the potential of Trend Pro, please visit www.mql5.com/en/blogs/post/713938 The Powerful Expert Advisor Version Automatin
Mario Order Blocks
Sandeep Kumar Tiwary
Mario Order Block Indicator Overview The Professional Order Block Indicator is an advanced technical analysis tool that automatically identifies and displays institutional order blocks on your chart. Based on smart money concepts, this indicator helps traders identify high-probability support and resistance zones where institutional traders have placed significant orders. Key FeaturesAutomatic Order Block Detection Identifies bullish and bearish order blocks based on pivot point analysis Uses so
Daily Entry m1
Ibrahim Aljaref
Daily Entry M1 – MT5 指标 Daily Entry M1 是一款为 MetaTrader 5 开发的指标,专为专注于 M1 时间周期短线日内交易机会的交易者设计。 该指标会分析市场状况,并在其内部入场条件得到确认后,直接在图表上显示清晰的 BUY 和 SELL 箭头。 该指标旨在寻找潜在的市场转折区域,并尝试识别接近日内顶部或底部的入场机会,帮助交易者专注于可能的反转机会,而不是随机的市场位置。 每个交易箭头都带有其自身预设的目标水平,使交易者能够立即看到与该特定信号相关的目标。 Daily Entry M1 的主要目标是提供一个简洁且实用的交易环境,让交易者能够快速识别入场信号及其对应目标,而不会让图表变得过于复杂。 主要功能 专为 MetaTrader 5 设计 针对 M1 时间周期进行优化 清晰的 BUY 和 SELL 入场箭头 尝试识别接近潜在市场顶部和底部的入场机会 专注于可能的日内反转区域 每个箭头都包含其自身目标 目标水平与对应信号相关联 内置新交易信号提醒 支持 MetaTrader 5 推送通知 当出现新的 BUY 或 SELL 信号时可以接收通
BTC Trend Scalper MT5 趋势捕捉版 — 针对 BTCUSD 的精准动量交易 大家好,交易者们! 我是   BTC Trend Scalper MT5   — 一个智能的比特币交易专家顾问,旨在通过纪律严明的风险管理捕捉动量行情。 我 不是 马丁格尔策略。 我 不是 网格系统。 我 不是 赌博机器人。 我是一个 趋势跟踪型 scalper ,专为那些明白保护资本比追逐每一根蜡烛更重要的交易者而设计。 我的专长是什么? 比特币 (BTCUSD) 我的使命是什么? 在严格控险的同时,捕捉高概率的方向性行情。 为什么叫“趋势捕捉”? 许多比特币 EA 试图预测顶部和底部。 许多 scalper 对市场的每一次波动都过度交易。 我采取不同的方法。 我等待。 我通过蜡烛结构识别动量,通过趋势分析确认方向,然后仅在市场条件一致时入场。 当动量出现时,我参与。 当动量消失时,我离开。 没有情绪。 没有犹豫。 我的三层智能系统 第一层:动量蜡烛识别 我的入场系统刻意简单而有效。 对于买入: 前一根蜡烛收盘看涨。 对于卖出: 前一根蜡烛收盘看跌。 如果启
IVISTscalp5
Vadym Zhukovskyi
5 (6)
[iVISTscalp5]:通过时间研究市场行为的实验室 TLV Framework | Liquidity Activation Points ⸻ 项目概述 iVISTscalp5 是在 VISTmany 项目框架下开发的多层级时间与价格结构指标。 该系统通过 Liquidity Activation Points(时间激活点 / timings)预测: 市场启动时间 方向 运动范围 iVISTscalp5 指标可使用默认参数应用于任何金融工具。 ⸻ 实际价值 iVISTscalp5 并不是作为传统技术指标而开发的。 它的核心理念是: 让任何人都能够通过“时间”研究市场行为。 ⸻ Time Language VISTmany (TLV) — 项目的核心概念 t(p) t(p) 是 timings 被激活的价格水平。 ⸻ p(p) p(p) 是 iVISTscalp5 指标构建的核心价格水平。 最强的市场反应通常出现在: t(p) 与 p(p) 相互作用时。 ⸻ 在 TLV(Time Language VIST
Naturu
Ivan Stefanov
5 (1)
“Naturu” 是一个使用大自然对称性作为算法的手动指标。 用简单策略和隐藏智慧,掌控市场! 加载指标后,您会看到两条线——上线(Top)和下线(Bottom)。 单击一次即可激活某条线。要移动,只需点击您想放置该线的那根K线。 您设定一个高点和一个低点,指标会自动计算: 洋红色区域,显示多空双方兴趣最接近之处,也就是最有可能成为支撑/阻力的区域。 灰色区域,标示下一层次的关注区。 青绿色线条,表示多方的目标价位。 金色线条,表示空方的目标价位。 手动指标赋予您完全的控制和灵活性,让您根据实时市场环境和个人直觉调整级别。它们迫使您更深入地亲自分析价格走势,帮助您真正理解支撑、阻力和形态是如何形成的。依靠人工判断,可以过滤掉自动系统常常误判的大量“噪音”,减少错误信号。而且,因您亲自设定每个级别,可在突发新闻或极端行情时立即调整,无需等候代码更新。 隐藏于简单游戏背后的神圣力量!
WanaScalper
Isaac Wanasolo
1 (1)
A scalping indicator based on mathematical patterns, which on average gives signals with relatively small SL, and also occasionally helps to catch big moves in the markets (more information in the video) This indicator has three main types of notifications: The first type warns of a possible/upcoming signal on the next bar The second type indicates the presence of a ready signal to enter the market/open a position The third type is for SL and TP levels - you will be notified every time price re
Noize Absorption Index
Ekaterina Saltykova
Noize Absorption Index - is the manual trading system that measures the difference of pressure between bears forces and bulls forces. Green line - is a noize free index that showing curent situation. Zero value of index shows totally choppy/flat market.Values above zero level shows how powerfull bullish wave is and values below zero measures bearish forces.Up arrow appears on bearish market when it's ready to reverse, dn arrow appears on weak bullish market, as a result of reverse expectation.
Manyal trading system, CovEchoTrend Robot, focuses on reliability and flexibility. By employing statistical analysis methods to study the relationships between the base indicator and market patterns, the system enables a deeper understanding of market processes. Intelligent pattern analysis: The application of statistical data processing helps identify key trend reversal points more accurately, signaling significant market shifts. Informed decision-making is based on the intersection of indicato
# 回撤指标 V4.0 - 掌控交易的必备工具 ## 通过完整的实时绩效概览改变您的交易 在要求严苛的外汇和差价合约交易世界中,**了解您的实时绩效**不是奢侈品,而是**绝对必需**的。**回撤指标 V4.0** 不仅仅是一个简单的指标:它是您的**专业仪表板**,为您提供清晰、精确和即时的交易账户状态视图。 --- ## 为什么这个指标将永远改变您的交易 ### 90% 交易者面临的问题 您是否曾经遇到过以下情况之一? **您不确切知道自己的状况** - 您的 MT5 平台显示数字,但您必须心算您的真实表现。 **您发现回撤为时已晚** - 当您意识到已经损失了 15% 的资金时,已经太晚了,无法有效应对。 **您缺乏历史可见性** - 无法快速知道本周、本月或今年是否盈利。 **您浪费时间分析交易** - 您必须打开多个窗口、进行计算,并失去对市场的关注。 **您没有概览** - 有多少持仓?我的全局盈亏是多少?我今天的表现如何? ### 解决方案:一体化专业仪表板 **回撤指标 V4.0** 通过提供一个**完整的控制面板*
该指标的独特优势在于其基于 Arjo 设计和开发的“公允价值缺口理论”。Arjo 是一位顶尖的导师,而我本人则在此基础上进行了开发完善。该系列视频将包含完整的 YouTube 链接,提供详尽的讲解,并附有编译后的 MT4/MT5 系统运行的截图。 所有发布的系统都将分别提供 MT4 和 MT5 版本,以满足不同平台和用户的需求。 所有购买该系统的 100 位客户都将获得一项额外福利:购买 Pine 脚本工具后,即可在 Trading View 上免费使用该系统。 链接: https://youtu.be/gT5SFdwIYC0?si=L_ldI4E_pCx4gVhL 您将获得: 1. 根据链接中的说明,自动检测并绘制看涨/看跌公允价值缺口框。 2. 隐蔽突破缺口信号 3. 突破缺口信号 4. 推送(通知)提醒指标(可选) 5. 该系统适用于所有时间周期。推荐时间周期:15分钟、1小时、4小时和日线。 总结:这仅仅是我们征程的开始,我们将根据用户需求定期更新更多功能、开发和升级,欢迎随时评论或私信我们提出任何问题。很遗憾,我们目前不提供演示下载,但我们保证,为了满足所有用户的需求,我们
Trend Master V2
Oratile Pitsoane
What Is Trend Master Pro? Trend Master Pro   is a professional-grade trend trading indicator built for MetaTrader 5. It was designed with one goal in mind — to keep you on the right side of the market at all times by combining three powerful technical tools into a single, clean, easy-to-read display directly on your price chart. Instead of cluttering your screen with multiple separate indicators, Trend Master Pro fuses an   EMA Ribbon trend filter , a   ZigZag swing point engine , and a   breako
Mega Indicator MT5
Szymon Palczynski
Price reach indicator. It also serves as the perfect term for supports and resistance. I use it in two experts. The basic tool for professional trading. The indicator analyzes the last 500 bar and uses this to determine the levels ( but it doesn't predict the future ) . Personally, I use it on TF H1.  It is very simple. Four lines on chart and that's all. Only two input parameters.  Thousands of indicators. Why this? Is good ? No! Is very good. Please test the indicator prior to purchasing. You
Potential Reversal Price (PRP) Indicator - Ultimate Sniper Entries for XAUUSD Discounted   Price   !!     Secure your lifetime access   now   before it switches to   subscription-only ! Welcome to the Potential Reversal Price (PRP) Indicator , your ultimate trading tool designed to catch high-probability market reversals with extreme precision. Built for serious traders who demand accuracy, the PRP Indicator combines advanced market structure analysis with momentum exhaustion to pinpoint the exa
KMB Smart Pattern Analyzer PRO
Karwan Msto Mohammed Mohammed
产品概述 KMB Smart Pattern Analyzer PRO 是一款高级技术分析指标,旨在用户自定义的图表区间内识别并排序高匹配度的市场形态。 该指标将多个分析引擎整合到一个专业工具中: K线形态分析 经典图表形态识别 谐波结构识别 智能市场结构 / SMC 分析 与在整个图表上显示随机信号不同,该指标允许用户专注于特定的市场区域,并获得最强形态匹配、预期方向、突破水平、失效水平以及预测目标区域的结构化分析。 这使其非常适合希望以更清晰、更专业的方式分析价格行为和形态结构的交易者。 主要功能 识别并排序 Top 3 最佳匹配形态 支持: K线形态 经典图表形态 谐波形态 市场结构 / SMC 逻辑 用户自定义区间分析 显示: 形态类型 市场方向 Score 动量 突破水平 T1 / T2 / T3 目标水平 失效水平 市场结构信息 在图表上显示所选分析区域 可拖动并移动分析区域 清晰专业的信息面板 支持浅色和深色图表主题 适用于主观交易者、形态交易者和技术分析师 工作方式 将指标添加到图表。 选择或移动分析区域。 指标扫描所选区域。 对最强的形态候选进行排序。 面板显示最佳匹
FREE
SMC Indicator BOS And CHoCH
Massimiliano Tuzzolino
SMC Indicator BOS & CHoCH analyze market structure using Smart Money Concepts The indicator combines BOS (Break of Structure), CHoCH (Change of Character), Fair Value Gaps (FVG), Liquidity Sweep logic and ATR filtering to provide a structured view of market movements and potential trading opportunities. The indicator automatically identifies swing highs and swing lows and monitors structural breaks in the market. BOS (Break of Structure) identifies potential continuation of the current market st
Footprint 是一款用于分析订单流 (Order Flow) 和成交量的指标。 它有助于在聚类层面识别市场结构,寻找活动增加的关键区域,并直接在图表上使用过滤器,无需不断打开设置窗口。 Footprint 指标功能 Bid x Ask, Delta 聚类图表; 图表上的控制面板; 用于调整过滤器的滑块; Absorption; Initiative; Stacked Imbalances; Big Trades; dPOC / Dynamic Point of Control; Delta; 侧边市场轮廓 (Market Profile); 累计 Delta (Cumulative Delta)。 核心优势 在密集的 Tick 流上快速计算和渲染数据; 图表内管理 — 主要模式和过滤器可直接在图表上切换,无需打开设置; 通过过滤突出显示重要的价格水平和聚类; 视觉信号高亮:吸收、主动性、失衡和大单交易; 按日、周或当前可见范围显示的侧边轮廓; 包含总成交量、Delta 和累计 Delta 的面板。 Footprint 帮助您确定: 重要成交量集中的位置; 主动性压力出现的位置;
SMC Smart Flow Pro
Thitipong Nookhunthod
Short Description: SMC Smart Flow Pro is an advanced Smart Money Concept indicator that automatically detects Break of Structure (BOS), Change of Character (CHoCH), and projects precise TP/SL target levels on all timeframes — built for serious traders who trade with institutional flow. Full Description: SMC Smart Flow Pro is a premium Smart Money Concept (SMC) indicator for MetaTrader 5, engineered for traders who want to trade alongside institutional order flow. By automatically mapping m
CosmiCLab FIBO
Kirils Subins
CosmiCLab SMC FIBO CosmiCLab SMC FIBO is a professional trading indicator designed for traders who use Smart Money Concepts (SMC), market structure analysis and Fibonacci retracement levels. The indicator automatically detects market swings and builds Fibonacci levels based on the latest impulse movement. It also identifies market structure changes such as BOS (Break of Structure) and CHOCH (Change of Character), helping traders understand the current market direction. CosmiCLab SMC FIBO also pr
该产品的买家也购买
Neuro Poseidon MT5
Daria Rezueva
4.8 (54)
Neuro Poseidon is a new indicator by Daria Rezueva. It combines precise trading signals with adaptive TP/SL levels - creating best possible trades as a result! Message me and get  Neuro Poseidon Assistant  as a gift to automize your trading process! What makes it stand out? 1. Proven profitability on all assets and timeframes 2. Only confirmed BUY and SELL signals present on the chart 3. Adaptive TP & SL levels generated by the software for each trade 4. Easy to understand - suitable for al
UZFX {SSS} 超短线智能信号 v5.0 MT5 是一款无重绘的高性能交易指标,专为在快速波动的市场中需要精准、实时信号的超短线交易者、日内交易者和波段交易者设计。该指标由 (UZFX-LABS) 开发,融合了价格行为分析、趋势确认和智能过滤技术,可在所有货币对和时间周期内生成高概率的买卖信号、预警信号以及趋势延续机会。 别再对交易犹豫不决了,开始遵循这一专为追求清晰、精准和纪律性市场执行的交易者设计的结构化信号系统吧。 相信我,这是 MQL5 上最优秀的指标之一,所以千万不要错过!!“为睿智交易者打造的智能信号” 最新 5.0 版本现已发布,价格可能会在未事先通知的情况下上涨至 499.99 美元,所以请尽快入手,以免错失良机!! 最终购买前!如果您想获取免费试用版,请通过 WhatsApp 号码 +923030751987 联系我!! 如果您遇到任何问题“或”有任何不明白的地方,请在私聊中向我咨询!!! 主要功能更新 • 自动买入和卖出信号检测 • 先进的反转识别逻辑 • 潜在市场反转前的预警信号 • 趋势延续确认信号 • 内置风险管理功能,包含入场点、止损点、TP1、
Azimuth Pro
Ottaviano De Cicco
5 (7)
Azimuth Pro V2:MT5合成分形结构分析与确认入场 概述 Azimuth Pro 是 Merkava Labs 推出的多层级波段结构指标。四层嵌套波段层级、锚定波段的VWAP、ABC形态识别、三时间框架结构过滤以及收盘确认入场——一个图表,一个从微观波段到宏观周期的完整工作流程。 这不是盲目的信号产品。它是一个以结构为先的工作流程,专为重视位置、背景和时机的交易者打造。 ️ 夏季促销 — 庆祝夏至与 The Oracle Pro 上市:Azimuth Pro 七折优惠,现价 279 美元(原价 399 美元)。限时夏季优惠。 1. V2的变化 合成多时间框架引擎 高时间框架分析从零开始重建,采用与Meridian Pro相同的专有合成架构。更清晰的HTF背景、稳定的实时行为、无经典MTF同步问题。合成引擎还解锁了 固定比率时间框架级联 (x2、x3、x4、x6)——不再在经纪商的固定时间框架之间任意跳转,您可以按图表时间框架的固定倍数分析结构,在每个尺度上保持相同的分形关系。 确认入场箭头 作为稳定且可恢复的执行层而设计的收盘确认箭头。当ABC设置形成且自适应确认逻辑
TrendMaestro5
Stefano Frisetti
note: this indicator is for METATRADER4, if you want the version for METATRADER5 this is the link:  https://www.mql5.com/it/market/product/108106 TRENDMAESTRO ver 2.5 TRENDMAESTRO recognizes a new TREND from the start, he never makes mistakes. The certainty of identifying a new TREND is priceless. DESCRIPTION TRENDMAESTRO identifies a new TREND in the bud, this indicator examines the volatility, volumes and momentum to identify the moment in which there is an explosion of one or more of these da
Boom & Crash & PainX & GainX Ultimate Spike Detector Trade Spikes With Confidence — Not Guesswork Catching spikes should be one of the most profitable strategies in synthetic markets. But for most traders, it becomes one of the most frustrating. You enter too early… price goes against you. You wait for a spike… it never comes. You finally catch one… but don’t know whether to hold or close. You make profit… then give it all back because there’s no exit plan. This is exactly the problem the Ultim
Gem SIGNAL
Shengzu Zhong
5 (1)
GEM Signal Pro GEM Signal Pro 是一款適用於 MetaTrader 5 的趨勢跟隨指標,專為希望在圖表上獲得更清晰訊號、更有結構的交易設定,以及更實用風險管理的交易者而設計。 它不僅僅顯示一個簡單的箭頭,GEM Signal Pro 還能以更清晰、更易讀的方式呈現完整的交易思路。當條件確認完成後,指標可在圖表上顯示進場價、止損價與止盈目標,幫助交易者更有效率地評估交易設定。 運作方式 該指標首先根據其內部邏輯識別有效的初始訊號。 當確認條件滿足後,GEM Signal Pro 會在圖表上顯示完整的交易設定。這讓交易者可以更清楚地看到交易結構,並減少手動分析與計算的工作量。 圖表上的交易價位 對於已確認的訊號,GEM Signal Pro 可顯示: 進場價 止損價 止盈 1 止盈 2 止盈 3 風險報酬比 這讓交易設定更容易理解,也有助於讓圖表分析更有條理。 內建風險管理 風險管理是此指標設計的重要部分。 止損位基於近期市場結構,結合附近的擺動高低點與可選的 ATR 緩衝距離。這能讓交易價位更貼近當前市場條件,而不只是依賴固定距離。 圖表資訊面板 GEM Si
PrimeScalping
Temirlan Kdyrkhan
PrimeScalping is a powerful trading companion designed to generate high-probability entry signals with dynamic TP/SL/DP levels based on volatility. Built-in performance tracking shows win/loss stats, PP1/PP2 hits, and success rates — all updated live. Key Features: Buy/Sell signals with adaptive volatility bands Real-time TP/SL/DP levels based on ATR Built-in MA Filter with optional ATR/StdDev volatility Performance stats panel (Success, Profit/Loss, PP1/PP2) Alerts via popup, sound, push, or e
Ace Trend
Mikhail Sergeev
5 (3)
我们为您呈现一个革命性的指标,它改变了趋势交易世界的游戏规则。 该指标旨在重新思考性能并将您的交易体验提升到前所未有的高度。 我们的指标拥有先进功能的独特组合,使其有别于竞争对手。 "真实定价因素"的先进技术即使在最困难和最不稳定的市场条件下也能确保无与伦比的稳定性。 告别不稳定的模式,破碎的指标,欢迎有意识的,受控的交易。 该指标不仅仅是一个美丽的画面! 指标应该将赔率转移到交易者身边,从而赚取利润。 熟悉基于指标信号的交易结果(全自动模式): https://www.mql5.com/zh/signals/2339244 AceTrend在根据RBTI版本的趋势指标排名中排名第一。 AceTrend-最大的盈利能力和交易控制. 我们的指标根据当前市场报价而不是历史来突出盈利能力。 加入革命-释放您的交易经验的潜力! 指标不会在已形成的柱上重绘。 如果柱形已形成,指标读数保持不变。 该指标适用于从M1到MN的任何时间框架。 标准是H1时间框架。 您的反馈非常重要! 您有任何问题,建议,或只是想分享您的意见? 写评论或发送消息-我总是保持联系! 指标参数: PreSets - 如果选择
FX-AIEA 供给需求区智能识别指标(Supply and demand indicators MT5) 版本:2.51 | 适用平台:MetaTrader 5  为什么交易需要供给需求区? 供给需求区是机构订单流的核心体现,比传统支撑阻力更精准地反映真实买卖力量。但手动绘制不仅耗时,而且主观性强、容易错过关键区域。 FX-AIEA 供给需求区指标 采用自适应 ZigZag 算法,自动识别高概率供需区域,并将它们以彩色矩形直观标注在图表上,让您一眼看清当前市场的“禁区”与“机会区”。 核心特性 全自动绘制 + 实时刷新 基于改良版 ZigZag 动态提取有效波峰波谷,精准定位潜在供给区(红色)与需求区(天蓝色)。 新 K 线自动更新:指标使用 MQL5 原生  prev_calculated  机制,每出现一根新 K 线即重新计算并重绘区域,永远不会“卡住不刷新”。 支持手动刷新(双击图表或切换周期),确保数据始终同步。 灵活的时间框架 Forced_TimeFrame  参数:可强制指标运行在任意周期(如小时图加载指标,但基于日线计算区域)。 默认跟随当前图表周期,满足日内、波段、

KT Alpha Hunter Arrows MT5
KEENBASE SOFTWARE SOLUTIONS
大多数箭头指标只给你一个信号,然后让你自己去判断剩下的一切。KT Alpha Hunter Arrows 为你提供完整的交易计划。 每一个信号箭头出现时,都会同时绘制一套完整计划:入场线、止损位、四个止盈目标,以及实时优势判断,告诉你当前这个交易品种和时间周期是否值得交易。随附的 Trade Manager EA 会在你手动入场后负责后续执行,让你在市场波动剧烈、情绪干扰明显时也能保持交易纪律。不重绘。仅在K线收盘后确认信号。适用于 Forex、黄金、指数以及任何你在 MT5 上交易的品种。 核心功能 不重绘买入和卖出箭头,只在K线收盘后生成。 每个信号都会显示入场线、结构性止损位和四个止盈目标。 Edge Dashboard 会分别评估当前图表上的买入和卖出机会。 判断系统包括:No Edge、Marginal、Tradeable、Good 或 Strong。 一键 Auto Optimize 按钮可根据当前品种和时间周期自动优化设置。 完整套装包含 Trade Manager EA,并提供五种专为本指标设计的预设交易管理方案。 Prop Firm Risk Panel 可在图表上
SmartScalping
Temirlan Kdyrkhan
SmartScalping is a powerful trading companion designed to generate high-probability entry signals with dynamic TP/SL/DP levels based on volatility. Built-in performance tracking shows win/loss stats, PP1/PP2 hits, and success rates — all updated live. Key Features: Buy/Sell signals with adaptive volatility bands Real-time TP/SL/DP levels based on ATR Built-in MA Filter with optional ATR/StdDev volatility Performance stats panel (Success, Profit/Loss, PP1/PP2) Alerts via popup, sound, push, or e
ScalpPoint
Temirlan Kdyrkhan
ScalpPoint is a powerful trading companion designed to generate high-probability entry signals with dynamic TP/SL/DP levels based on volatility. Built-in performance tracking shows win/loss stats, PP1/PP2 hits, and success rates — all updated live. Key Features: Buy/Sell signals with adaptive volatility bands Real-time TP/SL/DP levels based on ATR Built-in MA Filter with optional ATR/StdDev volatility Performance stats panel (Success, Profit/Loss, PP1/PP2) Alerts via popup, sound, push, or emai
ZAB Supply Demand MTF automatically detects institutional supply and demand zones across up to 9 timeframes and draws them directly on your chart. Based on Sam Seiden's methodology, this indicator identifies the exact zones where banks and institutions placed their orders. Why This Indicator? Unlike basic support/resistance tools, ZAB Supply Demand MTF classifies every zone by its formation pattern and merges overlapping zones from different timeframes into high-probability confluence areas. Key
TrendProMaster
Temirlan Kdyrkhan
MasterTrend Indicator for MT5 A powerful trend-following and signal-evaluation tool MasterTrend   is a custom MT5 indicator that combines Moving Averages and ATR-based risk/reward logic to generate clear buy/sell signals. It visualizes dynamic SL/TP levels, evaluates past trade outcomes, and displays win/loss statistics in a clean on-chart panel. Key features include: Buy/Sell signals based on MA crossovers ATR-based SL/TP1/TP2/TP3 levels with visual lines and labels Signal outcome tracking wit
Transaction Speed MT5
Ivan Stefanov
5 (4)
当然,以下是翻译成中文(简体)的版本: 该指标标出市场中显现出 交易兴趣 的区域,并随后显示 订单积累区域 。它的工作方式类似于大规模的订单簿。 这是为 大资金 打造的指标,性能卓越。市场中有任何兴趣,你都能通过它清晰看到。 (这是一个 完全重写的自动化版本 —— 不再需要手动分析。) 交易速度 是一个全新的概念指标,它显示了市场上大订单 何时 、 何地 聚集,并揭示了其背后的意义。它可以在 非常早期 就检测到趋势的变化。 在外汇市场,所谓的“交易量”实际上是误导性的,因为那指的是价格在单位时间内的变化,因此真正的名称应是“交易速度”。 一切都取决于我们如何思考、如何行动、如何分析。 改变分析范式至关重要。 该指标完全重构了外汇市场上“交易量”的概念,用逻辑方式重新定义并应用,从而成为一个 独特而精准的工具 。 使用方法: 默认情况下,指标处于 自动模式 ,可独立用于任何时间周期。如果你希望切换到手动模式,只需点击 Auto / Manual Mode 按钮即可。 在 手动模式 下,所有计算从 2025年1月1日 开始。你可以根据需要更改该日期,以查看不同的分析结果。 最优数据周期
Introducing the South African Sniper Indicator Created by a dedicated team of South African traders with years of profitable experience in the financial markets, the South African Sniper Indicator is designed to give traders a sharp edge — combining simplicity, precision, and power in one tool. This is a plug-and-play indicator for MT5, built to deliver accurate BUY and SELL (Sniper Entry) signals — complete with target levels and automated trailing stops. Whether you trade forex, indice
RelicusRoad Pro MT5
Relicus LLC
4.96 (24)
RelicusRoad Pro: 量化市场操作系统 终身访问限时 70% 折扣 - 加入 2,000+ 交易员社区 为什么大多数交易者即使拥有“完美”指标也会失败? 因为他们在真空中交易 单一概念 。没有背景的信号是赌博。要持续获胜,您需要 共振 (CONFLUENCE) 。 RelicusRoad Pro 不是一个简单的箭头指标。它是一个完整的 量化市场生态系统 。它描绘价格运行的“公允价值之路”,区分市场噪音和真实的结构性突破。 停止猜测。开始用机构级“路”逻辑进行交易。 核心引擎:“Road” (路) 算法 系统的核心是 Road Algo ,一个实时适应市场条件的动态波动率通道。它投射出 安全线 (平衡) 和价格可能反转的 扩展水平 。 Simple Road: 典型市场的标准结构映射。 Smooth Road: 针对震荡盘整的降噪计算。 Breakout Road: 专为识别波动率扩张和爆发性走势而调整。 1. 算法动量与确认 我们的“剥头皮箭头”不只是简单的交叉。它们利用 高阶多项式逻辑 过滤噪音,确保信号与主周期一致。我们检测动量、价格行为和 Road 结构汇聚的精确入场
看清市场真正在做什么。   在您眼前实时观察三大市场阶段(收缩、扩张、趋势),并在趋势阶段的早期阶段抓住更优的入场点。   不要再猜测。开始像机构和聪明钱那样解读市场。   Apex Market Structure Pro(MT5 版)是一款精准的聪明钱分析工具,它剥离噪音,向您展示每根 K 线之下的真实结构:流动性、结构转变、吸   筹区域与趋势偏向,全部呈现在一个简洁、专业的图层中。专为厌倦了滞后指标、准备以清晰视角交易的严肃交易者打造。   重要提示:本指标专为 Heikin Ashi(平均足)K 线设计。使用前请将图表切换为 Heikin Ashi,以释放其全部威力。全部分析都围绕 Heikin   Ashi 的价格流构建。正是在这里,Apex Market Structure Pro 发挥出最佳表现。   交易者为何选择 Apex Market Structure Pro:   流动性,一览无遗: 瞬间看清止损池所在之处。卖方与买方流动性会被自动标注。实时关注尚未被扫的价位,捕捉价格攫取流动性并反转的精确时   刻。在聪明钱交易的地方交易。   会说话的结构:
历史相似性匹配指标  概述 历史相似性匹配器(Historical Similarity Matcher)是 MetaTrader 5 的技术分析指标。它扫描历史价格数据,寻找与用户在图表上选定的参考时期具有统计相似性的片段。当找到匹配时,指标会显示历史模式,并根据这些历史片段的后续走势绘制潜在未来价格走势的投影。 本指标仅供教育和分析用途,不构成财务、投资或交易建议。不保证结果或盈利能力。过去表现不代表未来结果。交易存在重大损失风险。用户对自己的交易决策和结果负全责。  功能特点 - 识别与选定参考时期具有相关性的历史价格片段 - 支持正向和反向模式匹配 - 显示多个匹配的历史模式(数量可配置) - 为每个匹配绘制基于历史延续的独立投影线 - 可选 OpenCL 支持,在兼容硬件上加速计算(不支持时回退到 CPU) - 适用于任何时间周期和交易品种 - 允许在不同于当前图表的时间周期上进行扫描 - 在图表上提供启动扫描和导出结果的按钮 - 导出每个匹配的截图以及包含匹配详情的 CSV 文件  工作原理 1. 用户通过在图表上放置两条垂直线或在输入参数中设置日期来选择
AriX
Temirlan Kdyrkhan
1 (4)
AriX Indicator for MT5 A powerful trend-following and signal-evaluation tool AriX is a custom MT5 indicator that combines Moving Averages and ATR-based risk/reward logic to generate clear buy/sell signals. It visualizes dynamic SL/TP levels, evaluates past trade outcomes, and displays win/loss statistics in a clean on-chart panel. Key features include: Buy/Sell signals based on MA crossovers ATR-based SL/TP1/TP2/TP3 levels with visual lines and labels Signal outcome tracking with real-time stat
Gold Uptrend Insider
Lawrence Chiiambb Mkandawi
5 (1)
Uptrend Insider A clean and powerful trend-following indicator that helps you catch the beginning of uptrends and exit before the market turns into a range or downtrend. How it works:   Green → Uptrend signal (potential buying opportunity) Orange → Ranging / sideways market possibility but maintain the trend positions just keep an eye for possible ranges and reversals. Red → Downtrend or exit signal (time to close long positions) The indicator is designed to be extremely simple and visual. You o
OrderFlow Absorption – 專業級MT5買賣差與吸收訊號指標 釋放真正訂單流分析的力量,OrderFlow Absorption 是MetaTrader 5上最強大的買賣差(Delta)直方圖與吸收訊號指標。專為想看清每一個價格波動背後真相的交易者設計,這個工具揭示了隱藏的買賣壓力與推動市場的吸收事件。 功能特色 買賣差直方圖視覺化:   以清晰的色彩直方圖即時顯示買方與賣方壓力。 吸收訊號偵測:   先進邏輯自動辨識多空吸收事件,及早預警潛在反轉。 圖表標記:   吸收訊號直接標示於主圖表,方便視覺辨識。 彈出式警報:   新吸收訊號出現時即時通知。 自訂門檻:   過濾弱訊號,專注高勝率機會。 資源管理:   高效運算,適用於大型圖表也能流暢運行。 全品種兼容:   適用於任何商品與週期,包括外匯、指數、商品等。 簡易整合:   參數簡單,快速上手與調整。 OrderFlow Absorption 的邏輯說明 OrderFlow Absorption 採用專利演算法,能在沒有完整Tick數據的情況下,估算每根K棒的買賣壓力(Delta)。它分析成交量、價格行為、K
Meravith MT5
Ivan Stefanov
5 (3)
做市商工具。 Meravith 将: 分析所有时间周期并显示当前正在运行的趋势。 标注流动性区域(成交量均衡区),即多头与空头成交量相等的位置。 在您的图表上直接显示来自不同时间周期的所有流动性水平。 生成并展示基于文本的市场分析供您参考。 根据当前趋势计算目标位、支撑位和止损位。 计算交易的风险回报比。 根据您的账户余额计算仓位大小,并估算潜在利润。 在市场出现重大变化时,Meravith 还会发出警告。 指标的主要线条: 多头/空头成交量衰竭线 —— 作为目标位使用。 趋势线 —— 指示市场趋势方向。根据市场是多头还是空头而改变颜色,并作为趋势支撑。其颜色主要反映市场情绪。 成交量均衡线(Eq)—— Eq(Volume Equilibrium)是系统的核心。它表示买卖双方成交量的平衡点,即市场流动性所在位置。向上突破 Eq 表示多头倾向,向下突破 Eq 表示空头倾向。突破后,应等待回调——当价格回到相反趋势的偏离线或衰竭线附近时。 使用方法:只需将其添加到图表中。 Meravith 可以分析一切——趋势和回调。 趋势线与某条成交量衰竭线之间的距离越大,说明该方向的成交量越高。 趋势
您好,交易员! 大多数散户交易者依赖于滞后的网页脚本。真正具有交易优势需要机构化的架构。 Astro AI 指标并非标准的图表叠加层。它是一个编译后的神经网络,包含两个代理,直接运行在您的终端上。 以下是该系统背后的具体技术: 1. 代理 1:分析师(图神经网络 - GNN) 市场并非孤立的价格柱;它们是相互关联的数据网络。 功能:代理 1 使用图神经网络来映射这些复杂的非线性关系。 优势:标准指标仅考虑单一的历史移动平均线,而我们的 GNN 可以实时处理深层的市场结构关系,在散户交易量发挥作用之前揭示隐藏的相关性。 2. 代理 2:执行器(近端策略优化 - PPO) 模式识别只是成功的一半。基于当前市场波动做出正确的决策,才是预测模型与滞后模型之间的区别所在。 功能:代理 2 使用 PPO(一种先进的强化学习算法)来确定最佳入场点。 优势:它持续调整交易策略,而非使用静态的“超买”或“超卖”线。它会分析当前市场状况并计算最可能的成交点。 执行桥接:通过 ONNX 集成到交易终端 如果执行速度慢,模式识别就毫无用处。我们已通过 ONNX(开放神经网络交换平台)
VTrende Pro
Andrii Diachenko
5 (1)
VTrende Pro - MTF indicator for trend trading with a display panel for MT5 *** Videos can be translated into any language using subtitles (video language - Russian) Although the signals of the VTrende Pro indicator can be used as signals of a full-fledged trading system, it is recommended to use them in conjunction with the Bill Williams TS. VTrende Pro is an extended version of the VTrende indicator. Difference between Pro version and VTrende: - Time zones - Signal V - signal 1-2 waves -    S
Flag Pattern Angelo
Brighton Mufaro Mudzingwa
Brandon Angelo Flag Pattern — how it works This indicator automatically detects classic bull and bear flag chart patterns in real time. The detection happens in three stages for each bar. First it looks for a flagpole — a sharp, strong directional move over a configurable number of bars ( FlagpoleBars , default 5) that must exceed a minimum percentage size ( FlagpoleMinPct ). For a bullish flag the pole must close net higher than it opened; for a bearish flag, net lower. Second it identifies th
This indicator automatically detects internal & swing market structure, Fibonacci Retracement and Fibo Levels. Features Full internal & swing market structure labeling in real-time Fibonacci Retracement Fibonacci Levels After purchasing the indicator, the full source code is provided, and via indicator buffers it can be easily integrated into your Expert Advisors (EAs) for automated trading strategies.
Naked Forex Tweezer Pro Indicator Tweezer Pro Indicator is a pattern recognition indicator for Forex, Stocks, Indices, Futures, Commodities and Cryptos. The standard Tweezer is a two bar pattern. Our enhanced version is a multi-bar pattern. We filter the patterns for you so that you only get the     best and most effective patterns   and ignore the noise. The Tweezer pattern is a simple and effective pattern to trade. The strategy that comes with the Tweezer is based on price action. The Twe
Chimera Volume
Marko Milenkovic
适用于 MetaTrader 5 的 Chimera Volume 高级成交量分析与市场活跃度可视化 Chimera Volume 是一款为 MetaTrader 5 设计的自定义指标,旨在通过动态视觉框架分析标准化成交量活跃度,并展示市场参与度的变化。 该指标利用自适应标准化算法处理 Tick 成交量数据,生成关于成交量强度、累积阶段以及不同市场条件下活跃度变化的结构化表达。 与显示原始成交量数值的标准成交量指标不同,Chimera Volume 应用了额外的计算方法,以突出市场活动的相对变化并提高图表的可读性。 主要功能 根意图直方图 (Root Intent Histogram): 一种动态直方图,用于可视化标准化成交量强度和市场参与度。该直方图使用自适应颜色过渡,以区分活跃度增加时期与参与度减弱时期。 惯性线 (Inertia Line): 一条由标准化成交量计算得出的平滑分析线。旨在帮助交易者观察成交量动能的变化,并监控扩张期与收缩期之间的转换。 信号线 (Signal Line): 一个用于比较短期和长期成交量表现的次级计算层,在评估市场状况时可作为辅助参考。 自适应成交量
作者的更多信息
Wave Rider EVO
Alessandro Farinella
Wave Rider EVO — Adaptive Trend & Pullback System 15 adaptive baselines, dynamic slope-based trend detection, and statistical pullback entries in one multi-method indicator. As seen on Forex-Station forum. Wave Rider is a trend-following and pullback system that combines an adaptive baseline selectable from 15 algorithms (KAMA, Hull, McGinley, Kernel Rational Quadratic, TRAMA, Zero-Lag Hull and more), a slope-based trend engine with automatic or manual threshold, and a Linear Trajectory channe
FREE
WaveSniper
Alessandro Farinella
Wave Sniper One indicator. Adaptive baseline, multi-layer signal engine, and closed-bar confirmed entries — designed for traders who want precision without complexity. I tried to build the perfect indicator. I ended up deleting most of them. I used, studied and coded hundreds of indicators. I analyzed and converted entire libraries from PineScript, ProRealCode, EasyLanguage, MQL. Oscillators, moving averages, bands, candlestick pattern: you name it! I spent weeks, even months optimizing param
Market Levels Edge
Alessandro Farinella
MarketLevelsEdge is a market-structure overlay for MetaTrader 5 that plots the key levels institutional and retail order flow actually react to — previous day/week high and low, session VWAP, and daily open — and fuses them into a single, easy-to-read confluence score. It does not generate trade signals on its own: it is built to sit alongside your own strategy, sharpening your read of market bias and flagging the price zones where reversals or breakouts are statistically more likely to happen.
筛选:
无评论
回复评论