Smart structure sr ultima
- 指标
- 版本: 2.0
- 激活: 5

Structure ultime du marché et indicateur intelligent de support/résistance
SMART STRUCTURE SR ULTIMA est une solution de trading avancée conçue pour fournir une lecture claire, précise et professionnelle de la structure du marché.
Conçu pour les traders modernes, cet indicateur combine une structure intelligente (DER/DES) , des niveaux de support et de résistance dynamiques et un système unique de Structure Fan qui visualise la force du marché, son expansion et ses zones critiques en temps réel.
PRINCIPALES CARACTÉRISTIQUES
Analyse structurale avancée (DER / DES)
- Détection automatique des principaux points d'oscillation
- Tracé de structures dynamiques :
- DER (ligne de résistance dynamique)
- DES (ligne de support dynamique)
- Identification rapide de la direction de la tendance dominante
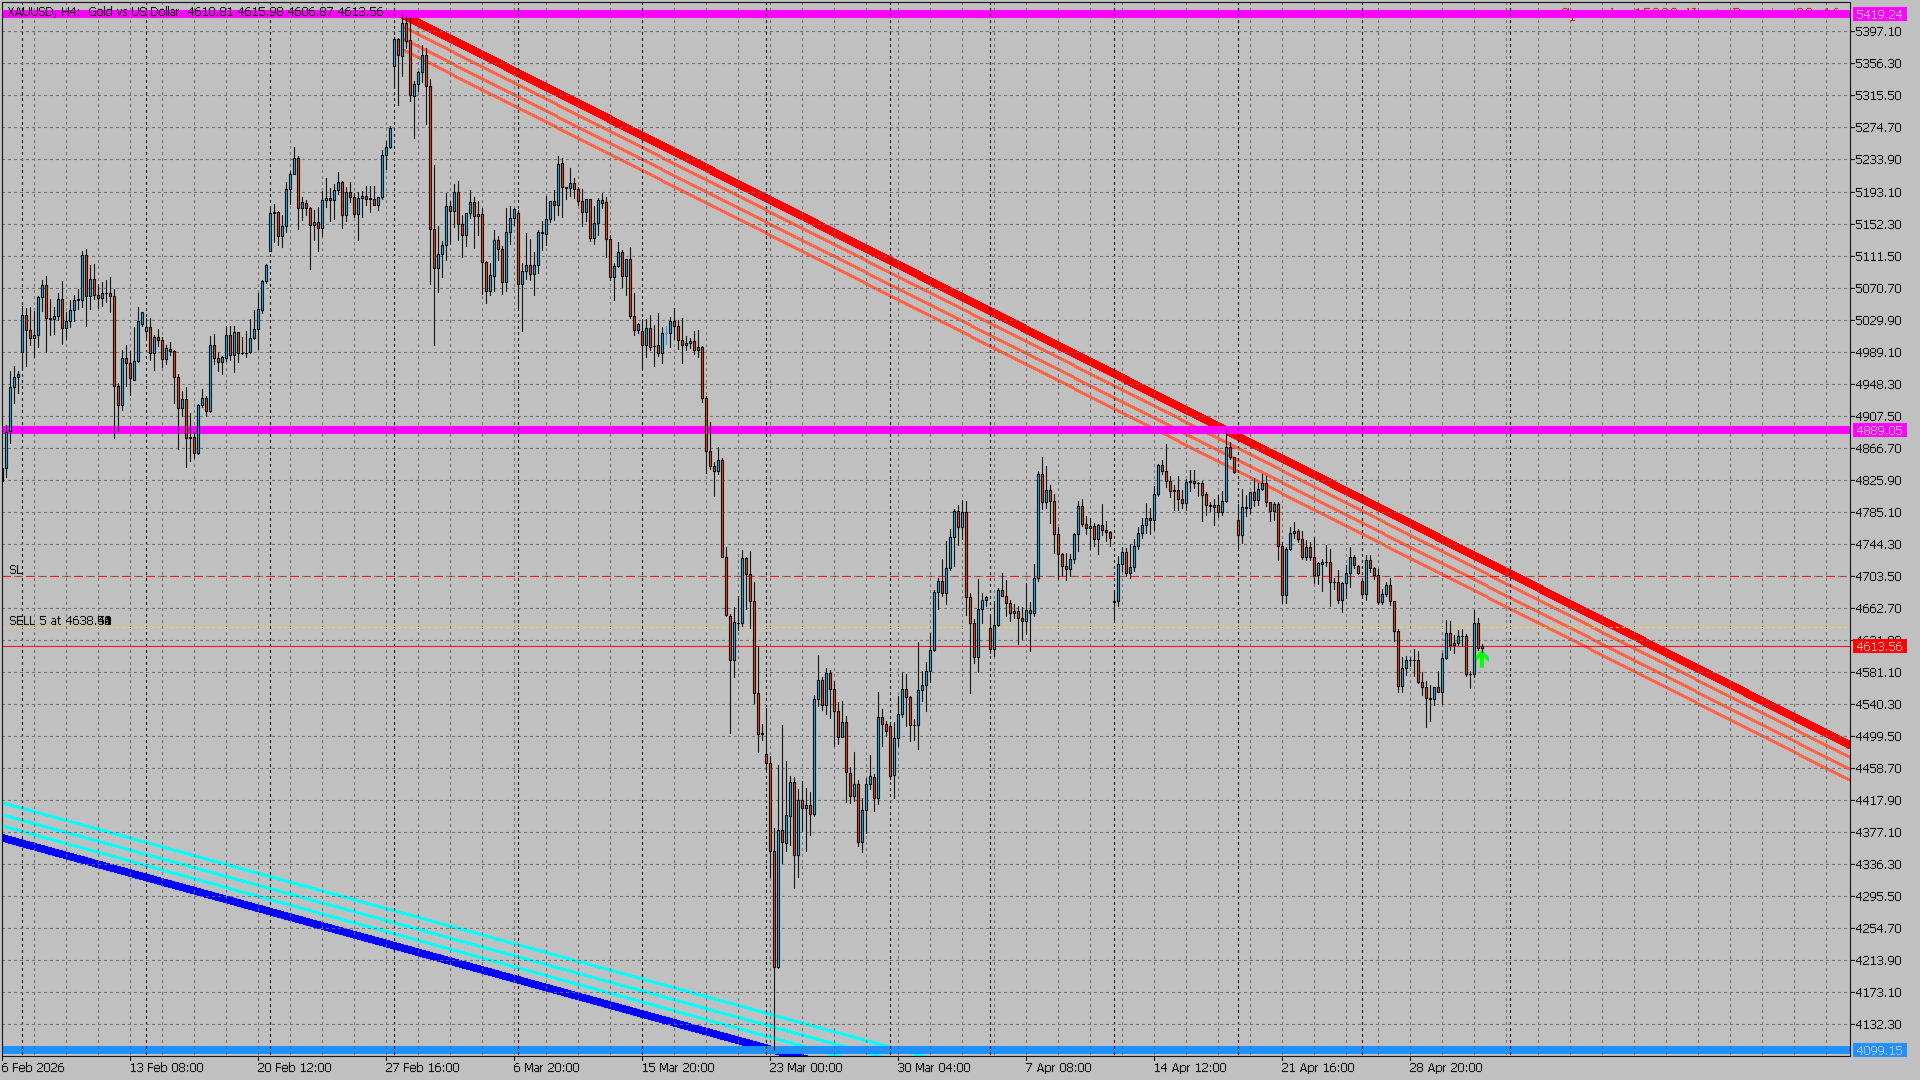
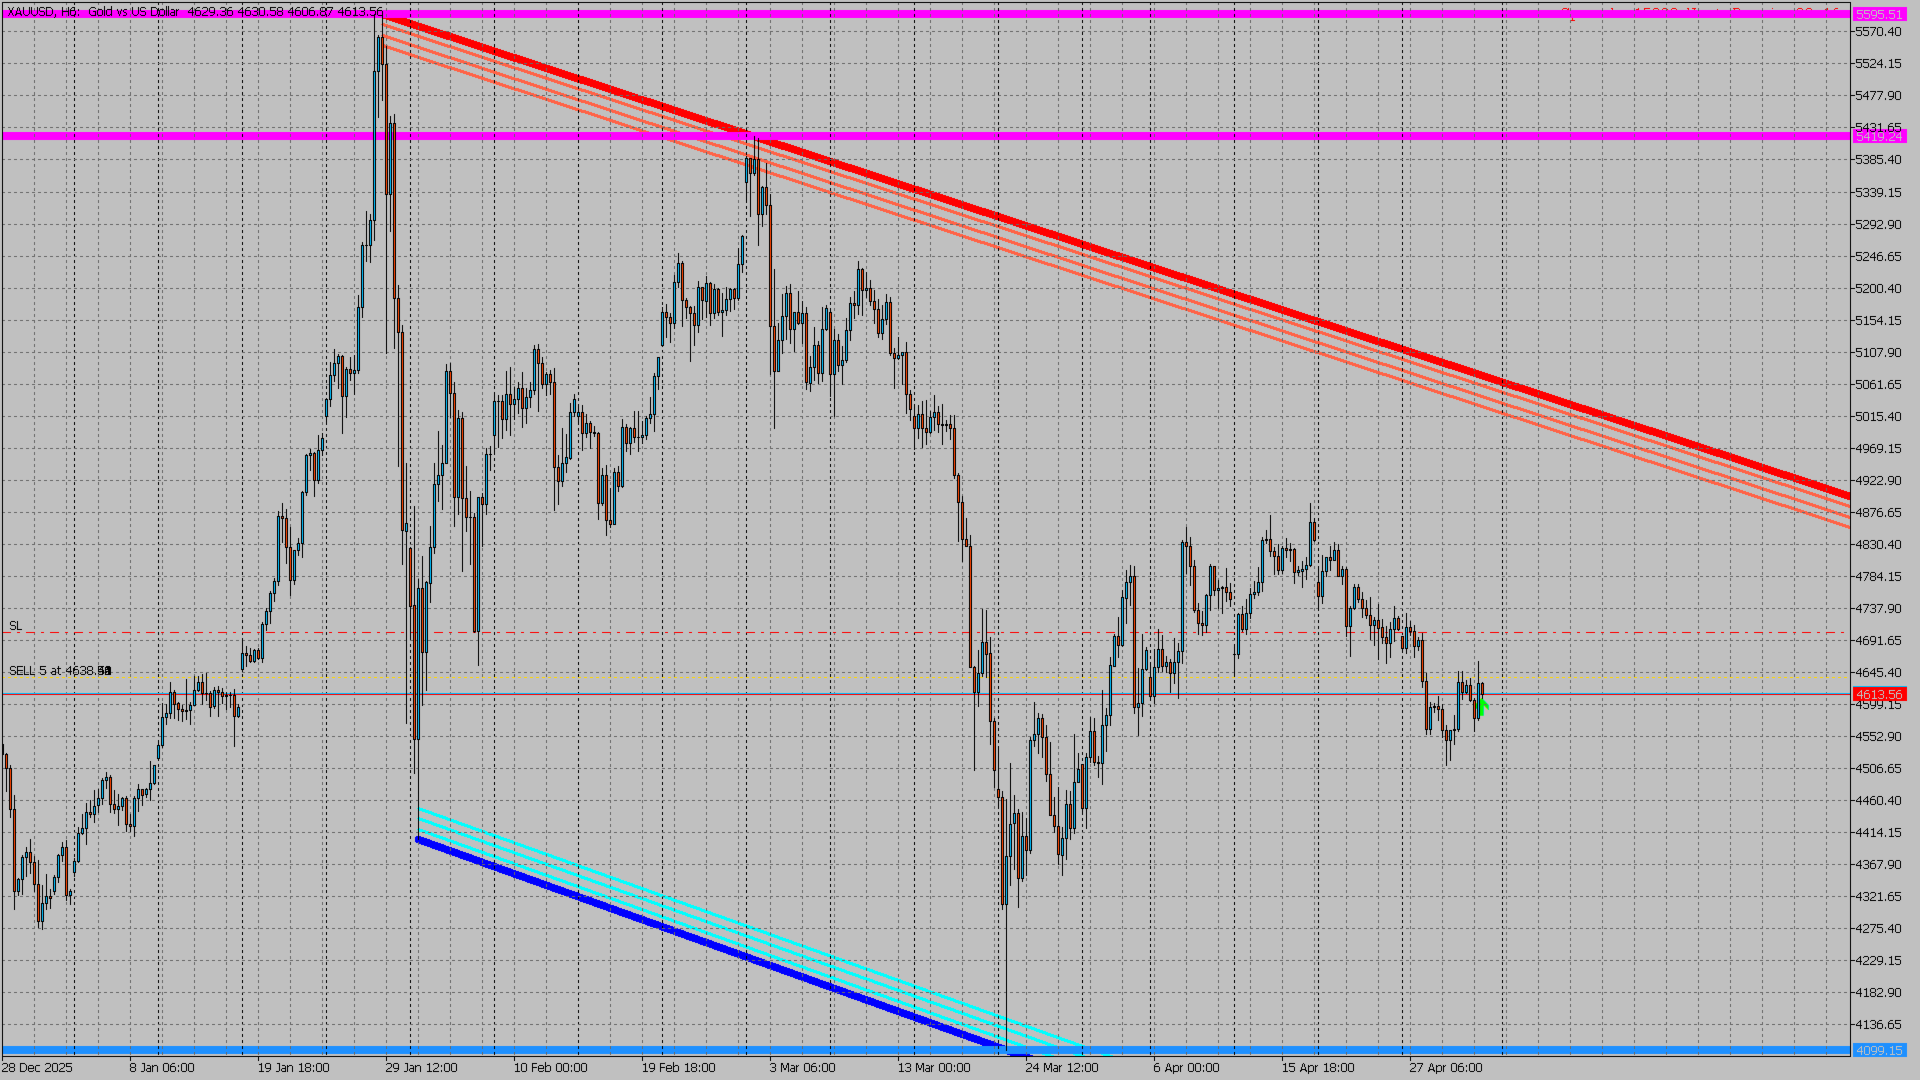
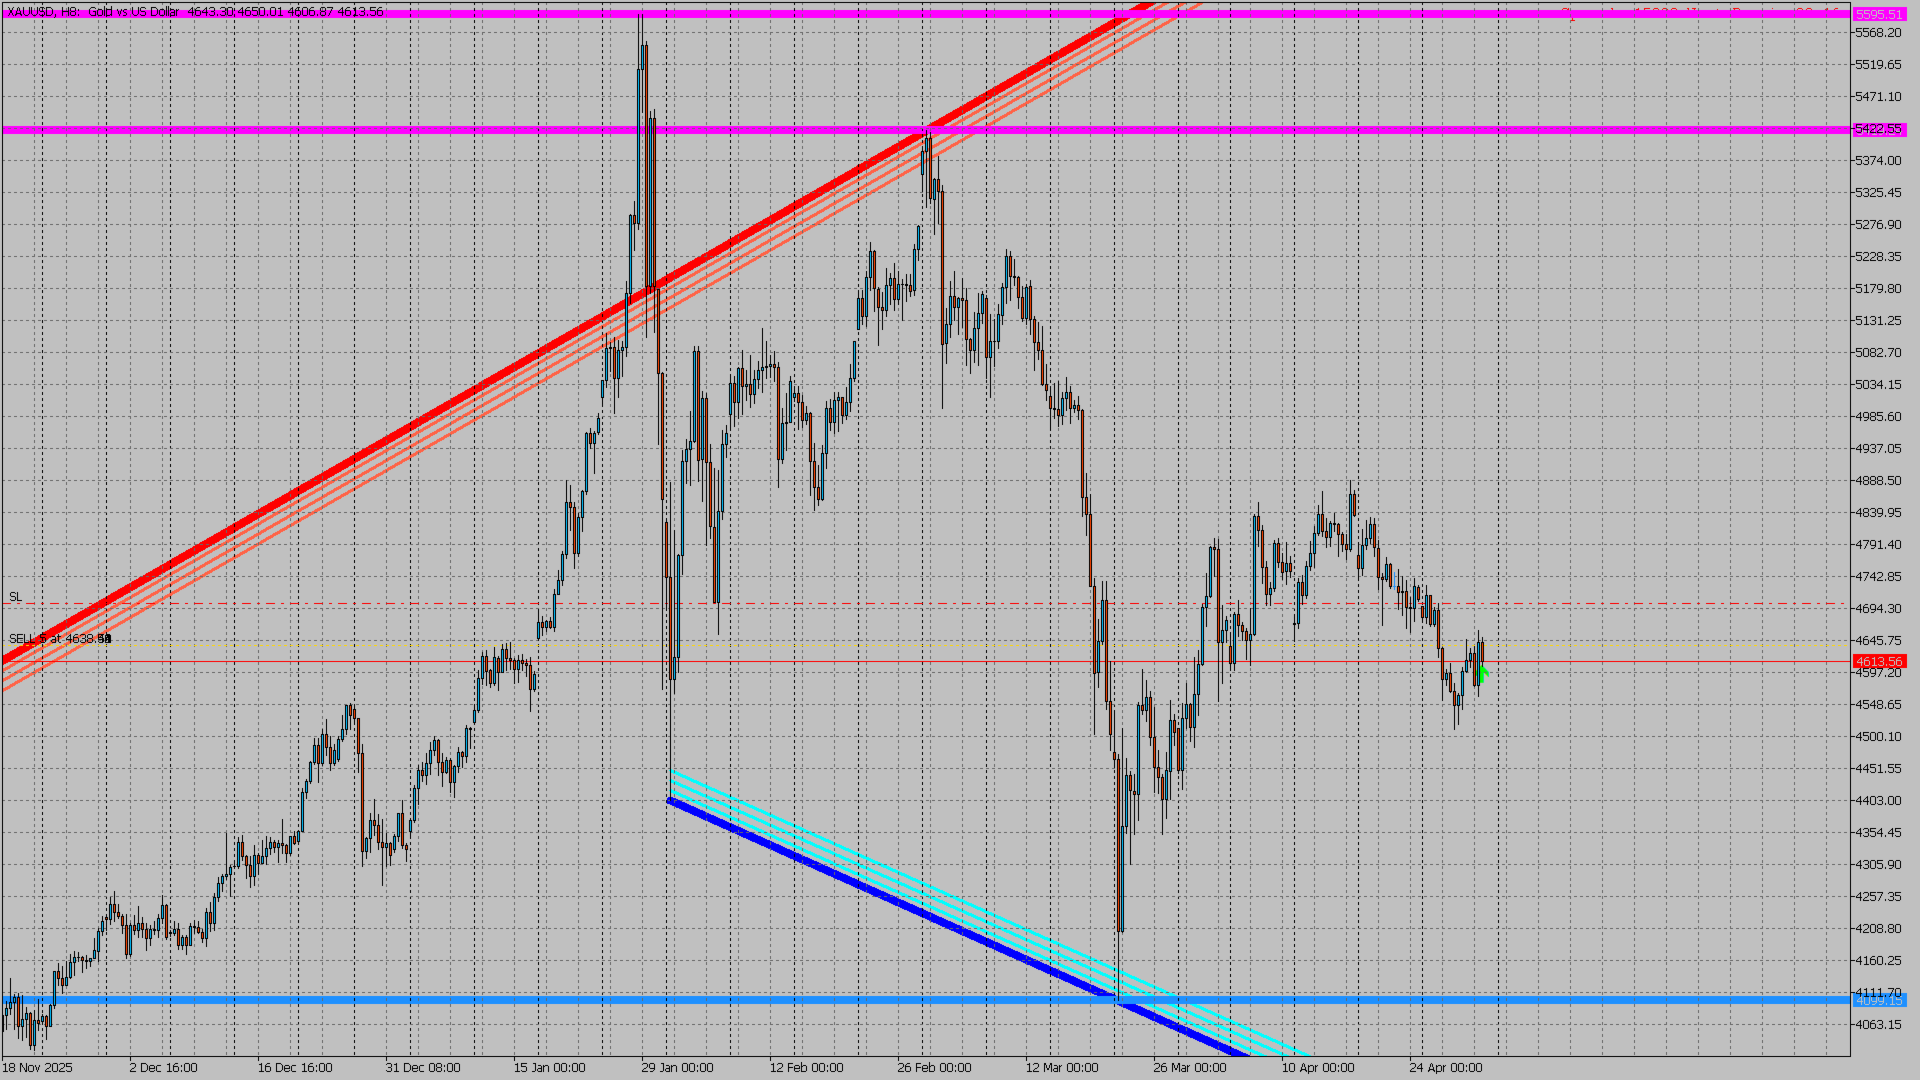
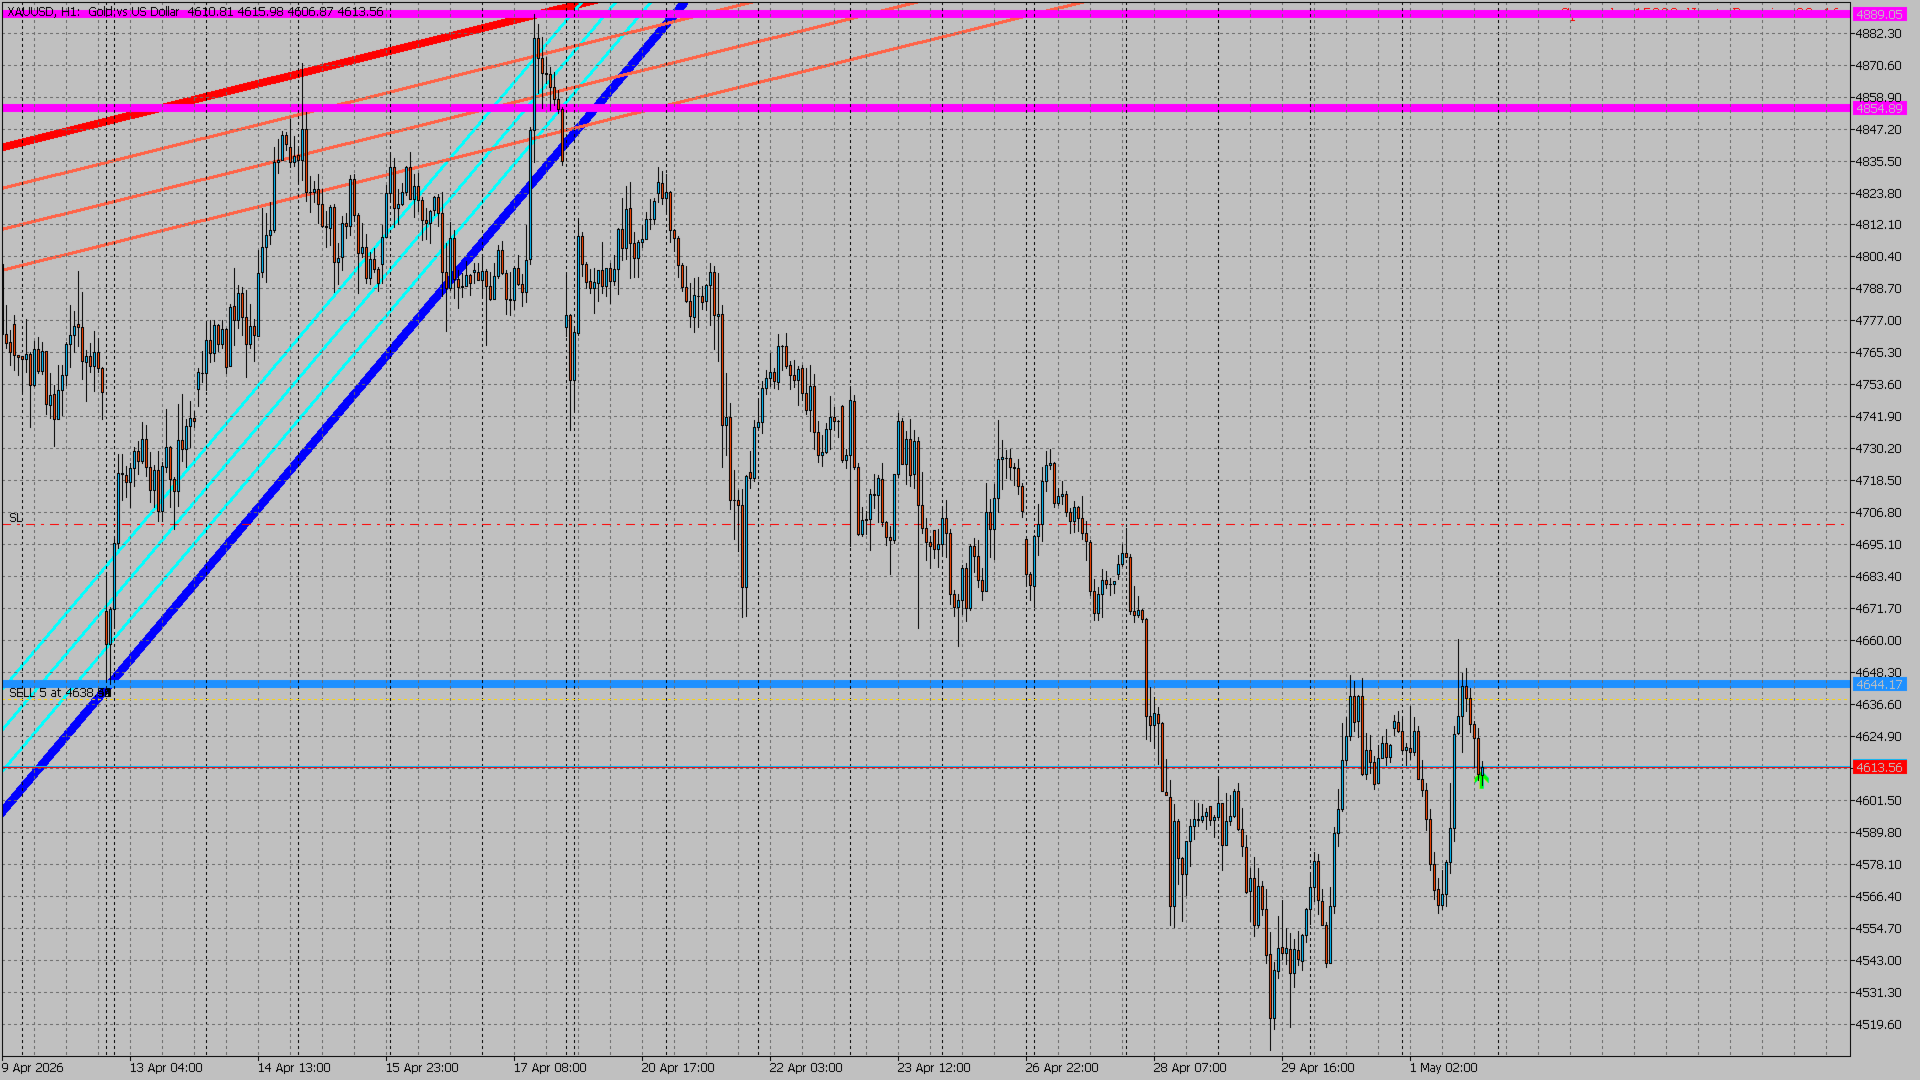
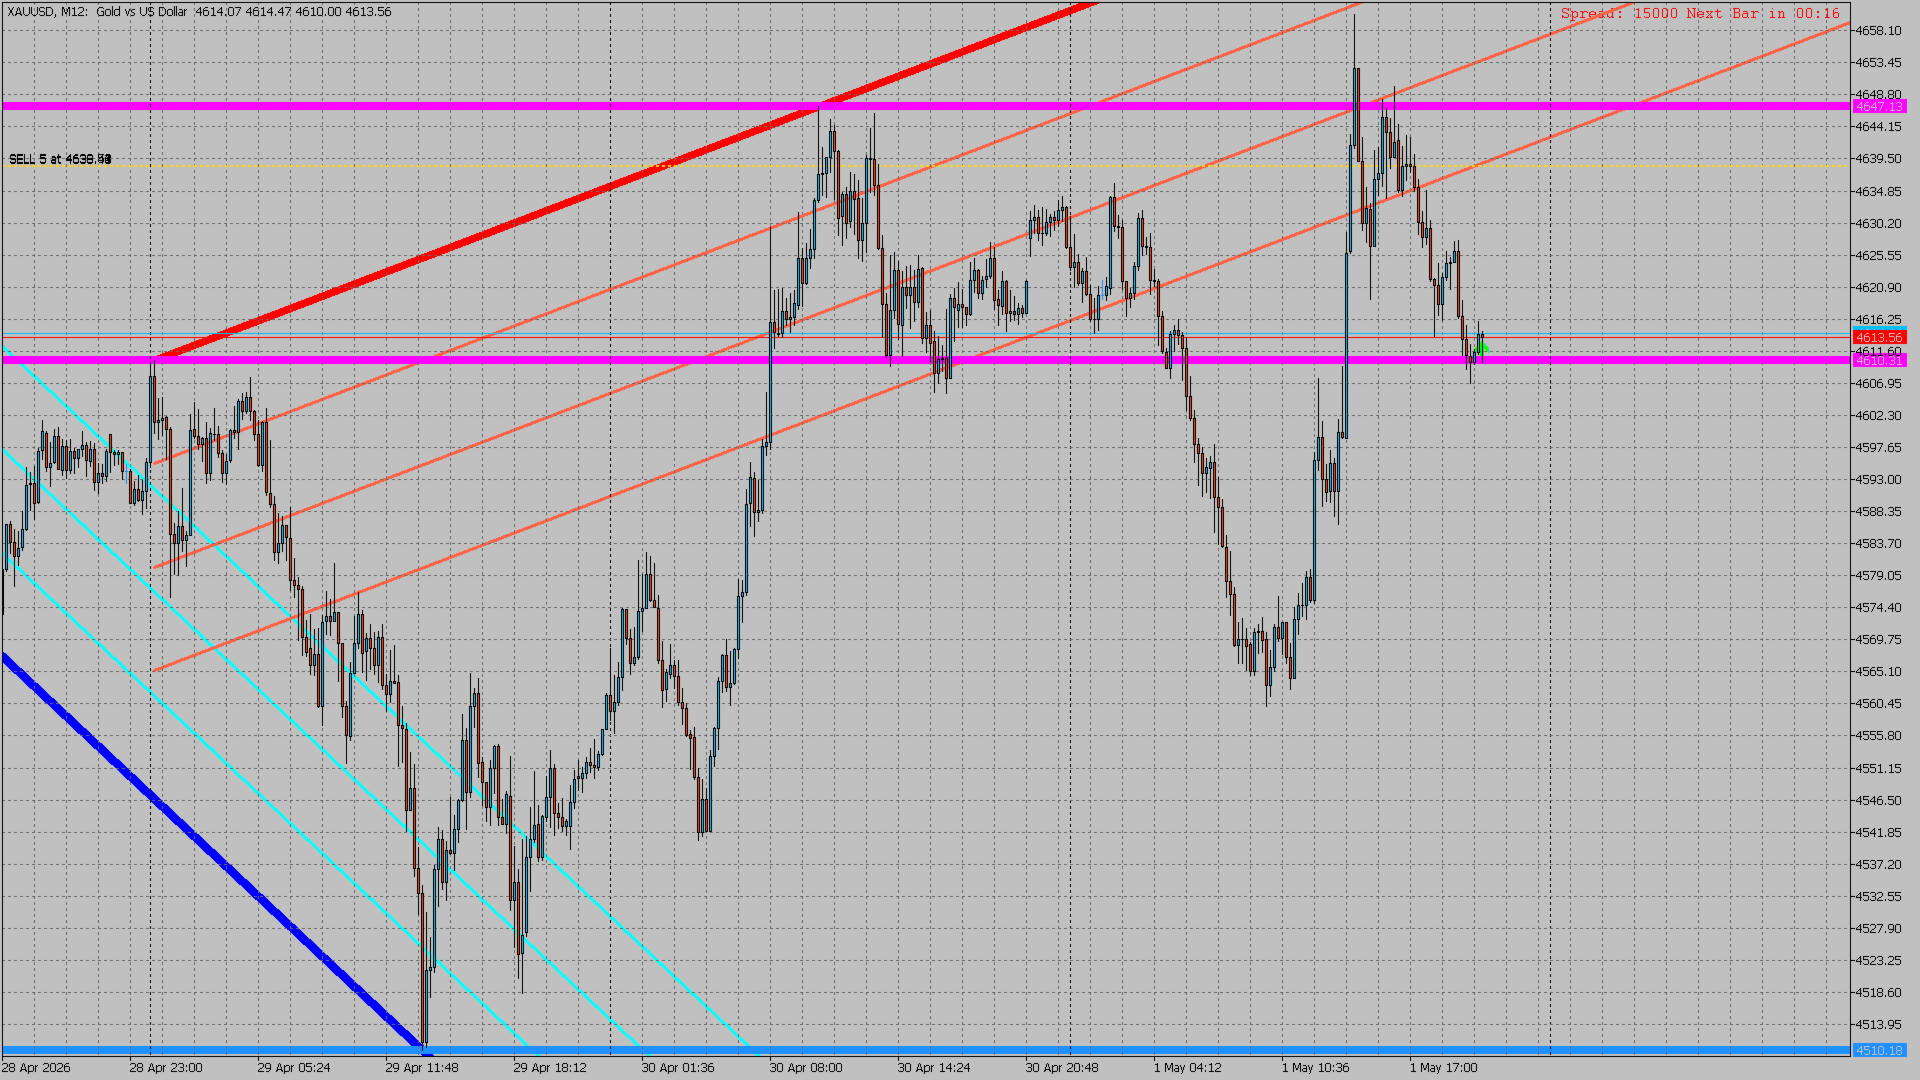
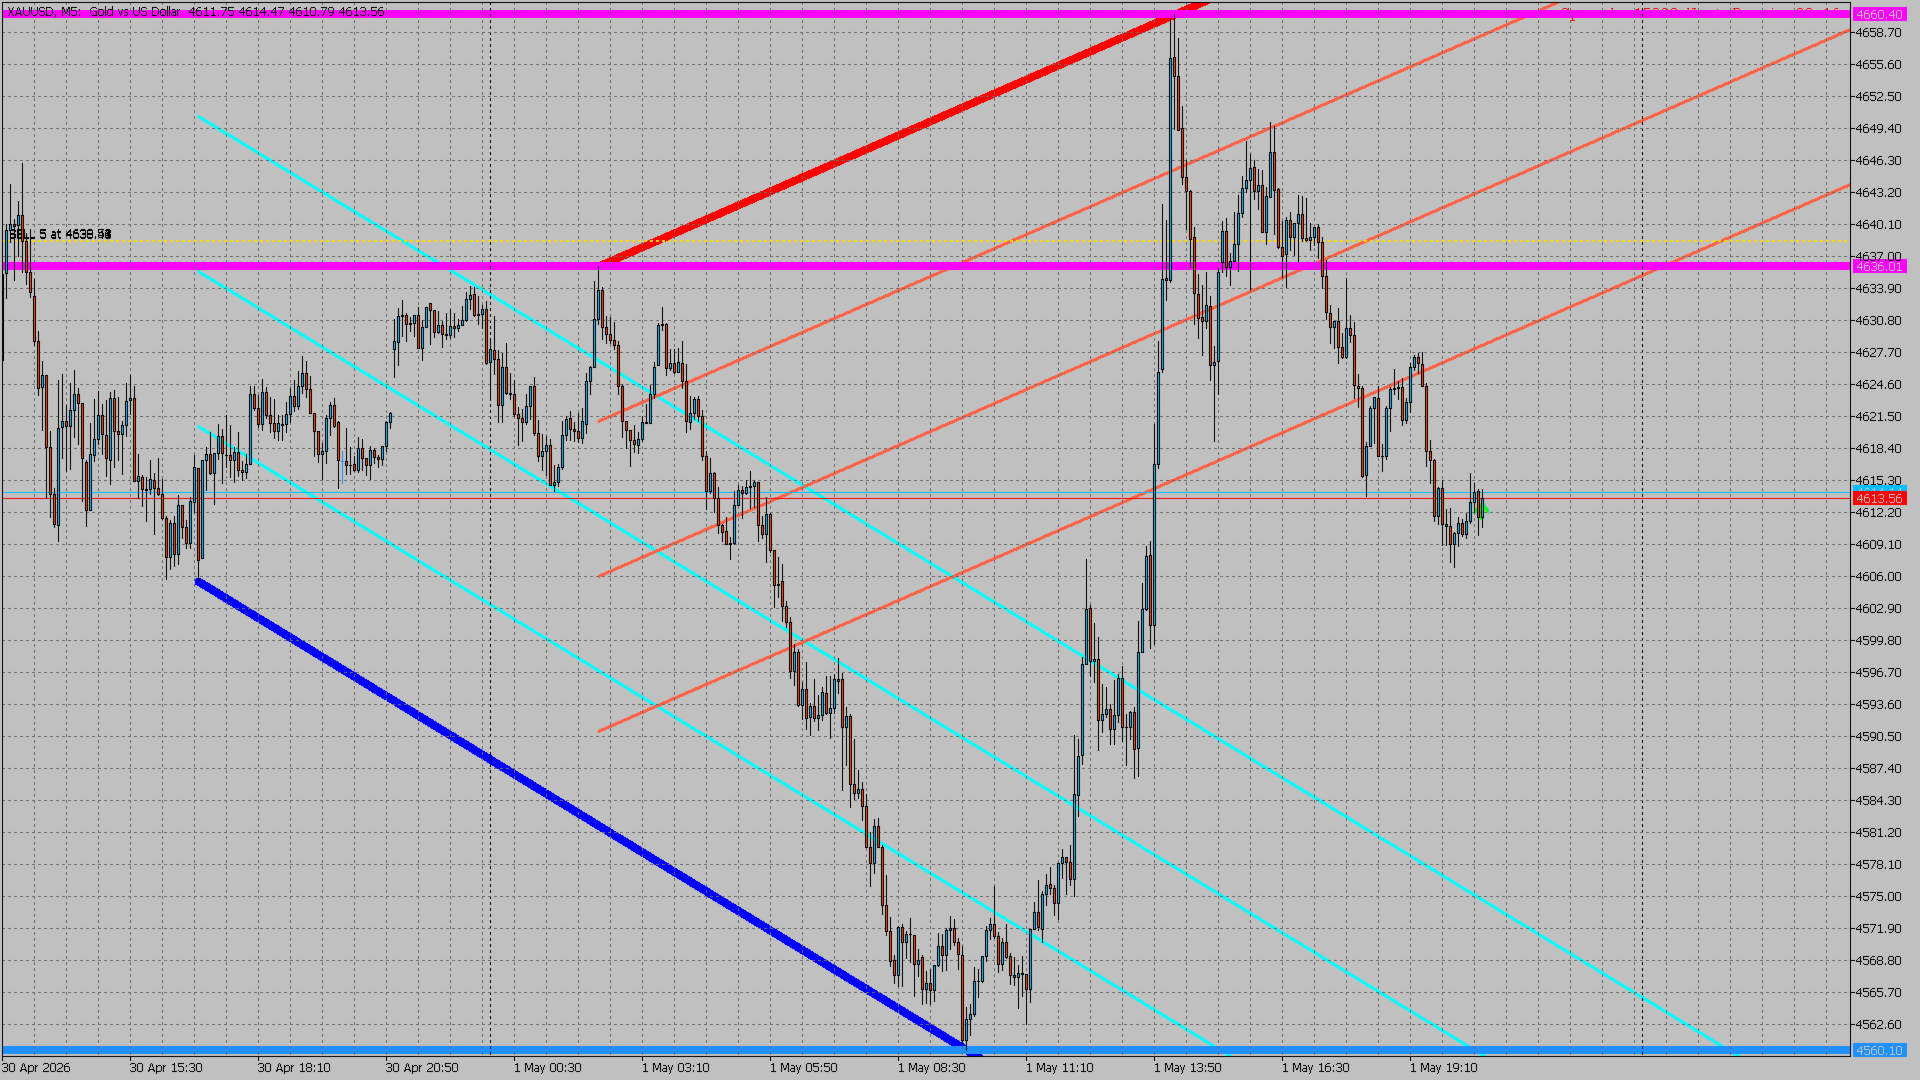
📐 VENTILATEUR ULTIMA STRUCTURE — TECHNOLOGIE EXCLUSIVE 🔥
- Génération automatique de lignes d'expansion de type ventilateur
- Crée une structure en éventail autour du DER et du DES
- Permet de visualiser :
- force d'élan
- phases d'expansion
- zones de compression du marché
Un outil puissant pour anticiper :
- Évasions
- Inversions
- mouvements d'accélération du marché
Soutien et résistance intelligents (SRZZ)
- Détection automatique des principaux niveaux de marché
- Affichages :
- zones de résistance majeures
- zones de soutien principales
- Construit sur une logique structurelle robuste
Système de signalisation intelligent
- Signal d'achat : prix proche du support + structure haussière
- Signal de vente : prix proche de la résistance + structure baissière
- Filtrage intelligent pour réduire les faux signaux
Personnalisation complète
- Couleurs personnalisées (DER, DES, système de ventilation)
- Épaisseur de trait réglable (niveau professionnel)
- Styles de lignes configurables (continu, pointillé, tiret)
- Activer/désactiver les modules individuellement
UTILISATION STRATÉGIQUE
Scénario d'achat
- Prix à proximité d'un support clé (DES ou SR)
- Fan de structure haussière en expansion
- Le signal de confirmation d'achat apparaît
Scénario de vente
- Prix à proximité d'une résistance clé (DER ou SR)
- Fan de structure baissière active
- Un signal de confirmation de vente apparaît
Lecture avancée du marché
- Compression de la ligne → forte probabilité de rupture
- Expansion extrême → zone de correction potentielle
- Rupture de structure (DER/DES) → signal d'inversion de tendance
PARAMÈTRES PRINCIPAUX
- Profondeur d'oscillation : sensibilité de l'oscillation de la structure
- SRZZ_Depth : sensibilité du support/de la résistance
- StructureFanSpacing : espacement des lignes de ventilateur
- StructureFanWidth : épaisseur de ligne
- EnableSignal : activer/désactiver les signaux
À QUI S'ADRESSE-T-IL ?
✔ Traders Forex
✔ Traders Crypto
✔ Traders Indices et Matières Premières
✔ Scalping / Day Trading / Swing Trading
AVANTAGES
Analyse instantanée de la structure du marché
Analyse visuelle claire et professionnelle
Détection précoce des mouvements majeurs du marché
Réduction du bruit de marché
Fonctionne sur toutes les échelles de temps
RECOMMANDATIONS
Pour des performances optimales :
- Combiner avec la confirmation de l'action des prix
- À utiliser conjointement avec les zones de liquidité ou les blocs d'ordres
- Évitez les marchés à forte volatilité/latérale
CONCLUSION
SMART STRUCTURE SR ULTIMA est bien plus qu'un simple indicateur :
c'est un outil complet et avancé d'analyse de la structure du marché qui transforme votre façon d'interpréter le marché.
Grâce à sa combinaison unique d'analyse de structure, de niveaux intelligents et de visualisation dynamique des ventilateurs, il vous permet de trader avec précision, confiance et efficacité .