South African Sniper Indicator
- 指标
- 版本: 1.2
- 更新: 10 二月 2023
- 激活: 5
🌍 Introducing the South African Sniper Indicator 🎯
Created by a dedicated team of South African traders with years of profitable experience in the financial markets, the South African Sniper Indicator is designed to give traders a sharp edge — combining simplicity, precision, and power in one tool.
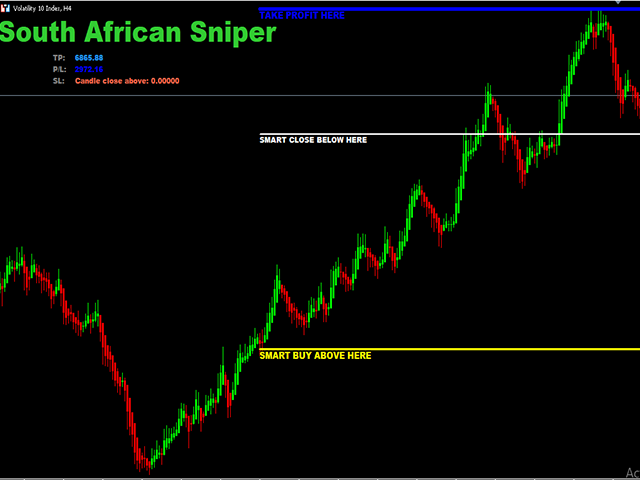
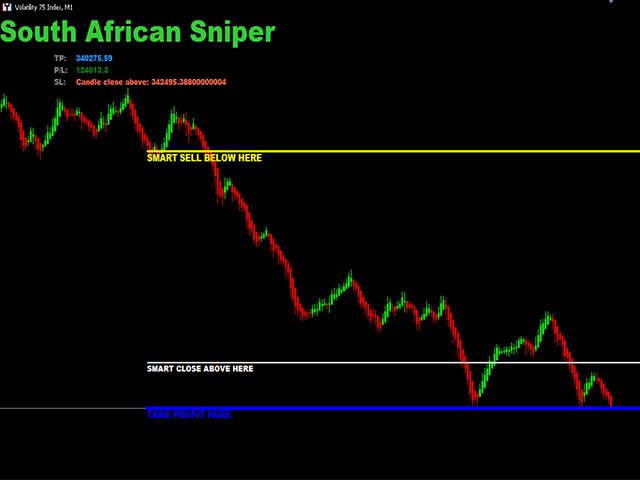
This is a plug-and-play indicator for MT5, built to deliver accurate BUY and SELL (Sniper Entry) signals — complete with target levels and automated trailing stops. Whether you trade forex, indices, metals, or crypto, the Sniper works seamlessly across all MT5 instruments.
💡 How it Works:
The Sniper algorithm studies historical price behavior, volume shifts, and momentum patterns, using past chart data as a receipt to forecast potential future moves. Each signal is filtered through a combination of trend direction, volatility, and structure — helping traders catch high-probability setups while avoiding false signals.
✅ Key Features:
Plug-and-play — no complex setup required.
Works on all MT5 assets and timeframes.
Clear BUY / SELL alerts, with Take Profit and Trail Stop levels.
Built-in risk management guidance for consistent results.
Designed and optimized for both scalpers and swing traders.
💬 What Traders Say:
The South African Sniper community is growing fast — traders love its precision, consistency, and simplicity. Many call it their “silent trading partner” — helping them make confident decisions without the emotional stress.
⚠️ Important for New Users:
Before making a purchase, we highly recommend downloading the free MT5 demo version.
Use it on the Strategy Tester to analyze performance and confirm that it fits your trading style.
Only purchase the full version once you are fully satisfied with its results and accuracy.

successful
You can be sure that you will be very successful in trading your expert indicator automatically or with a few updates.