Bands Levels Plus Bands

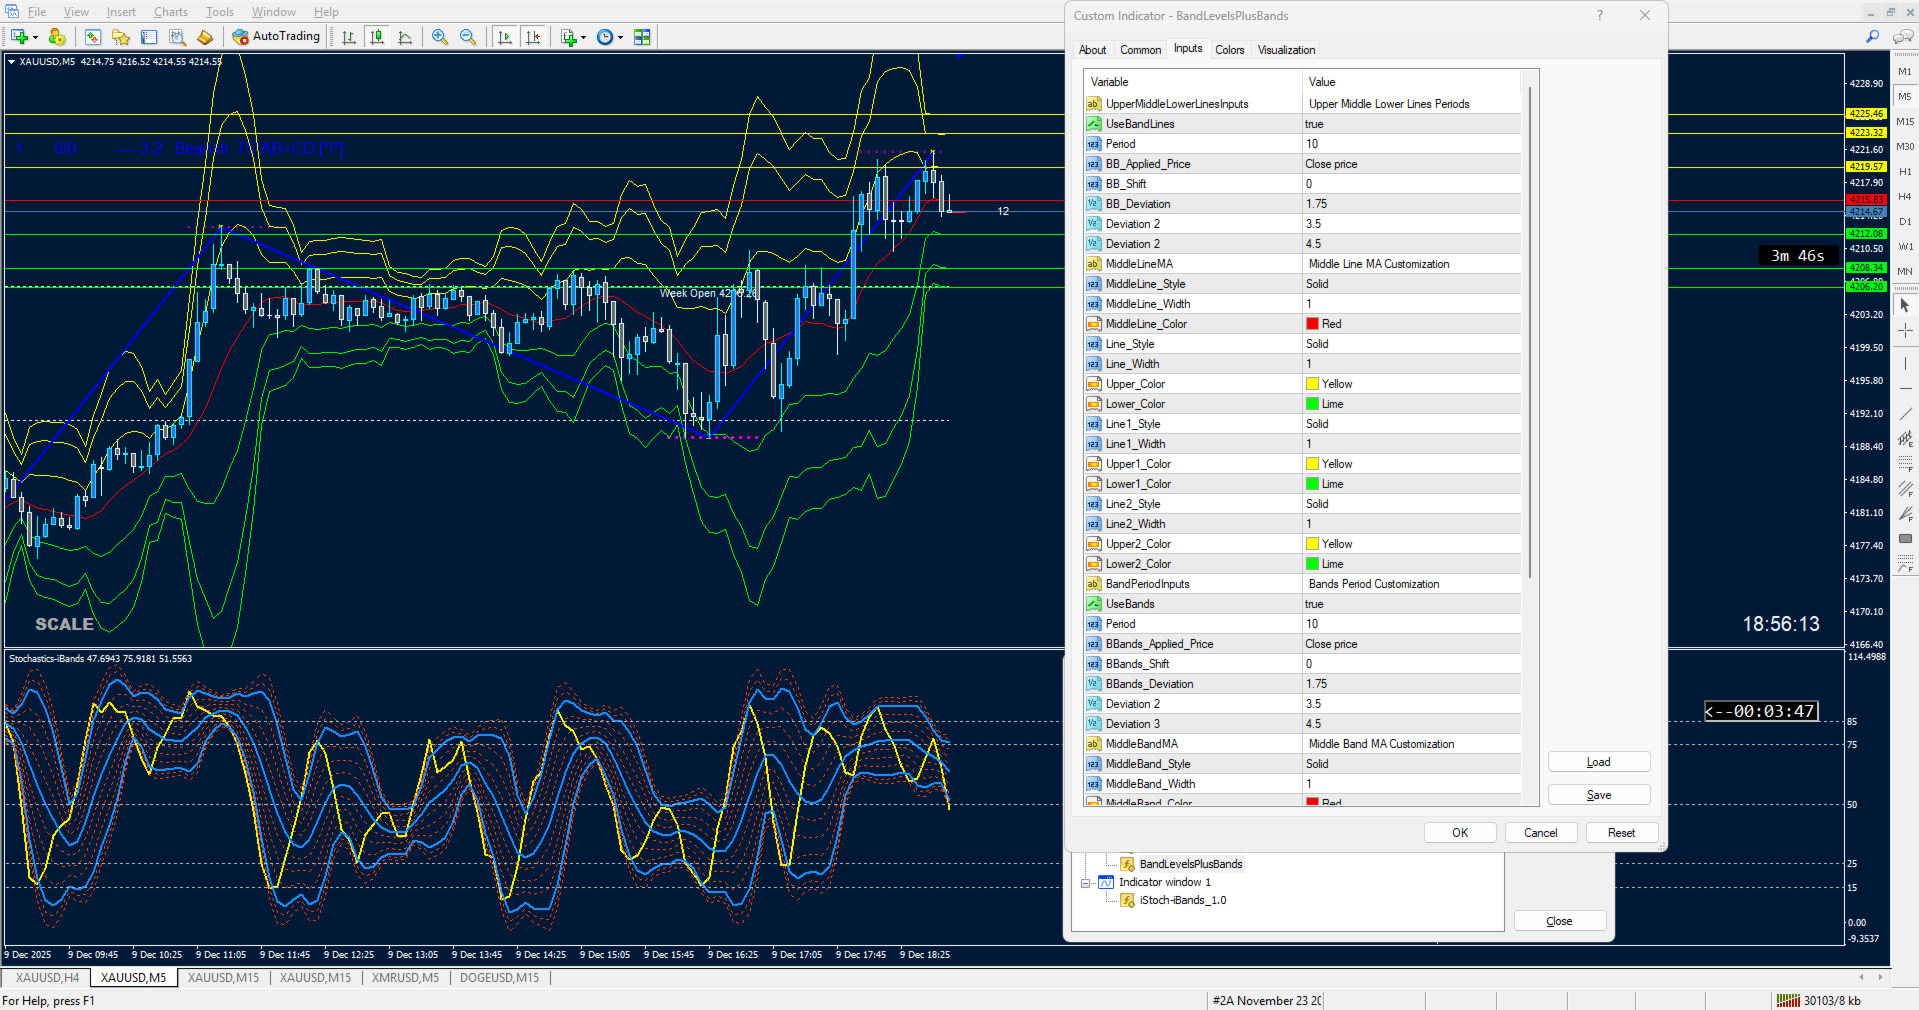
🎛 User Input Control Description (Clear, Structured)
Here’s how each input parameter is grouped and what it controls:
📐 Band Period & Price
BB_Period / BBands_Period: Number of bars used to calculate the moving average and standard deviation.
BB_Applied_Price / BBands_Applied_Price: Price type used (Close, Open, Weighted, etc.).
BB_Shift / BBands_Shift: Shifts the bands forward/backward in time.
📊 Deviation Settings
BB_Deviation / BBands_Deviation: Primary band width (default 1.75).
BB_Deviation1 / BBands1_Deviation1: Secondary band width (default 3.5).
BB_Deviation2 / BBands2_Deviation2: Tertiary band width (default 4.5).
🎨 Line Customization
MiddleLine_Style / Width / Color: Style, thickness, and color of the middle SMA line.
Upper_Color / Lower_Color: Colors for the primary upper/lower reference lines.
Line_Style / Line_Width: Style and thickness for primary reference lines.
Upper1_Color / Lower1_Color, Line1_Style / Width: Customization for secondary deviation lines.
Upper2_Color / Lower2_Color, Line2_Style / Width: Customization for tertiary deviation lines.
📈 Band Customization
MiddleBand_Style / Width / Color: Style and color of the plotted middle band curve.
UpperBands_Color / LowerBands_Color: Colors for the primary band curves.
UpperLowerBand_Style / Width: Style and thickness for primary band curves.
Upper1Bands_Color / Lower1Bands_Color, UpperLowerBand1_Style / Width: Customization for secondary band curves.
Upper2Bands_Color / Lower2Bands_Color, UpperLowerBand2_Style / Width: Customization for tertiary band curves.
⚙️ Toggles
UseBandLines (true/false): Show or hide horizontal reference lines.
UseBands (true/false): Show or hide continuous plotted bands.
🆔 Unique ID
UniqueID: Ensures multiple instances of the indicator can coexist without overlapping object names.

🎛 User Controls for BandLevels+Plus 1.0
This indicator extends standard band levels by plotting seven horizontal lines (three upper, one middle, three lower) based on multiple deviations. Buyers have full control over the following inputs:

📊 Band Calculation Settings
Period (BB_Period) → Define the moving average period used for band calculations
Shift (BB_Shift) → Shift bands forward/backward on the chart
Applied Price (BB_Applied_Price) → Choose the price type (Close, Open, High, Low, etc.)
Deviation Controls → Three independent deviation inputs:
BB_Deviation → Primary band deviation
BB_Deviation2 → Secondary deviation for extended bands
BB_Deviation3 → Tertiary deviation for outer bands

These inputs generate three upper levels, three lower levels, and one middle line.

🎨 Style & Appearance Controls
Upper Line Color → Customize the color of all upper bands (default: Yellow)
Middle Line Color → Customize the central equilibrium line (default: Red)
Lower Line Color → Customize the color of all lower bands (default: Lime)
Line Style → Solid or dotted line options

Line Width → Adjust thickness for visibility

🛠 Unique ID

UniqueID → Assign a unique identifier so multiple instances of the indicator can run on the same chart without conflicts.

✅ Buyer Value
With these controls, traders can:
Layer multiple band deviations for deeper volatility analysis
Customize line colors and styles for audit clarity
Run multiple instances safely with unique IDs

Visualize up to seven levels for precise support/resistance mapping

🎨 Product Description (Artful, Buyer‑Facing)

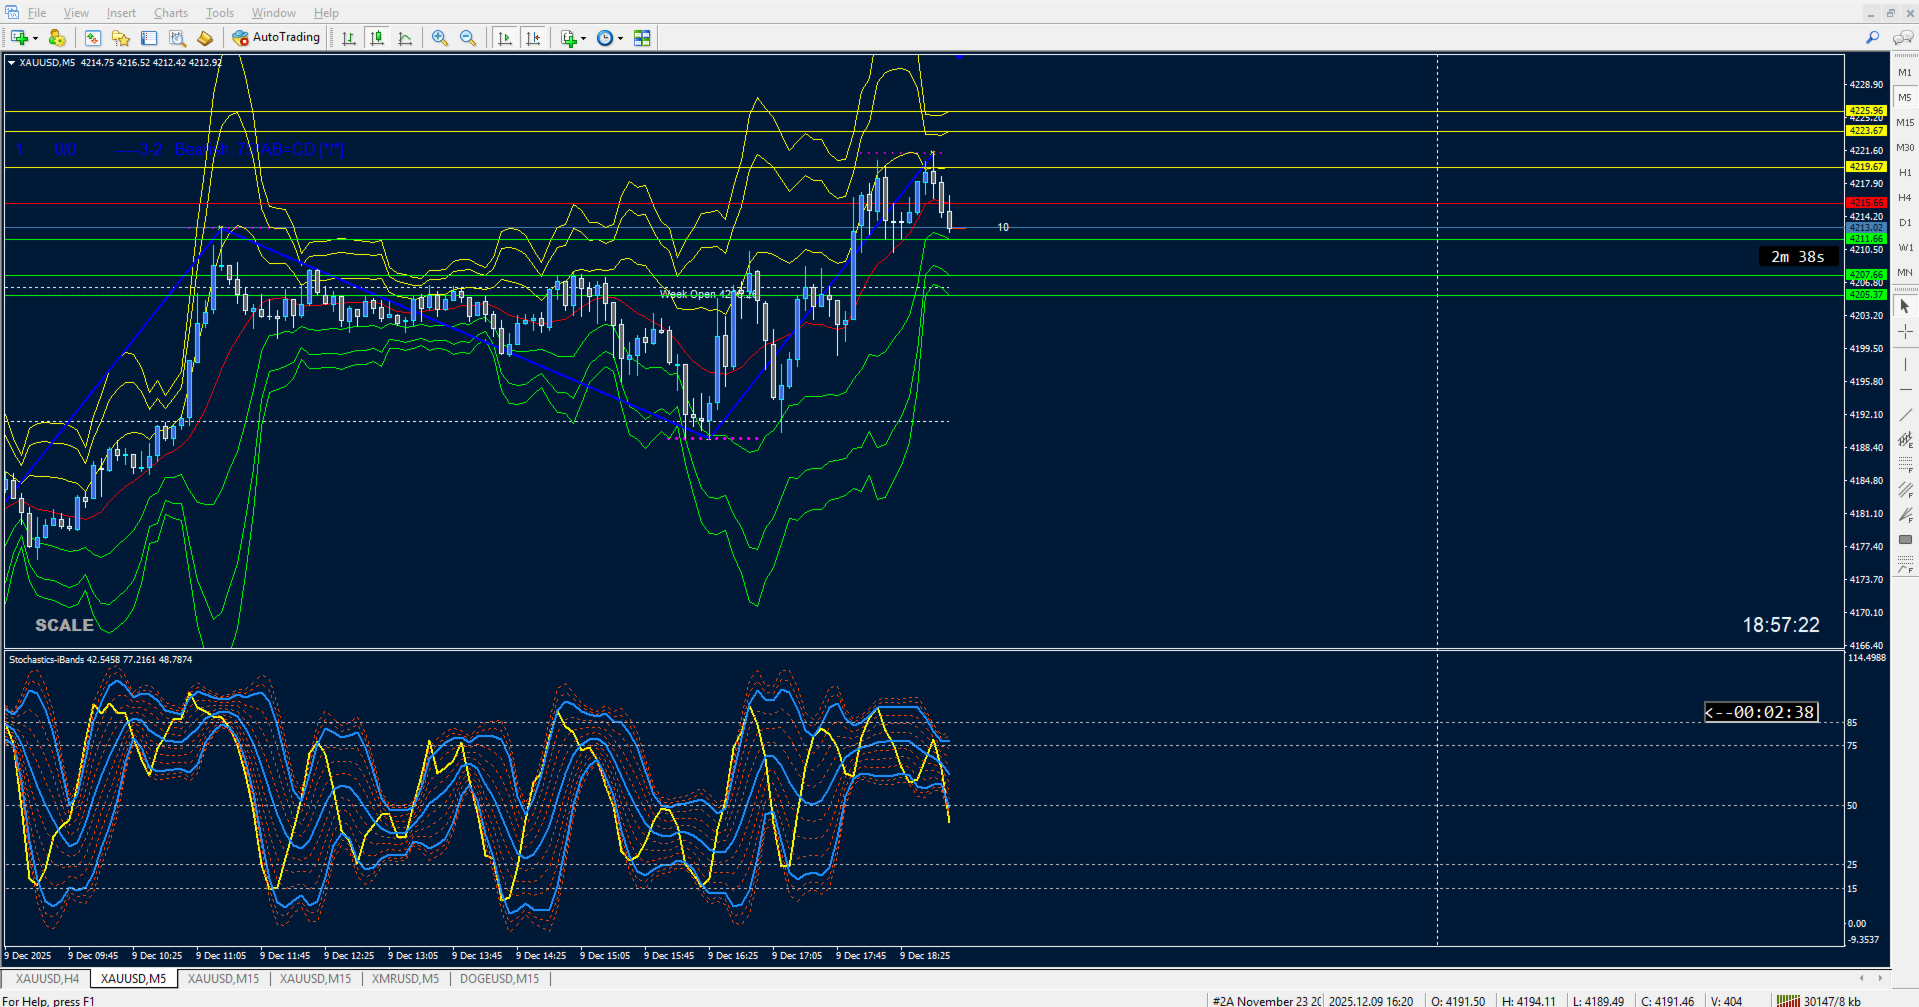
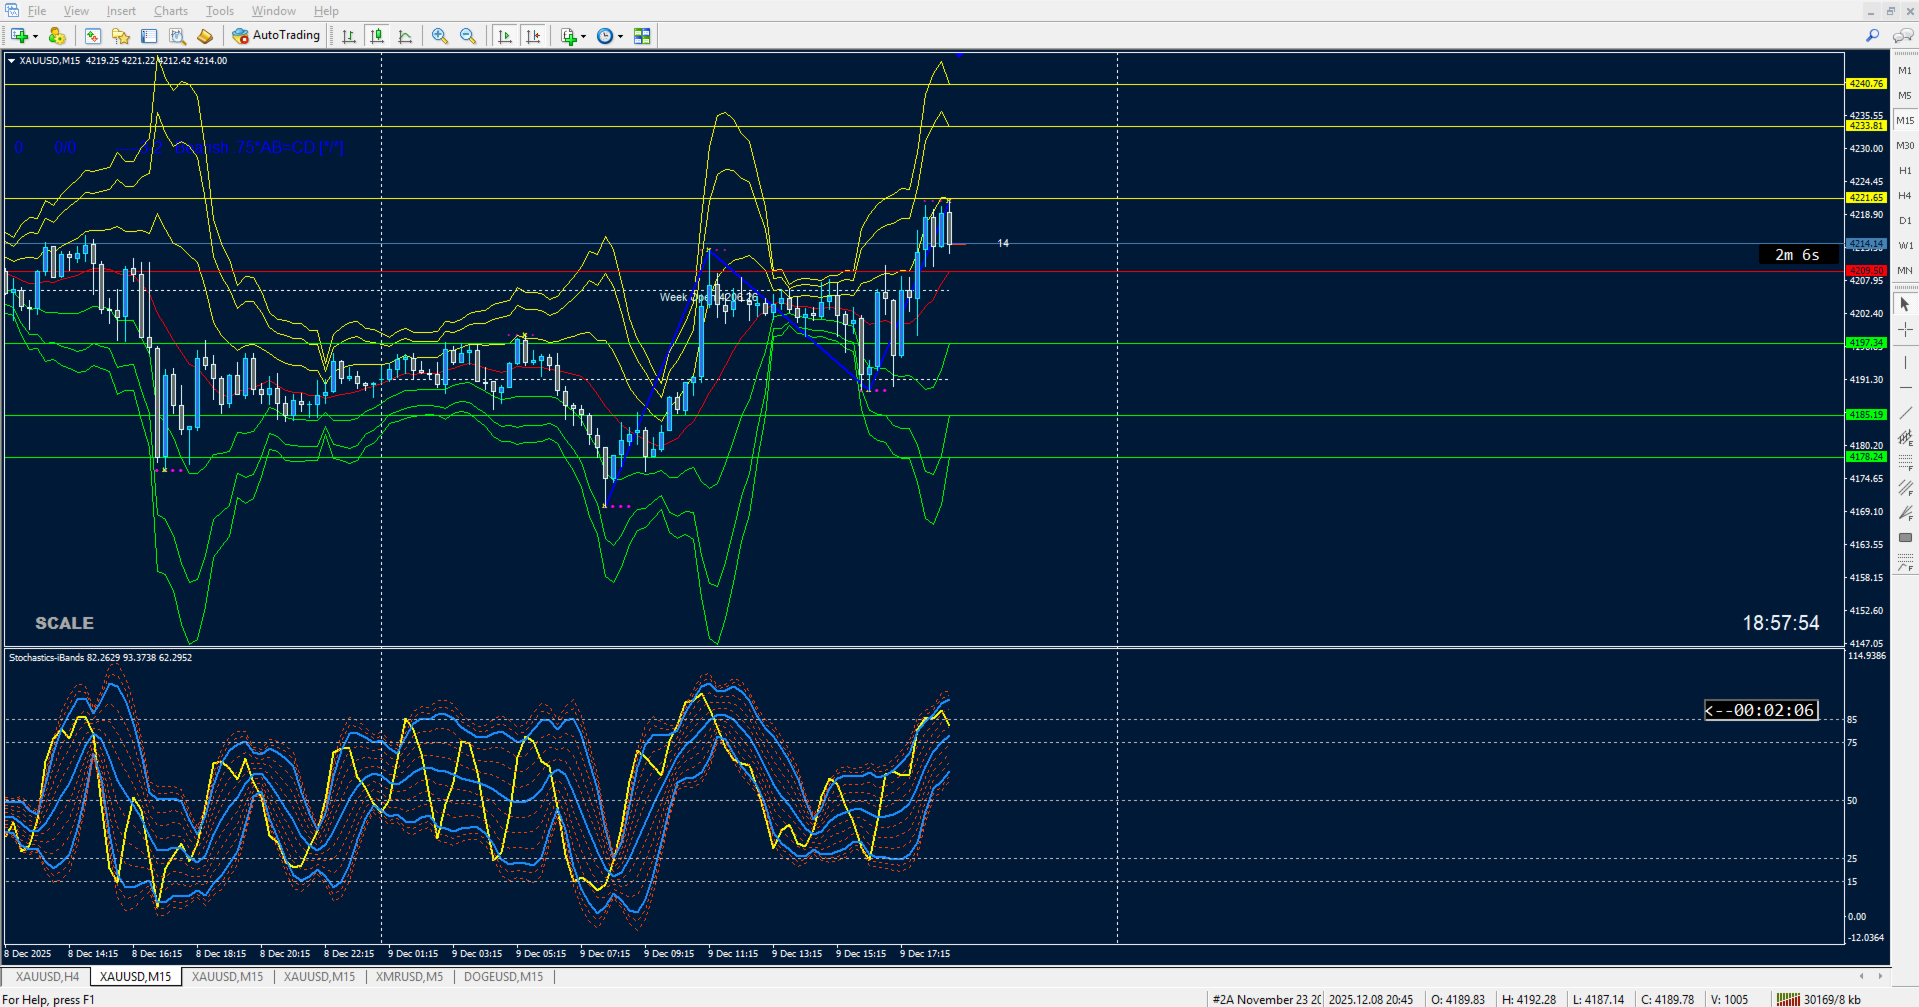
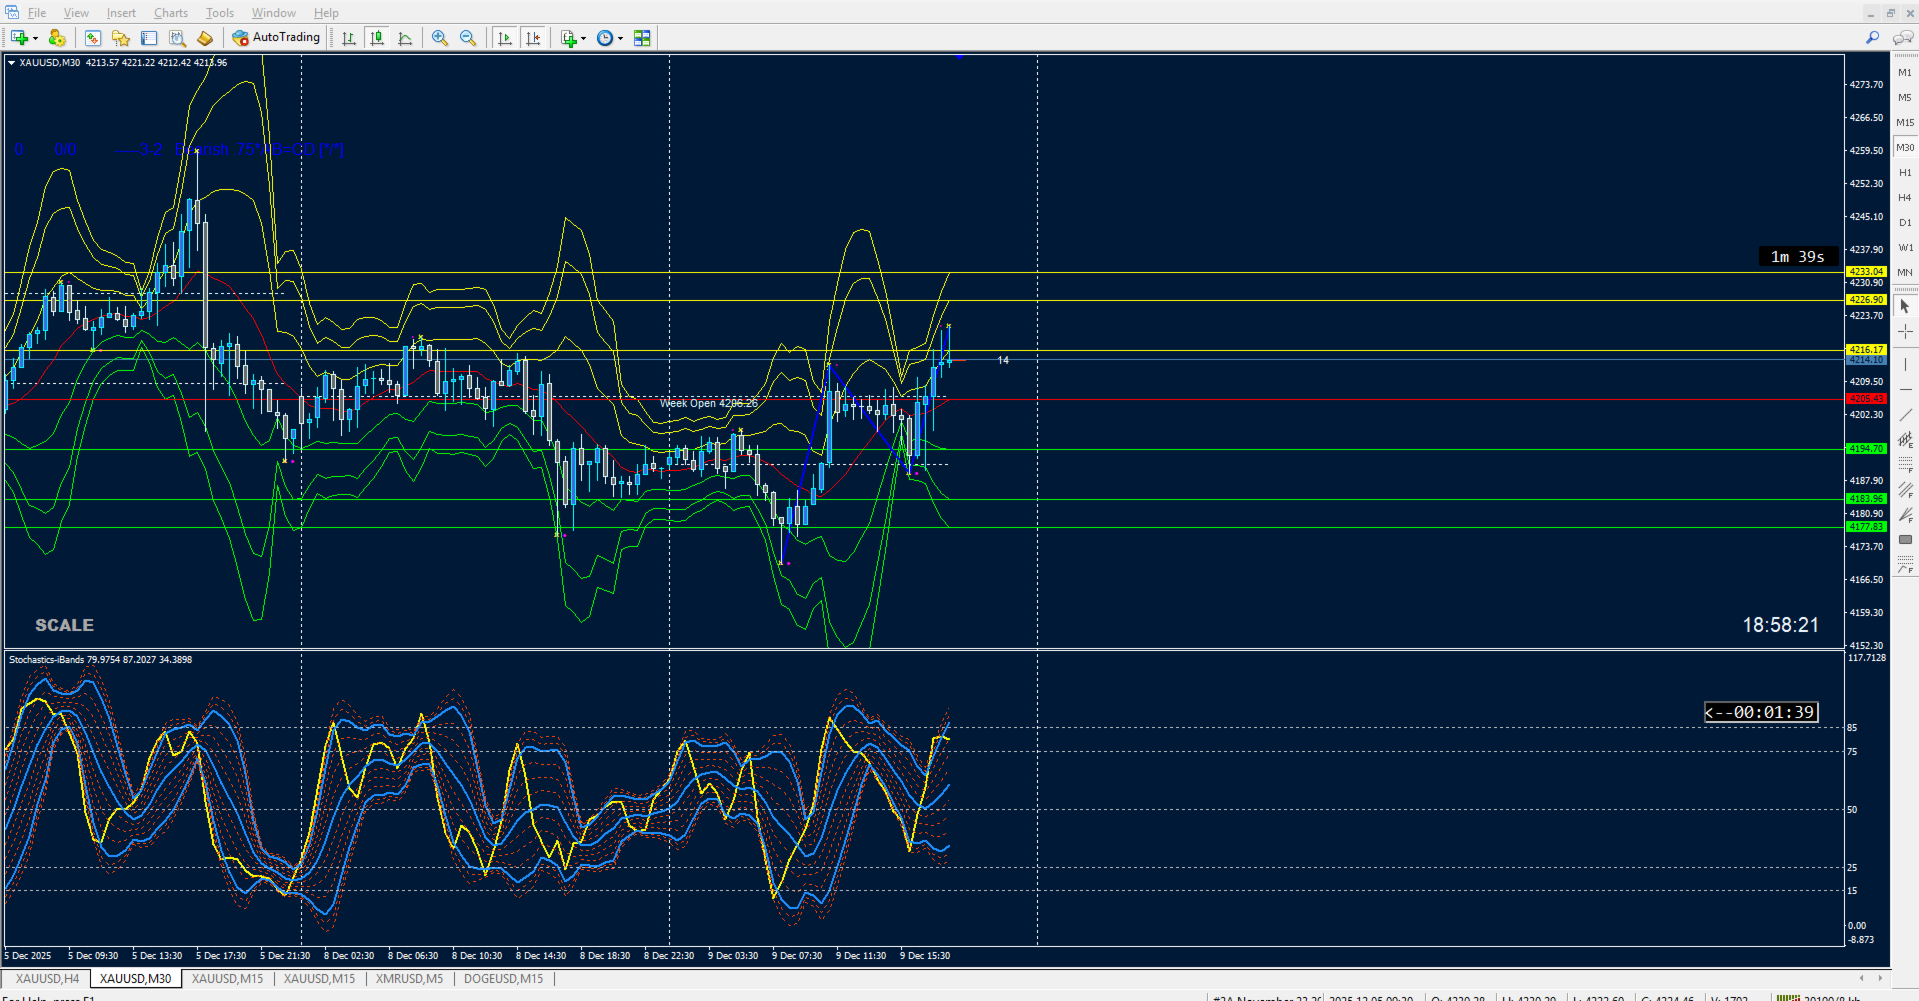
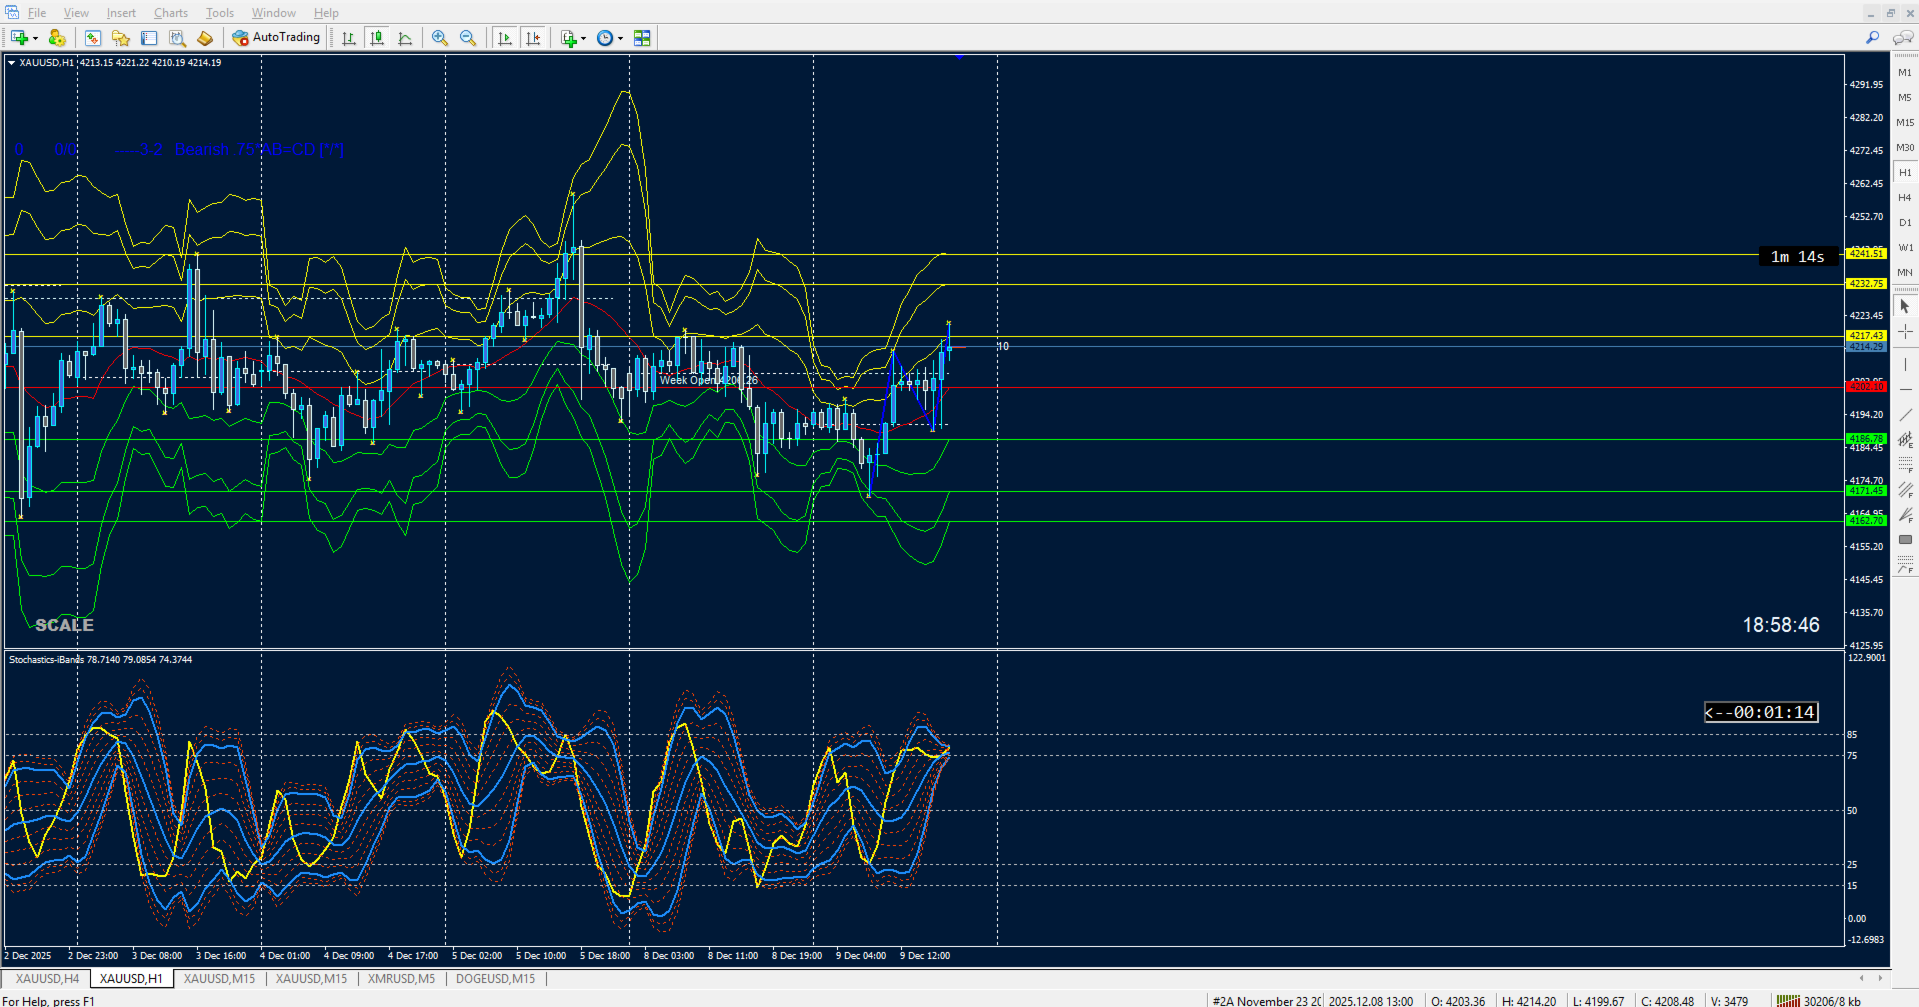
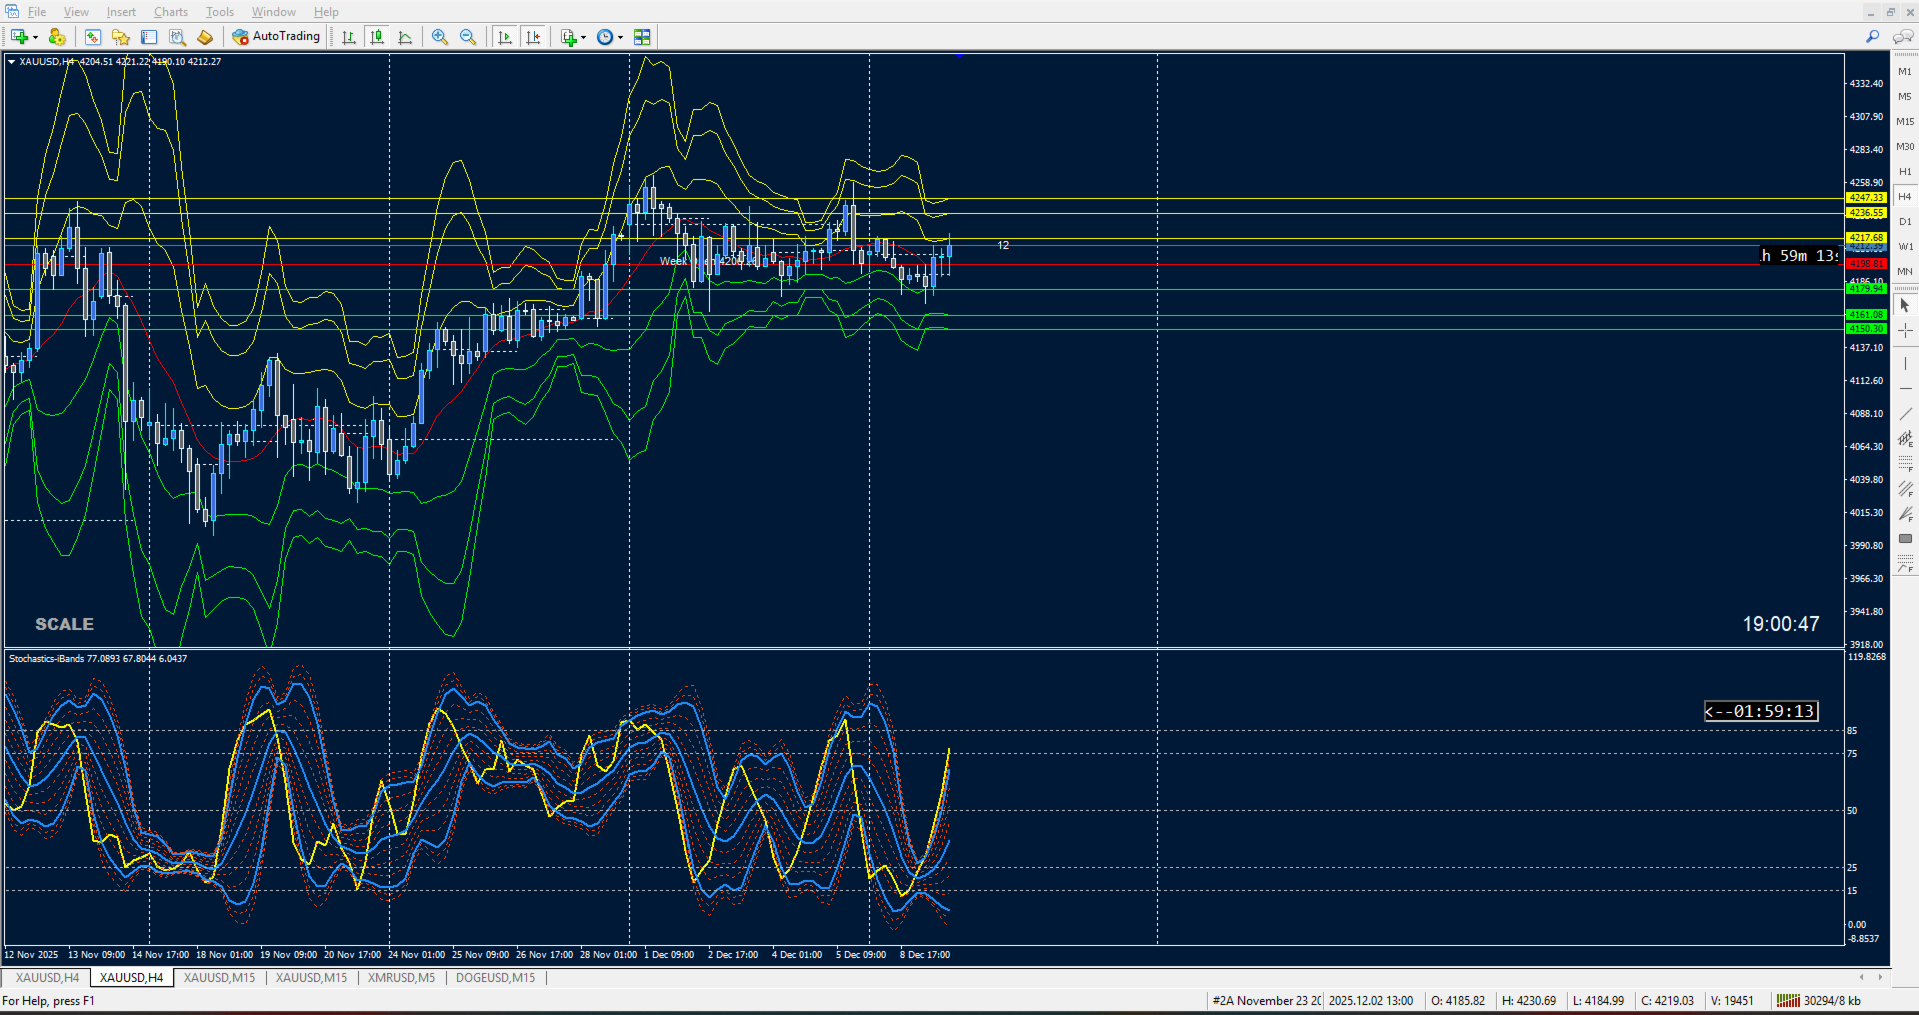
BandLevels+Plus is a precision‑engineered Bands indicator designed for traders who demand both audit clarity and visual elegance. Unlike standard bands, it layers multiple deviation classes (±1.75, ±3.5, ±4.5) to give you a richer sense of volatility zones and potential breakout levels.

Every band is drawn as a continuous curve across history, while horizontal reference lines mark the current levels for instant price context. This dual‑view design means you can see the evolving structure of volatility while also locking onto the exact thresholds that matter right now.

The indicator is fully customizable: colors, line styles, widths, and applied price can all be tailored to match your charting aesthetic. Whether you prefer subtle overlays or bold, high‑contrast signals, BandLevels+Plus adapts seamlessly.

Key Benefits:

Multi‑deviation bands for deeper volatility insight.

Horizontal reference lines for immediate price awareness.

Full customization of colors, widths, and styles.

Works with any applied price (close, open, weighted, etc.).

Clean buffer mapping ensures smooth plotting and no lag.

This is not just another Bollinger overlay — it’s a visual audit tool that makes volatility structure transparent, scalable, and trader‑friendly.

📘 Product Description for “Bands Levels Plus Bands 1.0”

Bands Levels 1.0 is a clean, audit-friendly indicator that plots three dynamic horizontal levels based on price volatility:

🔴 Upper Band Level

Projects the outer resistance zone based on recent price expansion.

Traders watch this level for potential reversal or breakout setups.

⚫ Middle Band Level

Represents the equilibrium line — a moving average of price.

It acts as a directional bias filter: price above suggests bullish momentum, below suggests bearish.

🔵 Lower Band Level

Projects the outer support zone based on recent price contraction.

Traders use this level to anticipate bounces or breakdowns.

These bands adjust dynamically to market conditions, offering a real-time framework for identifying overbought/oversold zones, trend strength, and volatility compression.


🛠 Technical Notes

Based on standard deviation from a moving average

Fully customizable: period, deviation, shift, and price type

Designed for visual clarity with color-coded levels and audit-friendly buffer mapping


推荐产品
Alpha Trend sign Alpha Trend sign 是我么长期以来非常受欢迎的交易工具,它可以验证我们的交易系统,并且明确的提示交易信号,并且信号不会漂移。 主要功能: •  根据市场显示活跃区域,根据指标可以很直观的判断当前行情是属于趋势行情,还是震荡行情。    并根据指标的指示箭头切入市场,绿色箭头提示买入,红色箭头提示卖出。 •  建议使用5分钟以上的时间周期进行交易,避免因为小周期波动出现频繁的交易信号。 •  您也可以开启信号提示,以免错过最佳的交易时机。 •  本指标不但可以很好的预测趋势行情,也可以在宽幅震荡行情中获利。 •  本指标本着大道至简的原则,适合不同阶段的交易者使用。 注意事项: •  Alpha Trend sign 有明确的进出场信号,不建议逆势操作,以免造成损失。 •  Alpha Trend sign 是特别成熟的指标,我们团队人手一个,使用它可以实现稳定盈利。     
Owl smart levels
Sergey Ermolov
4.24 (37)
MT5版本  |  FAQ Owl Smart Levels Indicator   是一個完整的交易系統,包含   Bill Williams   的高級分形、構建正確的市場波浪結構的 Valable ZigZag 以及標記準確入場水平的斐波那契水平等流行的市場分析工具 進入市場和地方獲利。 策略的详细说明 指示灯使用说明 顾问-贸易猫头鹰助手助理 私人用户聊天 ->购买后写信给我,我会将您添加到私人聊天中,您可以在那里下载所有奖金 力量在於簡單! Owl Smart Levels   交易系統非常易於使用,因此適合專業人士和剛開始研究市場並為自己選擇交易策略的人。 策略和指標中沒有隱藏的秘密公式和計算方法,所有策略指標都是公開的。 Owl Smart Levels 允許您快速查看進入交易的信號,突出顯示下訂單的水平並向您發送有關已出現信號的通知。 優點很明顯: 清楚地顯示主要和更高時間框架的趨勢方向。 指示儀器信號的出現。 標記開單、止損設置和固定利潤的水平。 沒有多餘的,只有必要的結構! ZigZag   表示全球趨勢的方向,因此也表示貿易方向。 市場反轉點的短線清楚地表明在什
PZ Harmonacci Patterns
PZ TRADING SLU
3.17 (6)
可以说,这是您可以为MetaTrader平台找到的最完整的谐波价格形成自动识别指标。它检测19种不同的模式,像您一样认真对待斐波那契投影,显示潜在的反转区域(PRZ),并找到合适的止损和获利水平。 [ 安装指南 | 更新指南 | 故障排除 | 常见问题 | 所有产品 ] 它检测19种不同的谐波价格形态 它绘制了主要,衍生和互补的斐波那契投影(PRZ) 它评估过去的价格走势并显示每个过去的形态 该指标分析其自身的质量和性能 它显示合适的止损和获利水平 它使用突破来表明合适的交易 它在图表上绘制所有样式比率 它实现了电子邮件/声音/视觉警报 受斯科特·M·卡尼(Scott M. Carney)的书的启发,该指标旨在满足最纯粹和最熟练的交易者的需求。但是,它采取了一种使交易更容易的方式:在向交易发出信号之前,它会等待Donchian朝正确方向突破,从而使交易信号非常可靠。 斐波那契投影与向量无关 它实现了电子邮件/声音/推送警报 它绘制了ABCD投影 重要提示: 为了符合 Scott M. Carney先生 的商标申诉,某些图案名称已重命名为不言自明的替代方式, Scott M.
Trendiness Index
Libertas LLC
5 (3)
"The trend is your friend" is one of the best known sayings in investing, because capturing large trendy price movements can be extremely profitable. However, trading with the trend is often easier said than done, because many indicators are based on price reversals not trends. These aren't very effective at identifying trendy periods, or predicting whether trends will continue. We developed the Trendiness Index to help address this problem by indicating the strength and direction of price trend
Day Pattern
Oleksandr Martsynyshen
Description: - D ay Pattern - an indicator that helps to identify patterns of price changes for the development of trading algorithms and strategies. For whom this tool? - For developers of trading strategies and algorithms. - Medium- and long-term traders. Time frames H1-W1. Features of the indicator: - There is a function of exporting indicator values to a file of the csv format. - Using the information panel, you can conduct an express analysis of trading tool. - The indicator is sui
Rainbow Price Visualizer
Vincent Jose Proenca
Rainbow Price Visualizer v1.21 See where the market really breathes. Turns your MT4 chart into an ultra-precise heatmap that highlights price zones favored by big players. Why it matters 300 price levels at 0.2‑pip resolution — microscopic detail. 8 visual themes (Rainbow, Fire, Ocean…) for instant readibility. Smart opacity: low noise fades, real zones pop. Lightweight rendering with automatic cleanup. Fully customizable: saturation, opacity, resolution, history depth. Bands project into the f
Chart Patterns Detect 15 patterns (Ascending Triangle, Descending Triangle, Rising Wedge, Falling Wedge, Bullish Flag, Bearish Flag, Bullish Rectangle, Bearish Rectangle Symmetrical triangle, Head and Shoulders, Inverted Head and Shoulders, Triple top, Triple Bottom, Double Top, Double Bottom) Use historical data to calculate the probability of each pattern to succeed (possibility to filter notification according to the chance of success) gives graphic indication about the invalidation level and
Crypto_Forex MT4 指标“三只黑乌鸦形态”,无需重绘,无延迟。 - “三只黑乌鸦形态”指标对于价格行为交易非常有效。 - 指标可检测图表上看跌的“三只黑乌鸦形态”:图表上显示红色箭头信号(见图)。 - 支持 PC、手机和电子邮件提醒。 - 其兄弟——看涨的“三白兵形态”指标也已推出(点击下方链接)。 - “三只黑乌鸦形态”指标非常适合与支撑/阻力位结合使用。 ................................................................................................................. // 优秀的交易机器人和指标可在此处获取: https://www.mql5.com/en/users/def1380/seller 这是仅在 MQL5 网站上提供的原创产品。
Magic Balance
Daniil Evstratenko
The indicator shows which trading pairs, strategies, robots and signals that you use are profitable and which are not. The statistic of trades and balance graph are displayed in the account currency and pips - to switch simply click on the graph. button "$"(top left) - minimize/expand and move the indicator panel button ">"(bottom right) - stretching and resetting to the original size Statistic of trades 1 line - account balance, current profit and lot of open trades; 2 line - the number of all
Trend Scanner
Vladimir Kalendzhyan
4.33 (6)
By purchasing this indicator, you have the right to receive a free copy of one of   my other indicator's or advisor’s!  (All future updates are included. No limits) . To get it , please contact me by  mql5 message ! The Trend Scanner trend line indicator displays the trend direction and its changes. The indicator works on all currency pairs and  timeframes. The indicator simultaneously displays multiple readings on the price chart: the support and resistance lines of the currency pair, the exist
Auto Fibo Pro m
DMITRII GRIDASOV
“Auto FIBO Pro” Crypto_Forex 指标 - 是交易中的绝佳辅助工具! - 指标自动计算并放置在图表斐波那契水平和局部趋势线(红色)上。 - 斐波那契水平指示价格可能反转的关键区域。 - 最重要的水平是 23.6%、38.2%、50% 和 61.8%。 - 您可以将其用于反转剥头皮或区域网格交易。 - 还有很多机会可以使用 Auto FIBO Pro 指标来改进您当前的系统。 - 它具有信息价差掉期显示 - 它显示所连接的外汇对的当前价差和掉期。 - 显示屏还显示账户余额、净值和保证金。 - 可以将信息价差掉期显示定位在图表的任何角落: 0 - 左上角,1 - 右上角,2 - 左下角,3 - 右下角。 点击这里查看高质量的交易机器人和指标! 这是仅在此 MQL5 网站上提供的原创产品。
PipFinite Trend PRO
Karlo Wilson Vendiola
4.88 (2246)
Breakthrough Solution For Trend Trading And Filtering With All Important Features Built Inside One Tool! Trend PRO's smart algorithm detects the trend, filters out market noise and gives entry signals with exit levels. The new features with enhanced rules for statistical calculation improved the overall performance of this indicator. Important Information Revealed Maximize the potential of Trend Pro, please visit www.mql5.com/en/blogs/post/713938 The Powerful Expert Advisor Version Automatin
PZ Support Resistance
PZ TRADING SLU
3.33 (3)
厌倦了绘制支撑线和阻力线? 支撑阻力 是一个多时间指标,可以自动检测并绘制图表中的支撑线和阻力线,并具有非常有趣的变化:随着时间的推移测试价格水平及其重要性的提高,线变得越来越粗。 [ 安装指南 | 更新指南 | 故障排除 | 常见问题 | 所有产品 ] 一夜之间增强您的技术分析 无需浏览图表即可检测重要的价格水平 一目了然地识别所有价格水平的相对优势 每次交易最多可节省半小时的绘图线 指标显示所有价格水平的期限 指示器不重涂 过去和现在的价格水平因接近程度而崩溃,并根据当前的市场行为进行了调整。在动作发生的地方绘制了线条,而不一定在峰值处绘制了线条。 价格水平随着时间的推移而被拒绝,变得越来越暗 定期清除不重要的价格水平以避免噪音 可自定义的时间范围选择和崩溃因子 它实现了电子邮件/声音/推送警报的突破 输入参数 指标设置:指标将从当前时间段读取价格,但您可以选择另一个。例如,您可以在H4图表中显示D1支撑线和阻力线。您还可以使用 价格水平密度 参数选择在图表上显示多少价格水平。 颜色设置:根据重要性输入所需的支撑线和阻力线颜色。 标签设置:(可选)可以在指示器中显示用于
Overview The Market Perspective Structure Indicator is a comprehensive MetaTrader indicator designed to provide traders with a detailed analysis of market structure across multiple timeframes. It identifies and visualizes key price action elements, including swing highs and lows, Break of Structure (BOS), Change of Character (CHOCH), internal structures, equal highs/lows, premium/discount levels, previous levels from higher timeframes, and trading session zones. With extensive customization opt
PinBar Pattern mk
DMITRII GRIDASOV
Crypto_Forex 指标 PINBAR 模式适用于 MT4,无需重绘,无延迟。 - “PINBAR 模式”指标是一款非常强大的价格行为交易指标。 - 指标可检测图表上的 PinBar: - 看涨 PinBar - 图表上显示蓝色箭头信号(见图)。 - 看跌 PinBar - 图表上显示红色箭头信号(见图)。 - 支持 PC、手机和电子邮件提醒。 - “PINBAR 模式”指标非常适合与支撑/阻力位结合使用。 ............................................................................... 点击这里查看高质量的交易机器人和指标! 本产品为独家产品,仅在本 MQL5 网站上提供。
MovingFlatBreakout
Stanislav Korotky
This indicator monitors the market for a flat state and possible breakout. The flat state is detected as a predefined number of consecutive bars during which price fluctuates inside a small range. If one of the next bars closes outside the range, breakout is signaled. The indicator shows 3 lines: blue - upper bound of flat ranges AND consecutive breakout areas; red - lower bound of flat ranges AND consecutive breakout areas; yellow - center of flat ranges (NOT including breakout areas). When a b
The indicator detects and displays 3 Drives harmonic pattern (see the screenshot). The pattern is plotted by the extreme values of the ZigZag indicator (included in the resources, no need to install). After detecting the pattern, the indicator notifies of that by a pop-up window, a mobile notification and an email. The indicator highlights the process of the pattern formation and not just the complete pattern. In the former case, it is displayed in the contour triangles. After the pattern is com
Trend Ray
Andriy Sydoruk
The indicator shows the potential trend direction by cyclical-wave dependence. Thus, all the rays of the intersection will be optimal rays, in the direction of which the price is expected to move, taking into account the indicator period. Rays can be used as a direction for potential market movement. But we must not forget that the approach must be comprehensive, the indicator signals require additional information to enter the market.
Auto Optimized RSI
Davit Beridze
5 (2)
Auto Optimized RSI 是一款智能且易于使用的箭头指标,旨在实现精准交易。它利用基于历史数据的模拟,自动识别当前品种和时间周期中最有效的 RSI 买入和卖出水平。 该指标既可以作为独立的交易系统使用,也可以结合您的其他交易策略一起使用。尤其适合日内交易者使用。 与传统 RSI 指标使用固定的 70/30 水平不同, Auto Optimized RSI 会根据真实的价格行为和回测结果动态调整水平。它会跟踪胜率、回撤和平均盈亏等关键指标,从而适应市场当前的走势,并基于“实际有效”的逻辑发出信号。 当 RSI 穿越经过优化的关键区域时,指标会在图表上显示 Buy 和 Sell 箭头,帮助交易者找到成功率更高的进场机会。 购买后请务必联系我,以获取额外赠送的工具和专属交易建议! 祝您交易顺利,稳步盈利!
Gold Phoenix
Yaroslav Varankin
The perfect tool for Scalng in the Forex markets You can trade both from signal to signal and using take profit  The algorithm does not use Zigzag!  No redrawing!  This is a channel instrument that uses a moving average as a filter. Moving Average  There are 2 parameters for the settings Ma Period = 5 period Moving Average  Channel 1.0 distance of channel lines from the chart Price Signal Filter - calculation of signal opening and filter There is a complete set of Alert There is a multi-timefram
Candles Indicator
Mikhail Gudyrin
A machine translation from the English product description was used. We apologize for possible imprecisions. 使用了英文产品描述的机器翻译。 我们对可能的不准确表示歉意。 最喜 欢的烛台价格行为模式的可视化系统。 附加后,指 标将自动在图表上标记下一个模式: 匹诺曹酒吧 - 带有长“鼻子”的小型条形杆,非常著名的反向模式; 内柱 - 一个柱,其范 围位于前一个柱的范围内。 它代表市 场的不确定性; 外柱 - 其范 围超出前一个柱的范围的柱。 它代表市 场的不确定性; 导轨图案 - 两个随之而来的对立柱,具有几乎相等的、较大的实体。 反向模式,实际上与更高时间框架的匹诺曹柱线模式相吻合; 主蜡 烛形态 - 蜡 烛的第五根,其中四个后续蜡烛的范围在第五根蜡烛的范围内 - 主蜡 烛。 这种模式代表市场整合,尤其是在较短的时间范围内。 差距 - 后 续柱的收盘价和开盘价 之 间的差距,不应忽视。 该指标的开发考虑了高性能要求。
Supply Demand WTC
Stefano Cocconi
Check My Product Contact me to discover all my services  Supply and demand zones are one of the most basic things a beginner forex trader learns. These zones are so important, price reacts off of them even after years since they first developed. And with the supply and demand zones indicator, a forex trader might not need to worry about drawing all these historical zones one after the other. The supply and demand zone indicator accurately draws the supply and demand zones of a currency pair o
Divergences are one of the most powerful signals in technical analysis, but they are difficult to spot with the naked eye in real time. RSI Divergence Hunter automatically scans the market for these discrepancies between price and momentum. What is a divergence? - Bullish: The price makes a lower low, but the RSI makes a higher low. (Buy signal). - Bearish: The price makes a higher high, but the RSI makes a lower high. (Sell signal). FEATURES: - Automatic Detection: Intelligent algorithm that
ATeam Divergence
Hoang Ngoc Thach
The CCI Divergence is a reasonably useful indicator in itself, but it is even more effective when used with divergence pattern trading. The CCI Divergence indicator signal is one of the most potent signals among the indicators that exist in the market. Here is new version for Divergence Indicator using CCI method, with more improvements. Divergences indicate a potential investment point because the directional moment does not confirm the price. A bullish divergence occurs when the underlying va
El indicador "MR BEAST ALERTAS DE LIQUIDEZ" es una herramienta avanzada diseñada para proporcionar señales y alertas sobre la liquidez del mercado basándose en una serie de indicadores técnicos y análisis de tendencias. Ideal para traders que buscan oportunidades de trading en función de la dinámica de precios y los niveles de volatilidad, este indicador ofrece una visualización clara y detallada en la ventana del gráfico de MetaTrader. Características Principales: Canal ATR Adaptativo: Calcula
This is a new strategy for SUPPLY DEMAND areas It is based on a calculation using the tick volume to detect the big price action in market for both bear /bull actions this smart volume action candles are used to determine the supply and demand areas prices in between main supply and demand lines indicate sideway market  up arrows will be shown when prices moves above the main supply and the secondary supply lines Down arrows will be shown when prices moves below the main demand and the secondary
Overview Harmonic Patterns MT4 is a technical analysis indicator designed for the MetaTrader 5 platform. It identifies and displays harmonic price patterns, such as Butterfly, Cypher, Crab, Bat, Shark, and Gartley, in both bullish and bearish directions. The indicator calculates key price levels, including entry, stop loss, and three take-profit levels, to assist traders in analyzing market movements. Visual elements and customizable alerts enhance usability on the chart. Features Detects six ha
Distinctive
Tatiana Savkevych
Distinctive is a forex trending arrow indicator for identifying potential entry points. I like it, first of all, because it has a simple mechanism of work, adaptation to all time periods and trading tactics. Created on the basis of a regression channel with filters. Plotting the Lawrence indicator signals on a price function chart using a mathematical approach. How it works - when the price breaks out in the overbought / oversold zone (channel levels), a buy or sell signal is generated. Everyt
Crypto_Forex 指标“晨星模式”适用于 MT4。 - 指标“晨星模式”是价格行为交易的非常强大的指标:无需重绘,无延迟。 - 指标检测图表上的看涨晨星模式:图表上的蓝色箭头信号(见图片)。 - 带有 PC、手机和电子邮件警报。 - 还有它的兄弟 - 看跌“黄昏之星模式”指标可用(点击以下链接)。 - 指标“晨星模式”非常适合与支撑/阻力位结合使用。 ................................................................................................................. 点击这里查看高质量的交易机器人和指标! 这是仅在此 MQL5 网站上提供的原创产品。
该产品的买家也购买
Meravith
Ivan Stefanov
5 (1)
该指标从每个点分析成交量,并计算该成交量的市场疲劳水平。 它由三条线组成: 牛市成交量疲劳线 熊市成交量疲劳线 表示市场趋势的线。该线根据市场是熊市还是牛市变化颜色。 您可以从任何选择的起点分析市场。一旦达到成交量疲劳线,确定一个新的起点来开始下一次分析。 您可以分析任何内容——趋势和修正。一个好的方法是每次当它达到趋势线或形成顶部或底部时移动指标。 趋势线与某一成交量疲劳线之间的距离越大,说明该方向的成交量越大。 趋势线可以作为开单的位置,而疲劳线则用于收集利润。 该系统非常独特,但又极其直观。 市场上没有类似的产品。 使用没有限制。可以在所有市场和所有时间框架中应用。 重要提示:在MetaTrader4测试器中检查时,双击紫色线条,然后左右移动它以分析市场。 如有任何问题,请随时联系我。
Looking for a powerful yet lightweight swing detector that accurately identifies market structure turning points? Want clear, reliable buy and sell signals that work across any timeframe and any instrument? Buy Sell Arrow MT Swing is built exactly for that — precision swing detection made simple and effective. This indicator identifies Higher Highs (HH) , Higher Lows (HL) , Lower Highs (LH) , and Lower Lows (LL) with remarkable clarity. It is designed to help traders easily visualize market str
Dynamic Scalper System
Vitalyi Belyh
5 (1)
“ Dynamic Scalper System ”指标专为在趋势波内进行剥头皮交易而设计。 已在主要货币对和黄金上进行测试,并可与其他交易工具兼容。 提供顺势短线建仓信号,并提供额外的价格变动支持。 指标原理: 大箭头决定趋势方向。 在趋势波内,我们采用一种生成小箭头形式的剥头皮交易信号的算法。 红色箭头代表看涨方向,蓝色箭头代表看跌方向。 敏感的价格变动线会沿着趋势方向绘制,并与小箭头信号协同作用。 信号运作方式如下:当线在适当时刻出现时,将形成入场信号;在出现线时,持仓;线完成后,平仓。 建议的操作时间范围为M1 - H4。 箭头在当前K线上方形成,如果下一根K线已开仓,则不会重新绘制上一根K线上方的箭头。 输入参数 Trend Wave Period - 趋势方向(大箭头)的周期,改变趋势波的时间间隔。值 1 表示趋势方向的最长持续时间,参数值越大,持续时间越短。 Scalper Arrows Period - 信号箭头(小箭头)的计算周期,改变入场信号的生成频率。值 3 表示最频繁的生成频率,参数值越大,箭头频率越低,准确度越高。 这些参数可以根据不同的时间范
The Nihilist 5.0 Indicator includes Forexalien and Nihilist Easy Trend trading strategies and systems. It is composed of an MTF Dashboard where you can analyze the different input possibilities of each strategy at a glance. It has an alert system with different types of configurable filters. You can also configure which TF you want to be notified on your Metatrader 4 platform and Mobile application The indicator has the option to view how could be a TP and SL by using ATR or fixed points, even w
NAM Order Blocks
NAM TECH GROUP, CORP.
3.67 (3)
MT4多時限訂單塊檢測指示器。 特徵 -在圖表控制面板上完全可自定義,提供完整的交互。 -隨時隨地隱藏和顯示控制面板。 -在多個時間範圍內檢測OB。 -選擇要顯示的OB數量。 -不同的OB用戶界面。 -OB上的不同過濾器。 -OB接近警報。 -ADR高低線。 -通知服務(屏幕警報|推送通知)。 概括 訂單塊是一種市場行為,它指示從金融機構和銀行收取訂單。著名的金融機構和中央銀行帶動了外匯市場。因此,交易者必須知道他們在市場上正在做什麼。當市場建立訂單塊時,它會像發生大多數投資決策的範圍一樣移動。 訂單建立完成後,市場將朝著上升和縮小的方向發展。訂單大宗交易策略的關鍵術語是它包括機構交易者正在做的事情。由於它們是主要的價格驅動因素,因此包括機構交易在內的任何策略都可以。 您將在任何時間範圍內實時看到訂單塊,使用我們的控制面板,您將能夠在所選的歷史記錄週期內檢測常規,拒收和未大寫的訂單塊。 現在您可以接收到訂單塊接近警報,我們在MT4上顯示屏幕通知,並將通知推送到您的手機!
OrderFlow Absorption – 專業級MT4買賣差與吸收訊號指標 釋放真正訂單流分析的力量,OrderFlow Absorption 是MetaTrader 4上最強大的買賣差(Delta)直方圖與吸收訊號指標。專為想看清每一個價格波動背後真相的交易者設計,這個工具揭示了隱藏的買賣壓力與推動市場的吸收事件。 功能特色 買賣差直方圖視覺化:   以清晰的色彩直方圖即時顯示買方與賣方壓力。 吸收訊號偵測:   先進邏輯自動辨識多空吸收事件,及早預警潛在反轉。 圖表標記:   吸收訊號直接標示於主圖表,方便視覺辨識。 彈出式警報:   新吸收訊號出現時即時通知。 自訂門檻:   過濾弱訊號,專注高勝率機會。 資源管理:   高效運算,適用於大型圖表也能流暢運行。 全品種兼容:   適用於任何商品與週期,包括外匯、指數、商品等。 簡易整合:   參數簡單,快速上手與調整。 OrderFlow Absorption 的邏輯說明 OrderFlow Absorption 採用專利演算法,能在沒有完整Tick數據的情況下,估算每根K棒的買賣壓力(Delta)。它分析成交量、價格行為、K
GoldRush Trend Arrow Signal
Kirk Lee Holloway
5 (2)
GoldRush 趨勢箭頭信號 GoldRush 趨勢箭頭信號 指標為 XAU/USD 中的高速、短期短線交易者提供精確、實時的趨勢分析。 專為1分鐘時間框架設計,此工具顯示方向箭頭以明確顯示入場點,使短線交易者能在波動市場中自信操作。 該指標包含主要和次要警示箭頭。主要信號為白色和黑色方向箭頭,用於指示趨勢方向的轉變;次要信號為藍色和紅色箭頭,用於確認主要箭頭指示的方向並提示潛在交易入場點。 注意:當趨勢方向發生變化後僅出現一個主要警報箭頭時,請注意可能會出現多個次要藍/紅箭頭。次要信號將在滿足信號標準的任何蠟燭圖後出現,因此在長期趨勢移動中,螢幕上將顯示大量次要箭頭(如附帶的截圖所示)。您可在設置中開啟或關閉任一箭頭類型。 以下是我使用此指標進行交易的方式: - 對於買入入場,我會耐心等待白箭頭在蠟燭收盤時出現,並在下一根可用蠟燭收盤時出現藍箭頭時進行買入交易。 - 對於賣出入場,我會耐心等待黑箭頭在蠟燭收盤時出現,並在下一根可用蠟燭收盤時出現紅箭頭時進行賣出交易。 - 獲利了結/止損設置由使用者自行負責,但我個人使用最低R:R為1:2,並發現這在倫敦/紐約開盤等
Elliott Wave Trend MT4
Young Ho Seo
4 (7)
Elliott Wave Trend was designed for the scientific wave counting. This tool focuses to get rid of the vagueness of the classic Elliott Wave Counting using the guideline from the template and pattern approach. In doing so, firstly Elliott Wave Trend offers the template for your wave counting. Secondly, it offers Wave Structural Score to assist to identify accurate wave formation. It offers both impulse wave Structural Score and corrective wave Structure Score. Structural Score is the rating to sh
ATC AlgoZone Indicator
Ameur Boudenne
5 (2)
Algo Trading Indicaor  With this indicator , you’ll have zones and trends that hight probability the price will reverse from it. so will gives you all the help that you need  Why should you join us !?  1-This indicator is logical since it’s working in previous days movement , to predict the future movements. 2-Algo trading indicator will help you to draw trends which is special and are too strong than the basics trend , trends will change with the frame time that you work on . 3-We can use
RelicusRoad Pro
Relicus LLC
4.63 (106)
您有多少次购买了一个交易指标,它拥有 出色的回测 、 实盘账户表现证明 以及惊人的数据和 无处不在的统计数据 ,但使用后您却 最终爆仓 ? 您不应该只相信一个信号本身,您需要知道它最初为何出现,而这正是 RelicusRoad Pro 最擅长的! 用户手册 + 策略 + 培训视频 + 带 VIP 权限的私人群组 + 提供移动版本 一种全新的市场视角 RelicusRoad 是外汇、期货、加密货币、股票和指数领域 全球最强大、最好的交易指标 ,为交易者提供 账户增长 所需的所有信息和工具。我们提供 技术分析 和 交易计划 ,帮助 每一位交易者成功 ,无论是 初学者 还是 高级交易者 。 它是一个 关键交易指标 ,提供足够的信息来 预测 未来市场。我们相信一个 完整的解决方案 ,而不是图表上几个毫无意义的不同指标。这是一个 一体化指标 ,显示 信号 、 箭头 + 价格行为 信息,这些信息 无与伦比 且 非常准确 。   RelicusRoad 利用机器学习(AI)技术,为交易者提供必要的信息和工具,帮助他们成为成功且消息灵通的交易者。   利用领先指标预测未来价格 几乎 所有技术指标
Smart Price Action Concepts
Issam Kassas
4.75 (12)
首先,值得强调的是,这个交易工具是非重绘、非重画和非滞后的指标,非常适合专业交易。 在线课程,用户手册和演示。 智能价格行动概念指标是一个非常强大的工具,既适用于新手,也适用于经验丰富的交易者。它将超过20个有用的指标合并到一个指标中,结合了高级交易思想,如内圈交易员分析和智能资金概念交易策略。该指标侧重于智能资金概念,提供有关大型机构交易方式的见解,帮助预测它们的动向。 它在流动性分析方面尤其擅长,有助于理解机构的交易方式。它擅长预测市场趋势,并仔细分析价格波动。通过将您的交易与机构策略对齐,您可以更准确地预测市场走向。该指标多才多艺,擅长分析市场结构,识别重要的订单区块,并识别各种模式。 它擅长识别BOS和CHoCH等模式,理解动量的转变,并突出显示供需强劲的关键区域。它还擅长发现强大的不平衡,并分析价格创造更高高点或更低低点的模式。如果您使用斐波那契回撤工具,该指标可以满足您的需求。它还可以识别相等的高点和低点,分析不同的时间框架,并通过仪表板显示数据。 对于使用更高级策略的交易者,该指标提供了工具,如公平价值差指标和优惠和折扣区域的识别。它特别关注高时间框架订单区块,并
Rtc ML Ai Predictor MT4
Muhammad Faisal Sagala
Product Description Rtc ML Ai Predictor — Futuristic Intelligence for Real-Time Market Decisions Bring robotic precision to your trading.   Rtc ML Ai Predictor   fuses   Machine Learning   with   SMA-shift dynamics   to forecast short-term momentum and trend inflection points with clarity. The model evaluates multi-factor market structure, assigns a   confidence score   to each signal, and lets you act only when conditions align with your rules. Why traders choose Rtc ML Ai Predictor AI-guided e
ECM Elite Channel is a volatility-based indicator, developed with a specific time algorithm, which consists of finding possible corrections in the market. This indicator shows two outer lines, an inner line (retracement line) and an arrow sign, where the channel theory is to help identify overbought and oversold conditions in the market. The market price will generally fall between the boundaries of the channel. If prices touch or move outside the channel, it's a trading opportunity. The ind
Introducing the Delta Volume Profile Indicator - Unleash the Power of Institutional Precision!  Technical Indicator: Are you ready to trade like the pros? The Delta Volume Profile Indicator is no ordinary tool. It’s a high-precision, cutting-edge indicator that puts the power of institutional-grade trading in your hands. This unique indicator analyses delta volume distribution in real-time, revealing the market's hidden buy/sell imbalances that the biggest financial institutions rely on to antic
Wall Street Indicator – 您的交易成功之钥! 厌倦了那些承诺很多却无法交付结果的工具?专为MT4设计, Wall Street Indicator 是提升您交易水平的终极解决方案。该指标经过精心开发,可提供清晰、可靠且精准的信号。以下是为什么 Wall Street Indicator 是初学者和经验丰富交易者的理想选择: 无与伦比的性能 – 经验证的结果 1年详细回测: 令人印象深刻的 90% 胜率 ,此指标在盈利能力上表现出了可靠性。在总共7006个信号中, 6242个是盈利的 ,每个信号平均收益为 29点 。 极低的亏损率: 仅 10% 的信号导致亏损,显示出算法的准确性和质量。 主要特点 无重绘(No Repaint): 信号生成后不会改变,确保完全透明。 无延迟(No Lagging): 实时捕捉市场机会,计算速度快如闪电。 无历史篡改(No BackPrint): 信号是固定的且可靠,完全值得信赖。 无与伦比的精确性 凭借先进算法,该指标提供: 精确的进场点: 完美定位以充分利用市场波动。 清晰的高低点: 最大化利润,同时将损失降至最低。 在波动市场中
BinaryUniversal
Andrey Spiridonov
BinaryUniversal is a signal indicator for binary options and Forex. In its work, the indicator uses a complex algorithm for generating signals. Before forming a signal, the indicator analyzes volatility, candlestick patterns, important support and resistance levels. The indicator has the ability to adjust the accuracy of the signals, which makes it possible to apply this indicator for both aggressive and conservative trading. The indicator is set in the usual way, it works on any time period and
Introduction to X3 Chart Pattern Scanner X3 Cherart Pattern Scanner is the non-repainting and non-lagging indicator detecting X3 chart patterns including Harmonic pattern, Elliott Wave pattern, X3 patterns, and Japanese Candlestick patterns. Historical patterns match with signal patterns. Hence, you can readily develop the solid trading strategy in your chart. More importantly, this superb pattern scanner can detect the optimal pattern of its kind. In addition, you can switch on and off individu
"Dragon's Tail"是一种综合交易系统,而不仅仅是一个指标。这个系统以分钟为单位分析每一个蜡烛,这在市场波动性高的情况下特别有效。 "Dragon's Tail"系统确定市场的关键时刻,称为"公牛和熊的战斗"。基于这些"战斗",系统给出交易方向的建议。在图表上出现箭头的情况下,这表明有可能在指示的方向上开设两个交易。黄线和绿线分别作为第一和第二个交易的获利水平。在达到黄线水平并关闭第一笔交易后,建议在第二笔交易开启的水平上设定止损。 时间框架和工具的选择取决于交易员的偏好,但为了达到最佳结果,建议使用H4和D1的时间框架,并考虑所选工具的差价大小。 "Dragon's Tail"的设置参数可以分为两组: 直接影响交易结果的参数: 历史深度 - 只影响图表上入口点的显示。推荐值:D1 - 10,H4 - 15,H1 - 20。 获利1和获利2 - 影响最终结果。取决于时间框架的推荐值:D1 - 250/450,H4 - 150/250,H1 - 75/150。 负责系统视觉设计的参数。可以根据交易员的意愿进行设置。 重要的是要记住,"Dragon's Tail"是一个需要交易员
Super Signal – Skyblade Edition 專業級無重繪 / 無延遲趨勢信號系統,擁有卓越勝率 | 適用於 MT4 / MT5 核心特色: Super Signal – Skyblade Edition 是一套專為趨勢交易設計的智能信號系統。 其採用多重濾波邏輯,僅篩選出具有明確方向性、動能強勁且波動結構健康的走勢進場點。 本系統 不預測高點或低點 ,只有在同時滿足以下三項條件時才會觸發交易信號: 趨勢方向明確 動能持續增強 波動率結構穩定 此外,系統還結合市場流動性分析,以進一步提升信號的準確性與觸發時機。 信號特性: 所有箭頭信號皆為 100% 無重繪,無延遲 信號一旦出現即固定於圖表,不會閃爍或消失 提供圖表箭頭、資訊面板、彈出通知、聲音提示及推播訊息 支援 EA 呼叫(Buffer 輸出),可整合至自動化交易或信號跟單系統 提供預設參數模板,免調整即可使用,適合新手快速上手 所有數據皆採用「嚴格回測標準」——每筆交易訊號在觸發後的 60 根 K 線內, EURUSD 與 USDJPY 至少須達成 +50 點獲利,黃金(XAUUSD)則須達成 +100 點
Hit Rate Top Bottom Signal
Martin Alejandro Bamonte
命中率顶部底部信号 命中率顶部底部信号 命中率顶部底部信号 提供了一种完全创新的方法。 它非常适合那些希望预先评估信号在特定 TP-SL 下的表现以及在哪些货币对/时间框架(TF)中效果最佳的人。 命中率顶部底部信号 策略是 任何交易员和任何交易类型 的重要工具,因为它不仅发出 精确且不重绘的信号 ,明确指示何时交易以及交易方向,而且还 详细记录每个货币对和时间框架的命中率 ,并预设止盈(TP)和止损(SL)。 这使得能够提前知道信号的有效性比率 ,对于良好的风险管理和精确的交易至关重要。 该策略的独特之处在于它专注于在波动的反转点进行检测,而不是在整个行情中,这使得信号的发出频率比传统的顶部底部信号更高,专注于 市场每一个重要波动的关键时刻。 这种以百分比显示 信号历史效果与SL/TP比率结合的能力 使得这项策略成为安全交易的最佳选择,让交易员能够基于数据做出决策。 依靠一个不仅清晰直接而且历史记录良好的信号,我们正在使用市场上最好的策略之一。 如何使用该系统进行交易? 打开多个货币对并在每个货币对上加载指标。现在,分析每个货币对,以确定哪些货币对和时间框架(TF)信号效果
Gold Channel XAUUSD
Paulo Rocha
5 (4)
Gold Channel is a volatility-based indicator, developed with a specific timing algorithm for the XAUUSD pair, which consists of finding possible corrections in the market. This indicator shows two outer lines, an inner line (retracement line) and an arrow sign, where the theory of the channel is to help identify overbought and oversold conditions in the market. The market price will generally fall between the boundaries of the channel. If prices touch or move outside the channel it is a tradi
终极市场趋势大师 精准掌握市场方向的力量 Ultimate Market Master Trend 是一款为追求 清晰、精准与信心 的交易者打造的多功能市场趋势分析指标。 它融合了 智能趋势识别系统 、 多时间周期随机指标 以及 动态可视信号 ,帮助您轻松捕捉高胜率的买卖机会。  核心功能 1. 智能趋势系统(主图显示) 采用 LWMA200(线性加权移动平均线) 来确定市场主方向。 通过颜色区分趋势状态: 绿色云层 = 多头趋势(买入) 红色云层 = 空头趋势(卖出) 当价格与趋势线交互时显示 实时买卖箭头 ,帮助您及时识别趋势反转点。 2. 多时间周期随机指标面板(副窗口显示) 同时显示多个时间周期(如 M5、M15、M30)的随机指标信号。 每个时间周期以颜色代表动能方向:  绿色 → 上升动能  红色 → 下降动能  黄色 → 中性震荡 让您轻松确认主要趋势与当前周期的一致性,避免逆势操作。 3. 智能信号与提醒系统 仅在 趋势真正变化或确认交叉 时发送提醒。 启用 每日一次信号模式 ,避免重复提示。 适用于 手动交易者 、 信号服务提供者 与 EA 策略开发者 。 4. 完
Key level wedge pro
Presley Annais Tatenda Meck
5 (1)
We have combined all of our beloved indicators the likes of: Key level order block , Key level supply and demand , Key level liquidity grab and Key level wedge into one single indicator and dashboard. Whats new Dashboard : There is an easy access dashboard for all your needs. Multi-timeframe button : There is now a multi-timeframe option for Order Blocks and Supply and demand zones, making it easy to see higher timeframe zones easily on the current timeframe by just clicking the desired timefra
该指标是一款多功能技术分析工具,基于自适应指数移动平均线(EMA)与通过真实波动幅度均值(ATR)计算的波动率过滤器相结合而构建。其设计目的是精确识别当前价格方向,突出潜在趋势转折的关键区域,并直观显示可能的反转区域。 算法的核心是通过两层波动率构建动态趋势带:外层和内层。外层边界起到强突破信号的作用,而内层水平则在指数均线斜率发生变化时捕捉价格结构的温和反转。这种组合确保了指标在保持对市场噪音抗干扰性的同时,也具有较高的灵敏度。 图形表现中加入了对比鲜明的箭头标记,用于提示趋势的变化。该指标不会重绘信号,这使其在交易策略和风险管理系统中成为可靠的过滤工具。 优势 多层波动率分析 —— 通过使用内外ATR通道,既能捕捉剧烈突破,也能识别趋势的逐渐转向。 自适应平滑 —— 内置可调系数的EMA平滑算法,能够适应不同的市场环境。 无重绘 —— 信号在出现时固定不变,确保历史分析的可靠性。 清晰可视化 —— 明确的趋势线与箭头标记,可即时评估市场状态。 灵活配置 —— 广泛的参数设置,可适配各种时间周期和金融工具。 通用应用 —— 既可用于趋势跟随策略,也可作为逆势过滤器。 指标参数 算法
---- Brand New Strategy. Three Month Rent is $30. ONE YEAR RENT ONLY $50. FREE EURUSD VERSION AVAILABLE UNDER << Forecast System Gift >>. NO NEED FOR BACKTEST! Link to the FREE version -->  https://www.mql5.com/en/market/product/110085?source=Site --- This is a simple strategy based on BREAKOUT and FIBONACCI levels. After a breakout, either, the market: - continues the move directly to the 161, 261 and 423 levels, or - retraces to the 50% level (also called a correction) and thereafter continues
Trend AI Indicator
Aleksandr Goryachev
Trend AI Indicator 描述: Trend AI Indicator 是一款强大的市场分析工具,利用人工智能识别趋势和关键水平。该指标自动适应不断变化的市场条件,提供准确的数据以支持决策。 主要功能: 趋势识别:   该指标使用机器学习算法准确判断趋势方向(上升、下降、横盘)。 关键水平:   基于历史数据自动构建支撑和阻力水平。 安全交易区:   定义最小可能止损的区域,降低风险。 适应性:   该指标适应市场波动,减少错误数据。 自定义设置:   可根据不同交易策略和时间框架进行调整。 优势: 由于使用AI,具有高精度。 适用于所有市场类型(外汇、股票、加密货币)。 安全交易区通过最小止损降低风险。 易于使用,适合初学者和专业人士。 设置: Indicator Color Theme:   设置与截图中显示的颜色主题。 Sensitivity Factor:   调整指标的敏感度。 Safety Factor:   调整安全止损功能的触发条件。 Trading Area Coefficient:   安全交易区的大小。 注意: 为确保指标正常运行,至少需要1500
Binary Booster
Yaroslav Varankin
5 (1)
Binary Options Trading Indicator: A Reliable Tool for Your Trades This indicator is specifically designed for binary options trading and has proven its high quality, reliability, and adequate accuracy, depending on the dynamics of the chart. Key Points: Signal Interpretation: When a blue cross signal appears, it indicates a potential entry into a trade, though it is considered a weak signal on its own. However, if the blue cross is accompanied by an arrow, it is considered a more reliable buy s
PTS Precision Index Oscillator V2
PrecisionTradingSystems
5 (1)
精密指数振荡器(Pi-Osc)由Precision Trading Systems的Roger Medcalf开发 版本2经过精心重新编码,以在您的图表上加载速度非常快,还加入了一些其他技术改进,以提高体验。 Pi-Osc旨在提供准确的交易定时信号,旨在找到极端的耗尽点,这些点是市场被迫去触及,以清理每个人的止损单。 该产品解决了一个古老的问题,即知道极端点在哪里,这使得交易员的生活变得更加简单。 这是一个高度复杂的共识指标,与行业标准的振荡器相比,具有一些强大的区别。 它使用的一些特征包括需求指数、资金流动、RSI、随机指标、模式识别、成交量分析、标准偏差极端点以及不同长度上述各种变化的分歧。 乍一看,对于未经培训的人来说,它似乎与任何其他振荡器没有什么不同,但当与其他振荡器(如RSI或动量等)相对比时,这个指标的真正威力开始显现。 据我所知,没有其他振荡器可以频繁地精确指出顶部和底部,具有相同的定期效率。 精密指数振荡器由许多不同的数学方程组成,用于测量多个时间框架采样中的价格和成交量变动,从而高度准确地预测趋势可能发生转折的位置。 PTS Pi-Osc V2非
Trend Precision Oscillator – 精确趋势分析工具 Trend Precision Oscillator 是一种旨在提供高分辨率、深度解析价格行为的技术指标。它基于专有算法,结合波动性、价格方向动态和微观震荡,对价格结构进行分析,并输出范围为 –10 000 到 +10 000 的数值。 绝对值代表趋势强度,正负号则指示主要方向。交易者可据此了解市场是否有趋势,以及趋势的强度,从而在分析中减少噪音干扰。 该指标的显著特点是其 多资产兼容性 :可用于 外汇、指数、股票、大宗商品、加密货币和差价合约(CFD) ,并支持 所有时间框架 ,从分钟级到周/月级图表均适用。无论是日内交易员还是中长期分析者,皆可应用此指标。 解读指标时,数值接近零表示市场处于平衡或盘整阶段,而极值(正或负)则暗示趋势正在发力且有持续可能。价格与指标之间的分歧(背离)可能预示动能衰竭或趋势反转,特别是在心理关口或盘整区域附近。 该指标虽可独立使用,但也可与其他技术工具结合,以构建复杂策略或增强决策信心。其结构支持 Expert Advisor 和自动化交易系统的集成。 免责声明 :Trend
作者的更多信息
User Controls for BandLevels+Plus 1.0 This indicator extends standard band levels by plotting seven horizontal lines (three upper, one middle, three lower) based on multiple deviations. Buyers have full control over the following inputs: Band Calculation Settings • Period (BB_Period) → Define the moving average period used for band calculations • Shift (BB_Shift) → Shift bands forward/backward on the chart • Applied Price (BB_Applied_Price) → Choose the price type (Close, Open, High, Low,
User Controls for iRSI‑iBands 1.0 This indicator gives traders full flexibility to customize both the RSI calculation and the band levels. Buyers will have control over the following inputs: ShortName updated in download. RSI Settings • Applied Price → Choose the price type (Close, Open, High, Low, etc.) • RSI Period → Set the lookback period for RSI calculation • RSI Line Style → Solid or dotted line options • RSI Line Width → Adjust thickness for visibility • RSI Line Color → Select you
User Controls for iMomentum–iOBV–iBands 1.0 This indicator combines On‑Balance Volume (OBV), Momentum, and adaptive Bands. Buyers have full control over the following inputs and style settings: ShortName updated in download. OBV Settings • Applied Price (OBVPrice) → Choose how OBV is calculated (Close, Weighted, Typical, etc.) Momentum Settings • Momentum Period → Define the lookback period for Momentum calculation • Momentum Line Style → Solid or dotted line options • Momentum Line Wid
User Controls for iStochastics‑iBands 1.0 This indicator gives traders full flexibility to customize both the Stochastic Oscillator calculation and the band levels. Buyers will have control over the following inputs: ShortName updated in download. Stochastic Settings • Price Field → Choose between Low/High or Close/Close for stochastic calculation • %K Period → Set the lookback period for the %K line • %D Period → Define the smoothing period for the %D line • Slowing → Add addi
User Controls for iBearsPower‑iRSI‑iBands-MA-Levels 1.0 This indicator gives traders full flexibility to customize the Bears Power calculation, the RSI Array, and the multi‑band Array and Moving Average, user adjustable, up to 8 Levels. Buyers will have control over the following inputs: ShortName updated in download. Bears Power Settings•  Applied Price → Choose the price type (Close, Open, High, Low, Median, Typical, Weighted) •  BearsPowerPeriod → Set the lookback period for Bears Powe
筛选:
无评论
回复评论