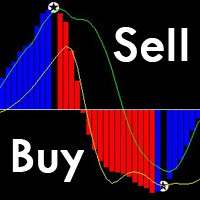
Hit Rate Top Bottom Signal

  • 指标
  • Martin Alejandro Bamonte
    Martin Alejandro Bamonte
    拥有24年交易经验和14年编程经验,我的职业生涯是一段不断学习的旅程。从年轻时起,我就对如何理解市场这个不可预测的世界充满了好奇……直到我发现,借助技术可以将复杂性转化为精准且实用的工具。
    在职业生涯的每一步,我都在不断提升自己的技能,经历了挑战、失败和成功,这让我深刻理解到,交易不仅仅是数字,它更需要纪律、策略,以及对持续改进的执着追求。我的目标始终明确:为交易者打造能够在任何市场环境中都能自信操作的解决方案。
  • 版本: 1.0
  • 激活: 15
命中率顶部底部信号

命中率顶部底部信号

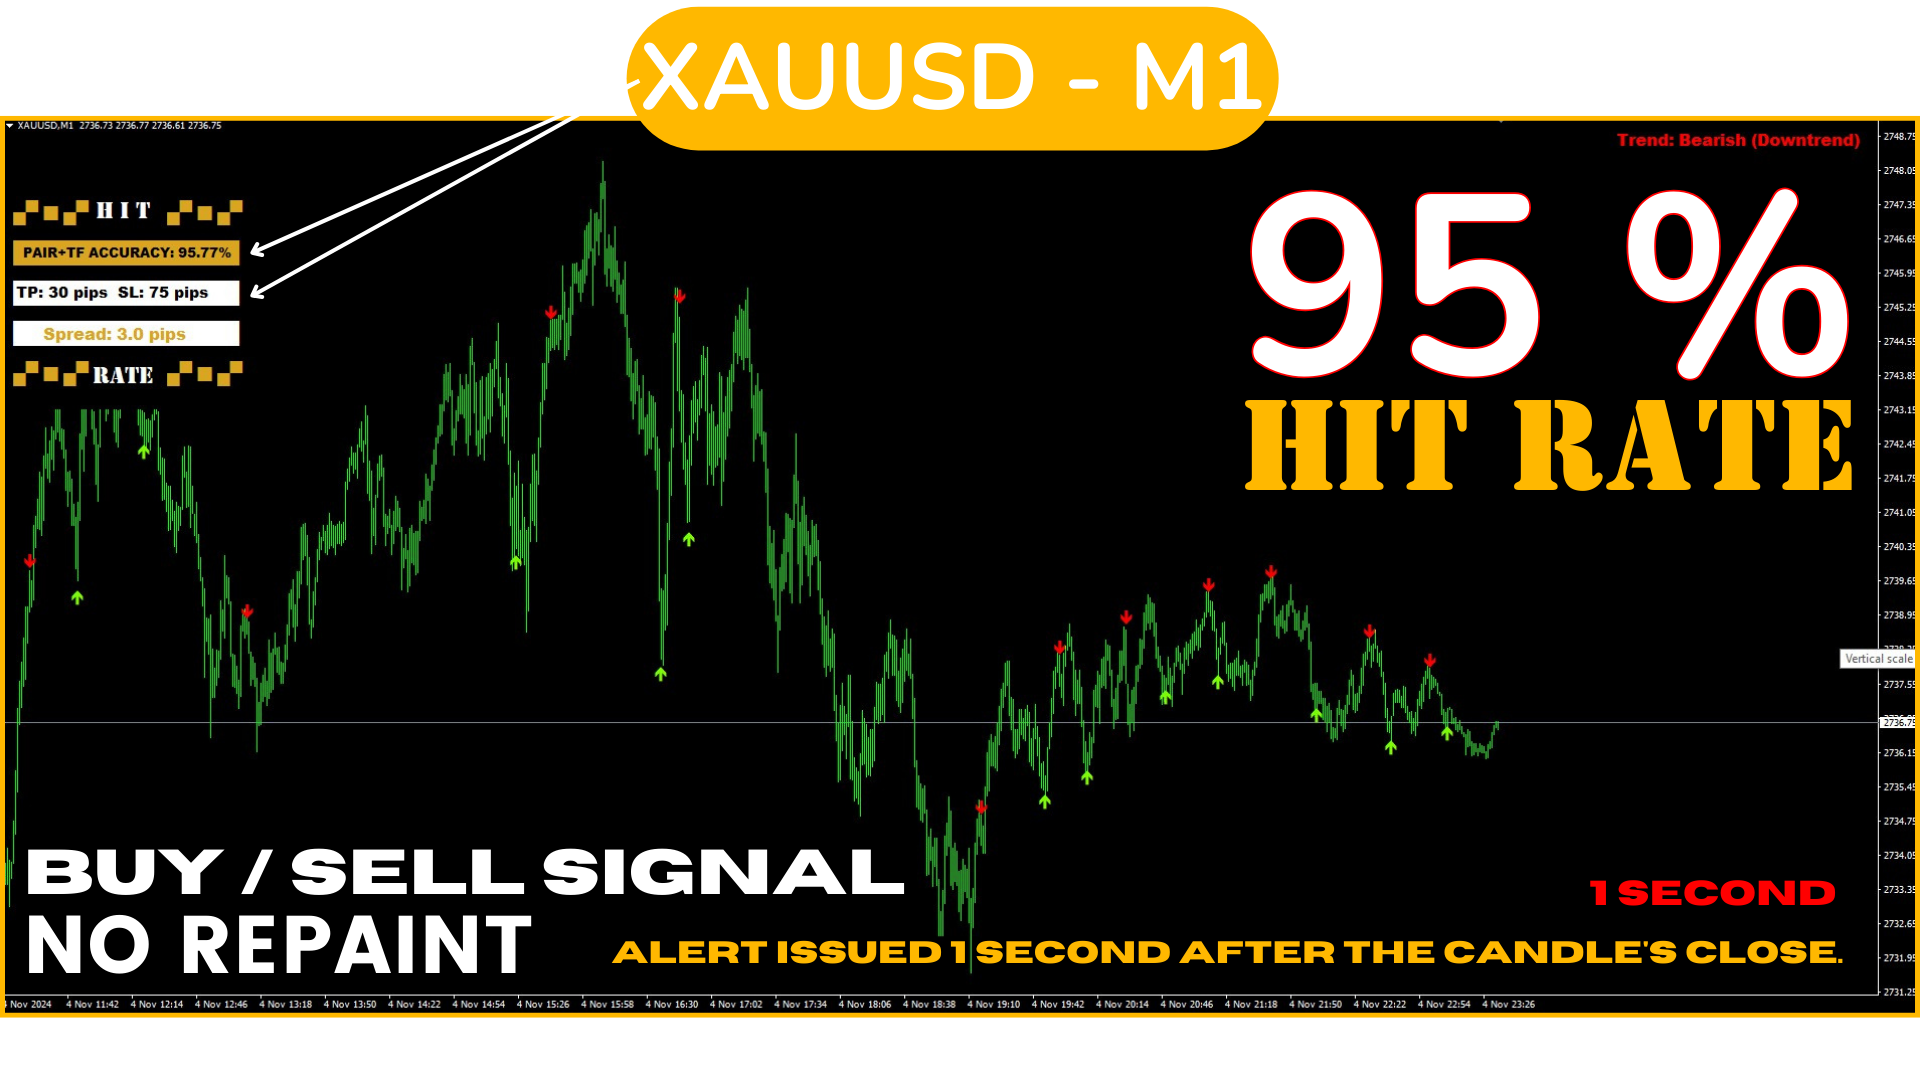
命中率顶部底部信号 提供了一种完全创新的方法。它非常适合那些希望预先评估信号在特定 TP-SL 下的表现以及在哪些货币对/时间框架(TF)中效果最佳的人。

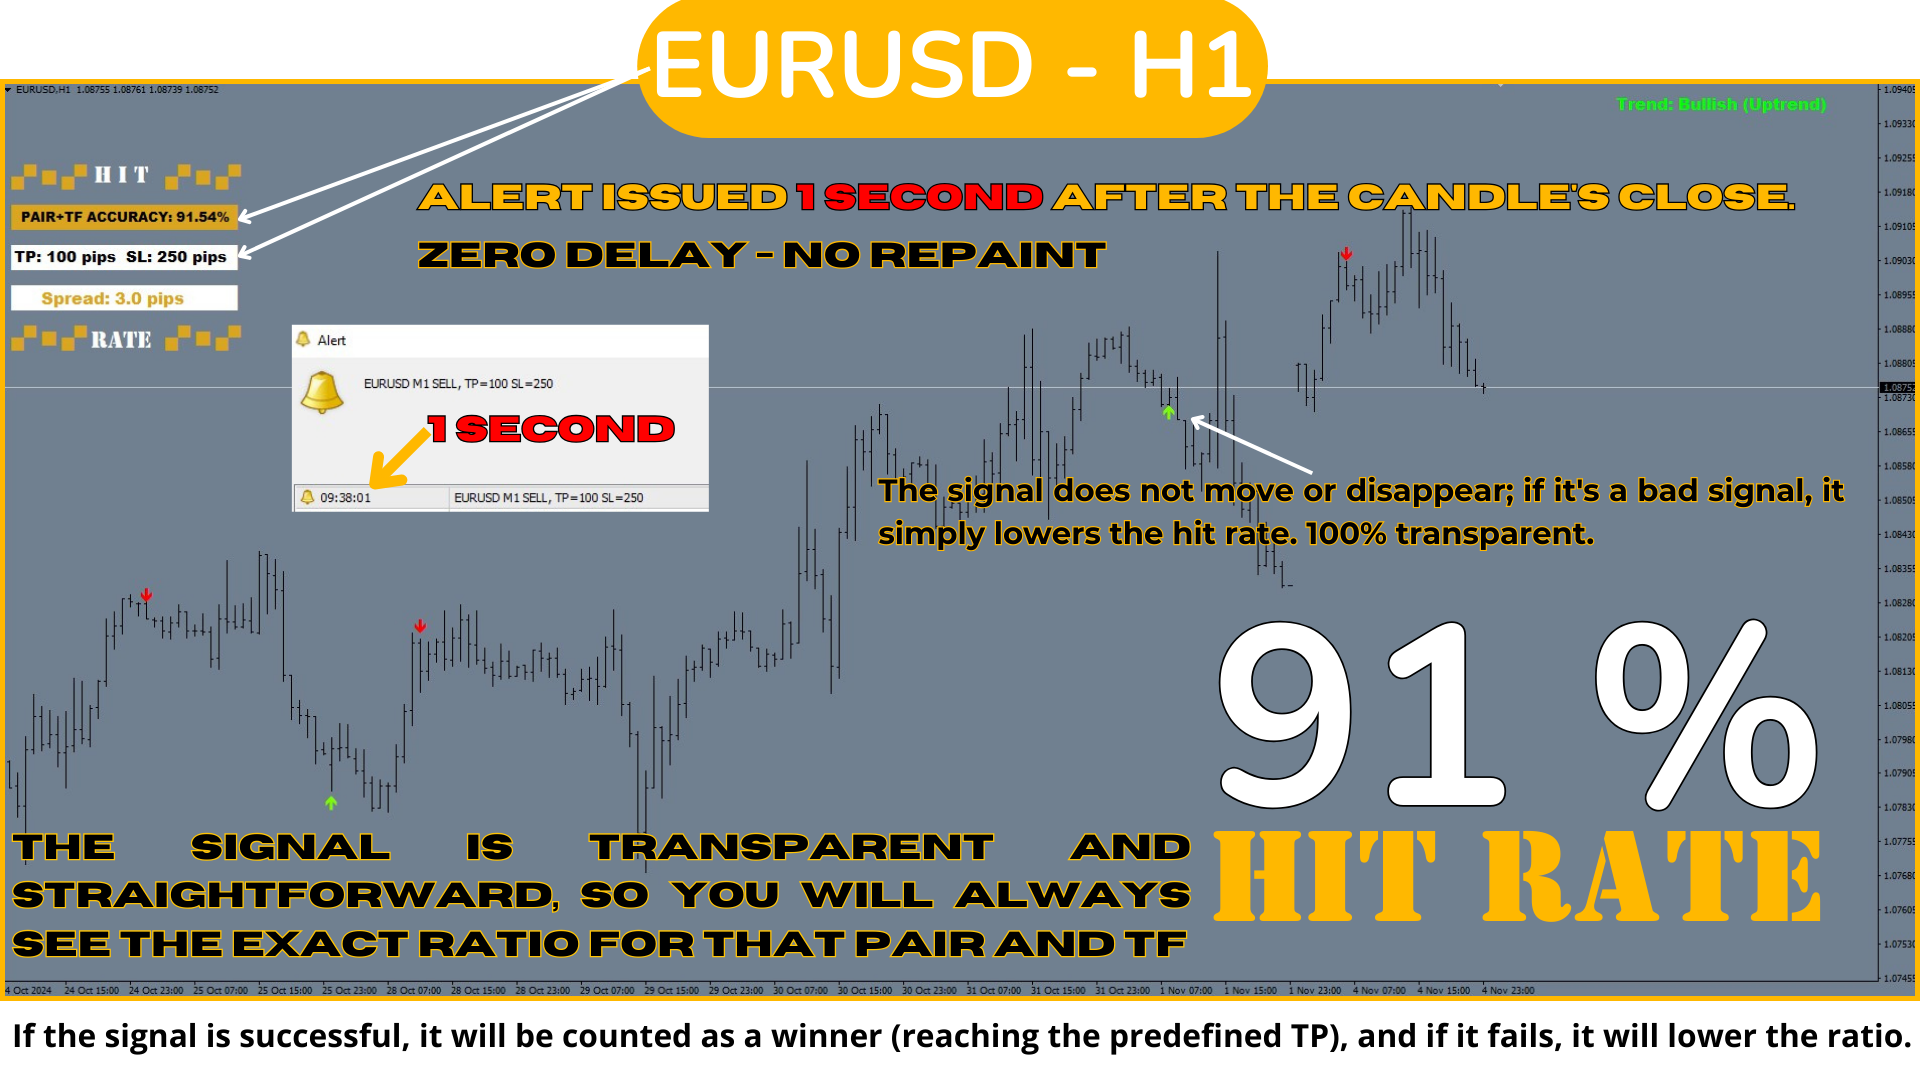
命中率顶部底部信号 策略是 任何交易员和任何交易类型 的重要工具,因为它不仅发出 精确且不重绘的信号,明确指示何时交易以及交易方向,而且还 详细记录每个货币对和时间框架的命中率,并预设止盈(TP)和止损(SL)。这使得能够提前知道信号的有效性比率,对于良好的风险管理和精确的交易至关重要。

该策略的独特之处在于它专注于在波动的反转点进行检测,而不是在整个行情中,这使得信号的发出频率比传统的顶部底部信号更高,专注于
市场每一个重要波动的关键时刻。


这种以百分比显示 信号历史效果与SL/TP比率结合的能力 使得这项策略成为安全交易的最佳选择,让交易员能够基于数据做出决策。依靠一个不仅清晰直接而且历史记录良好的信号,我们正在使用市场上最好的策略之一。


如何使用该系统进行交易?

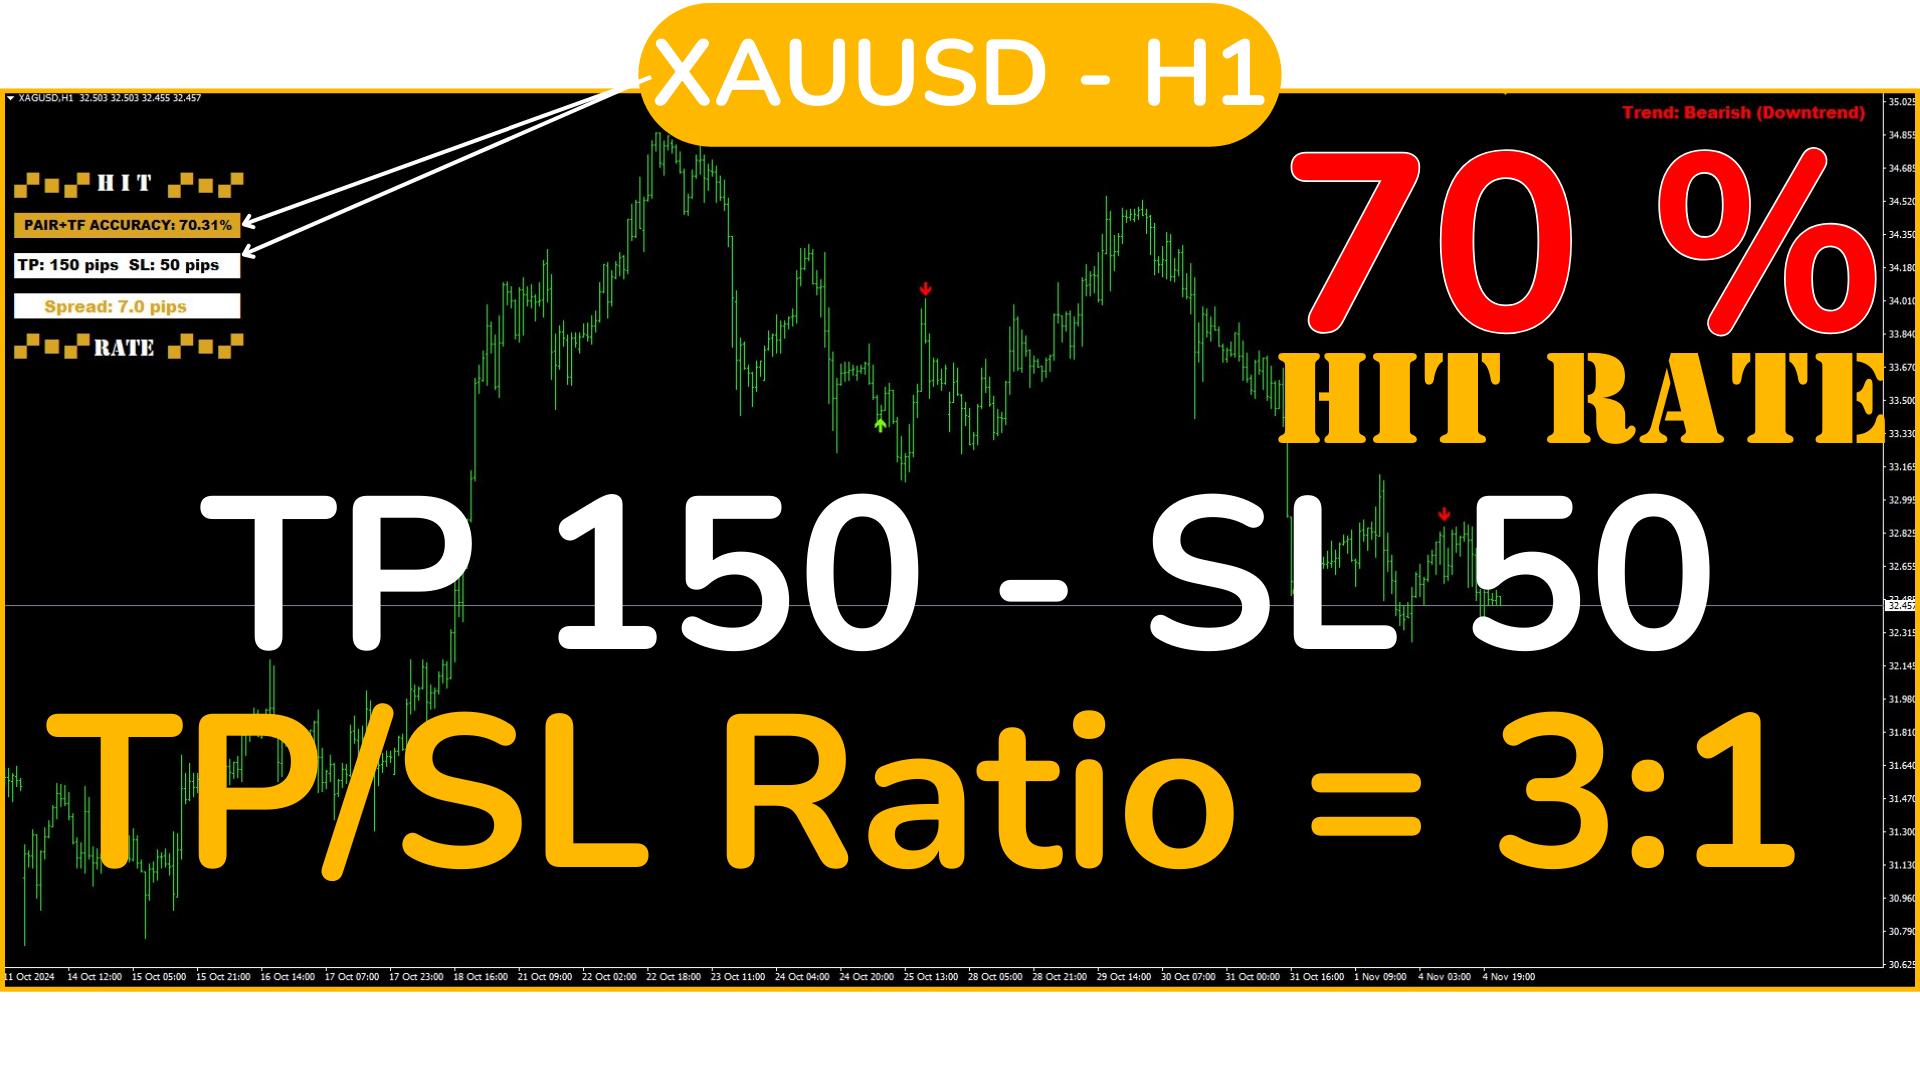
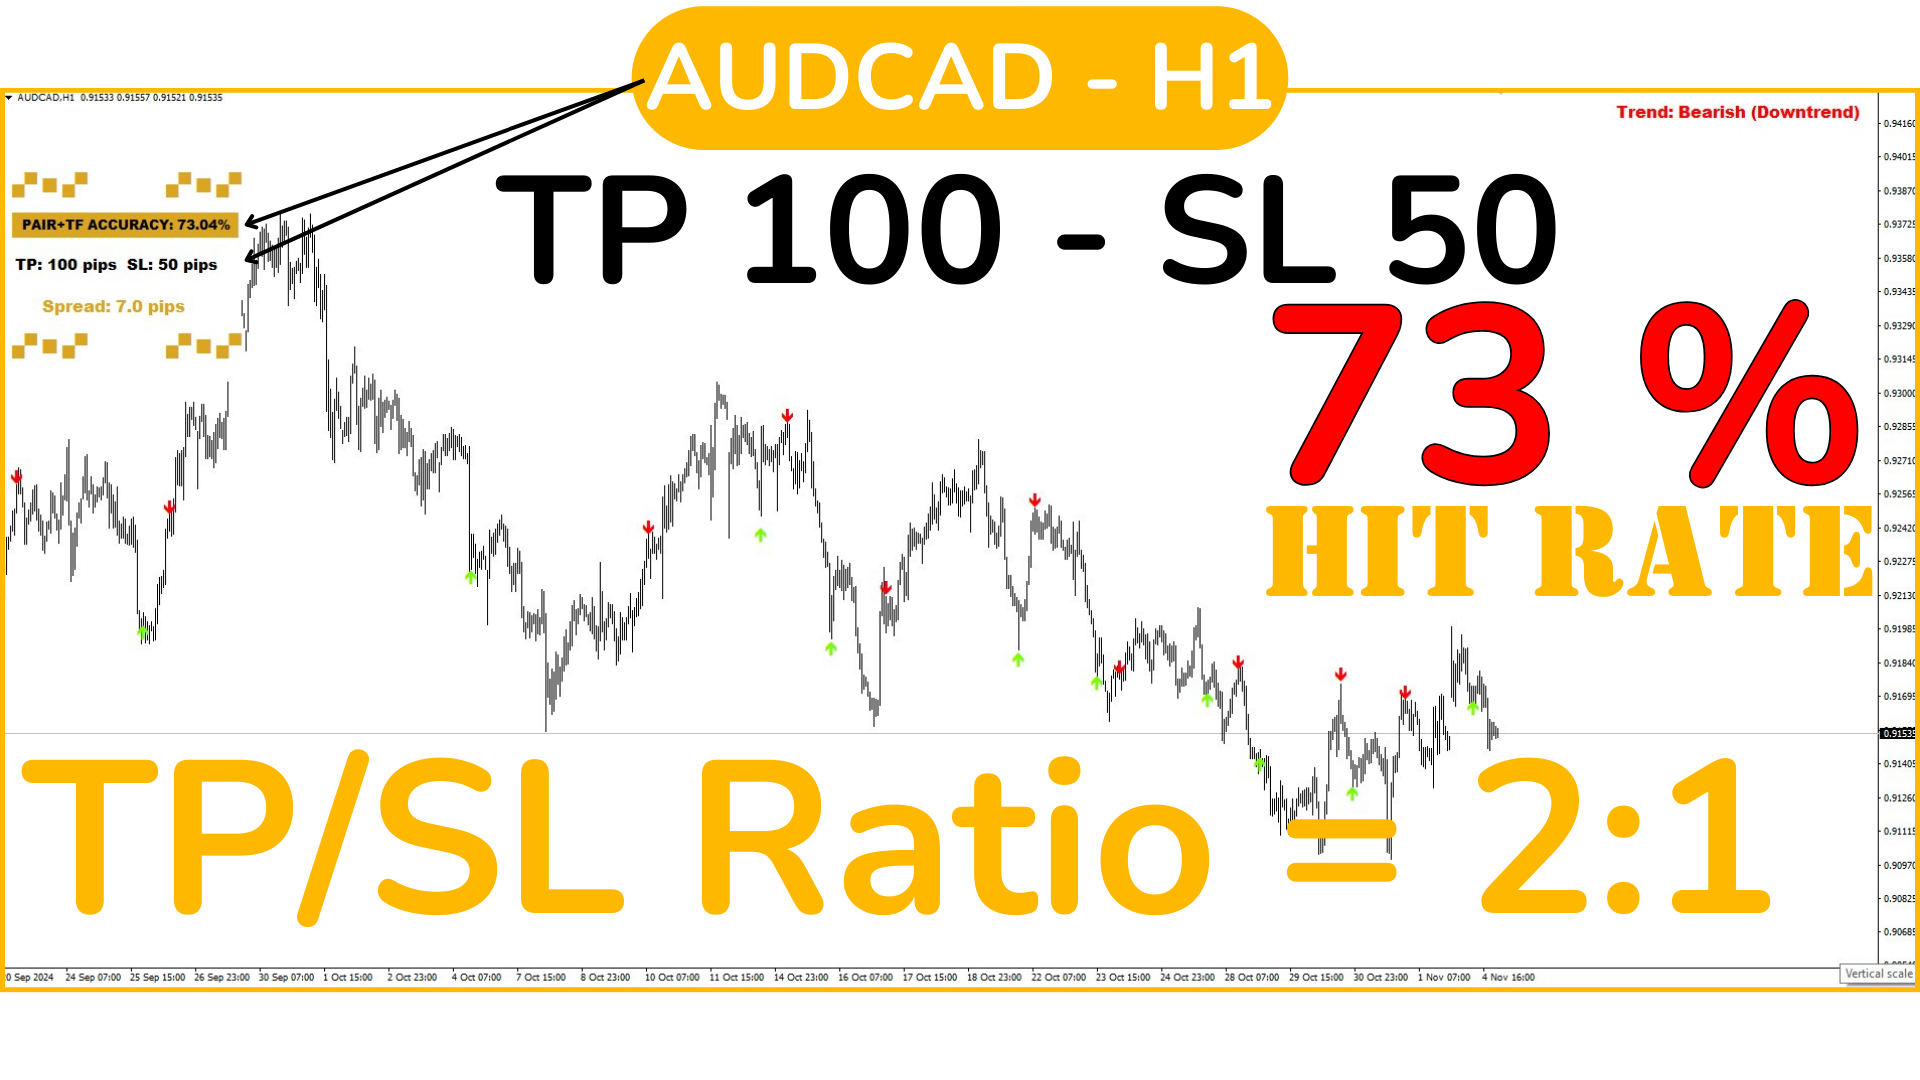
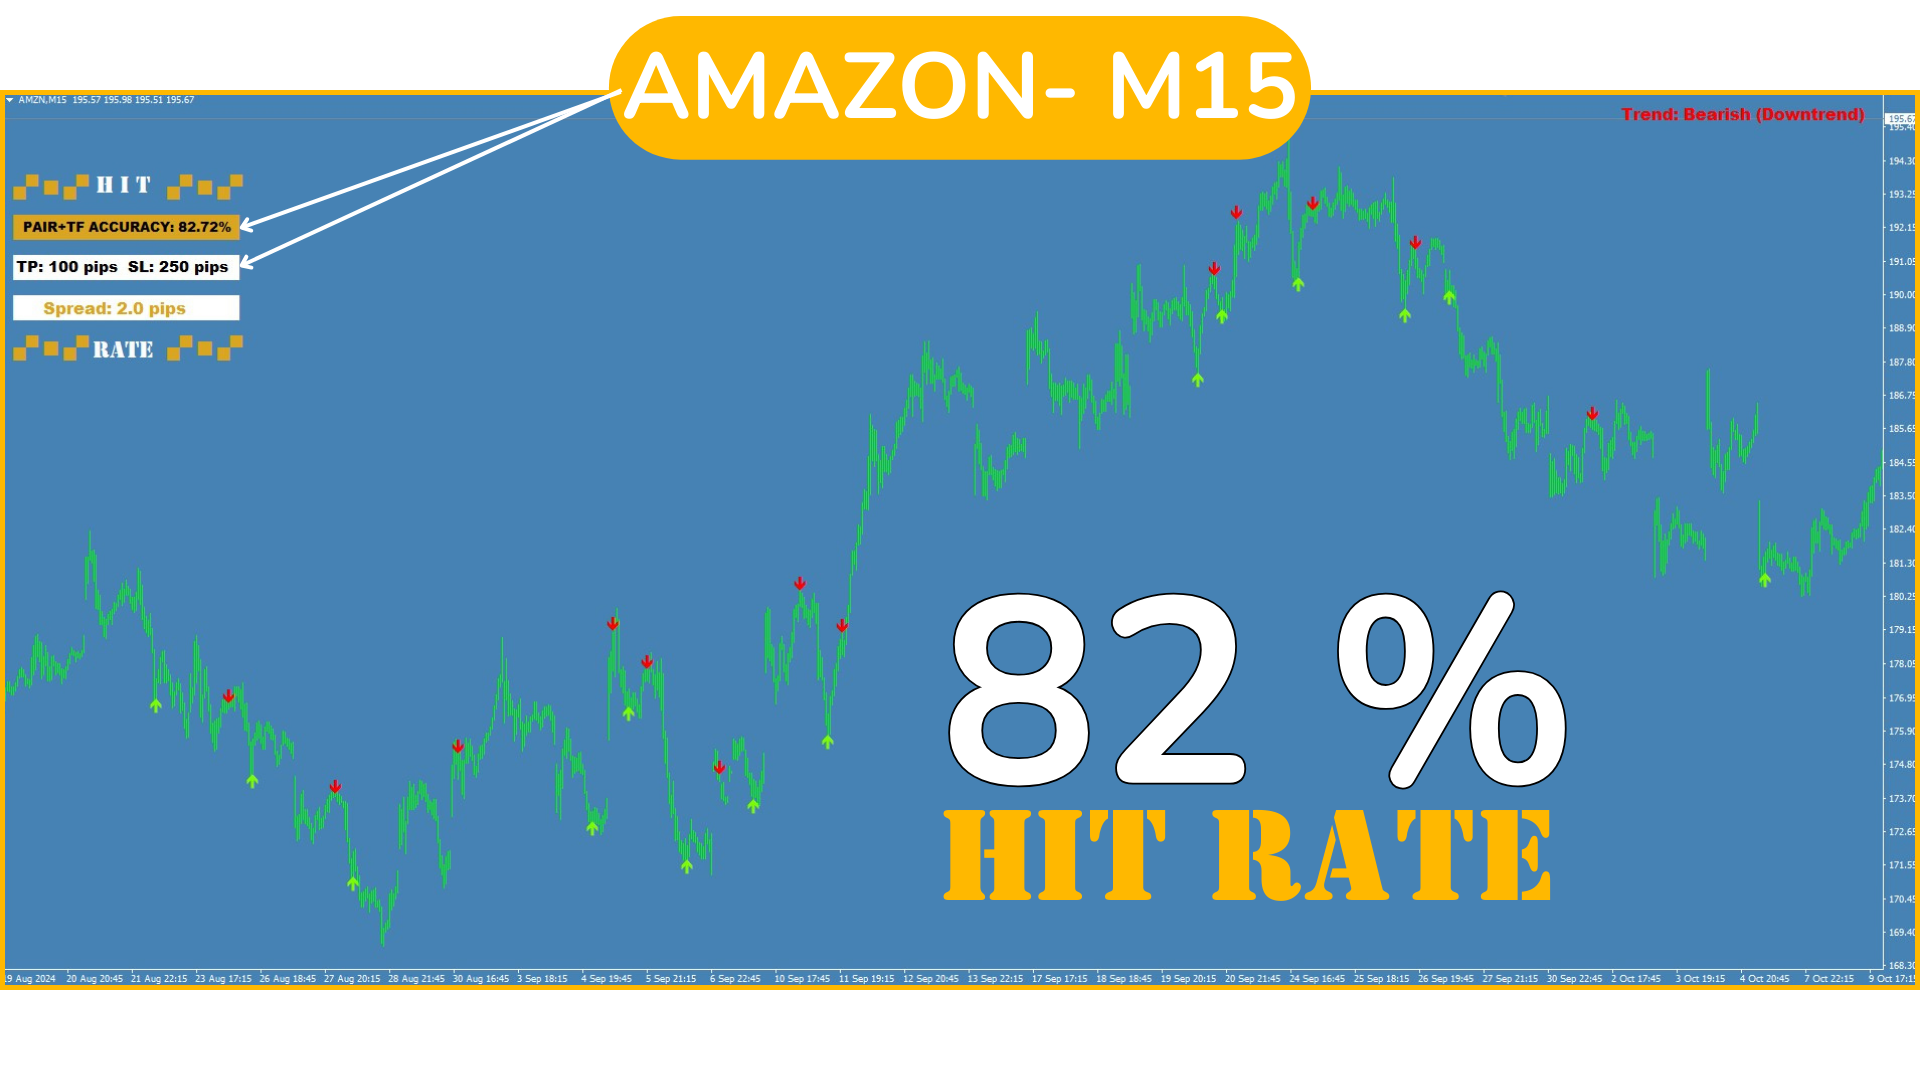
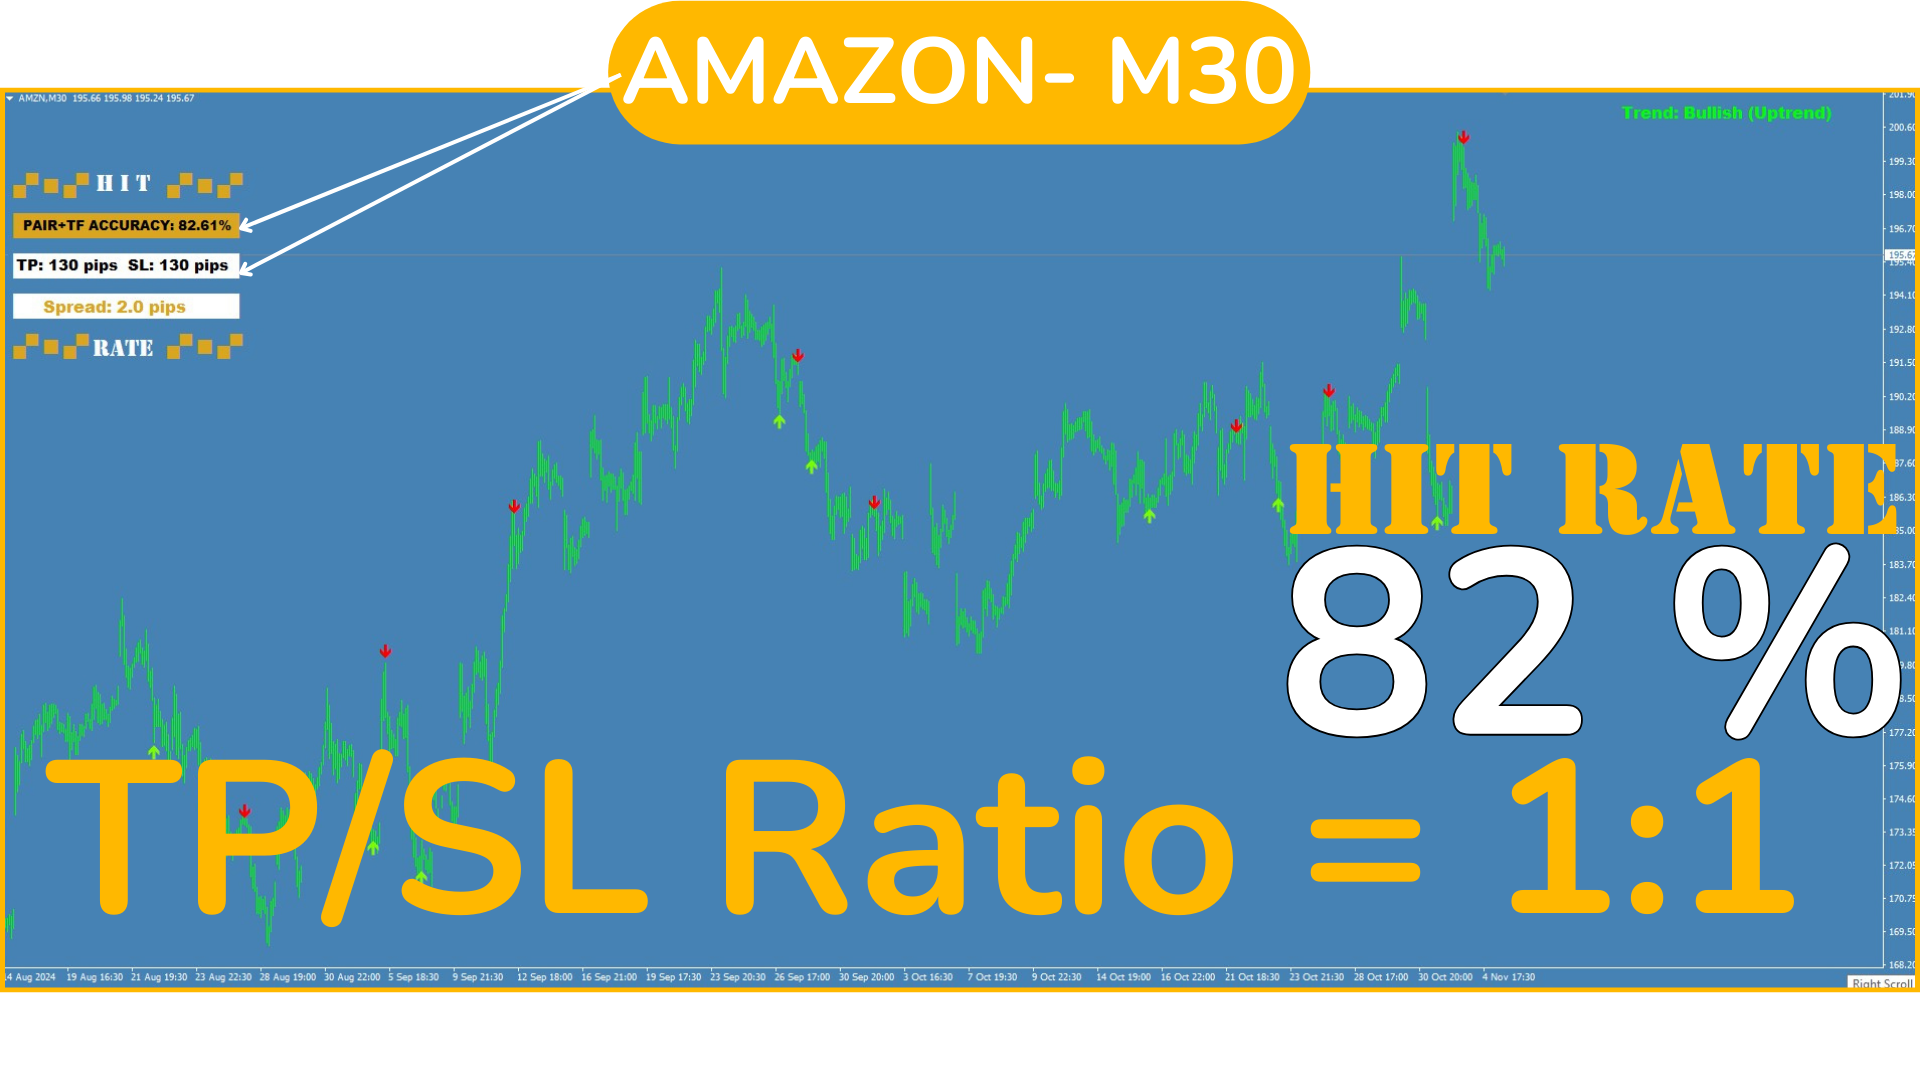
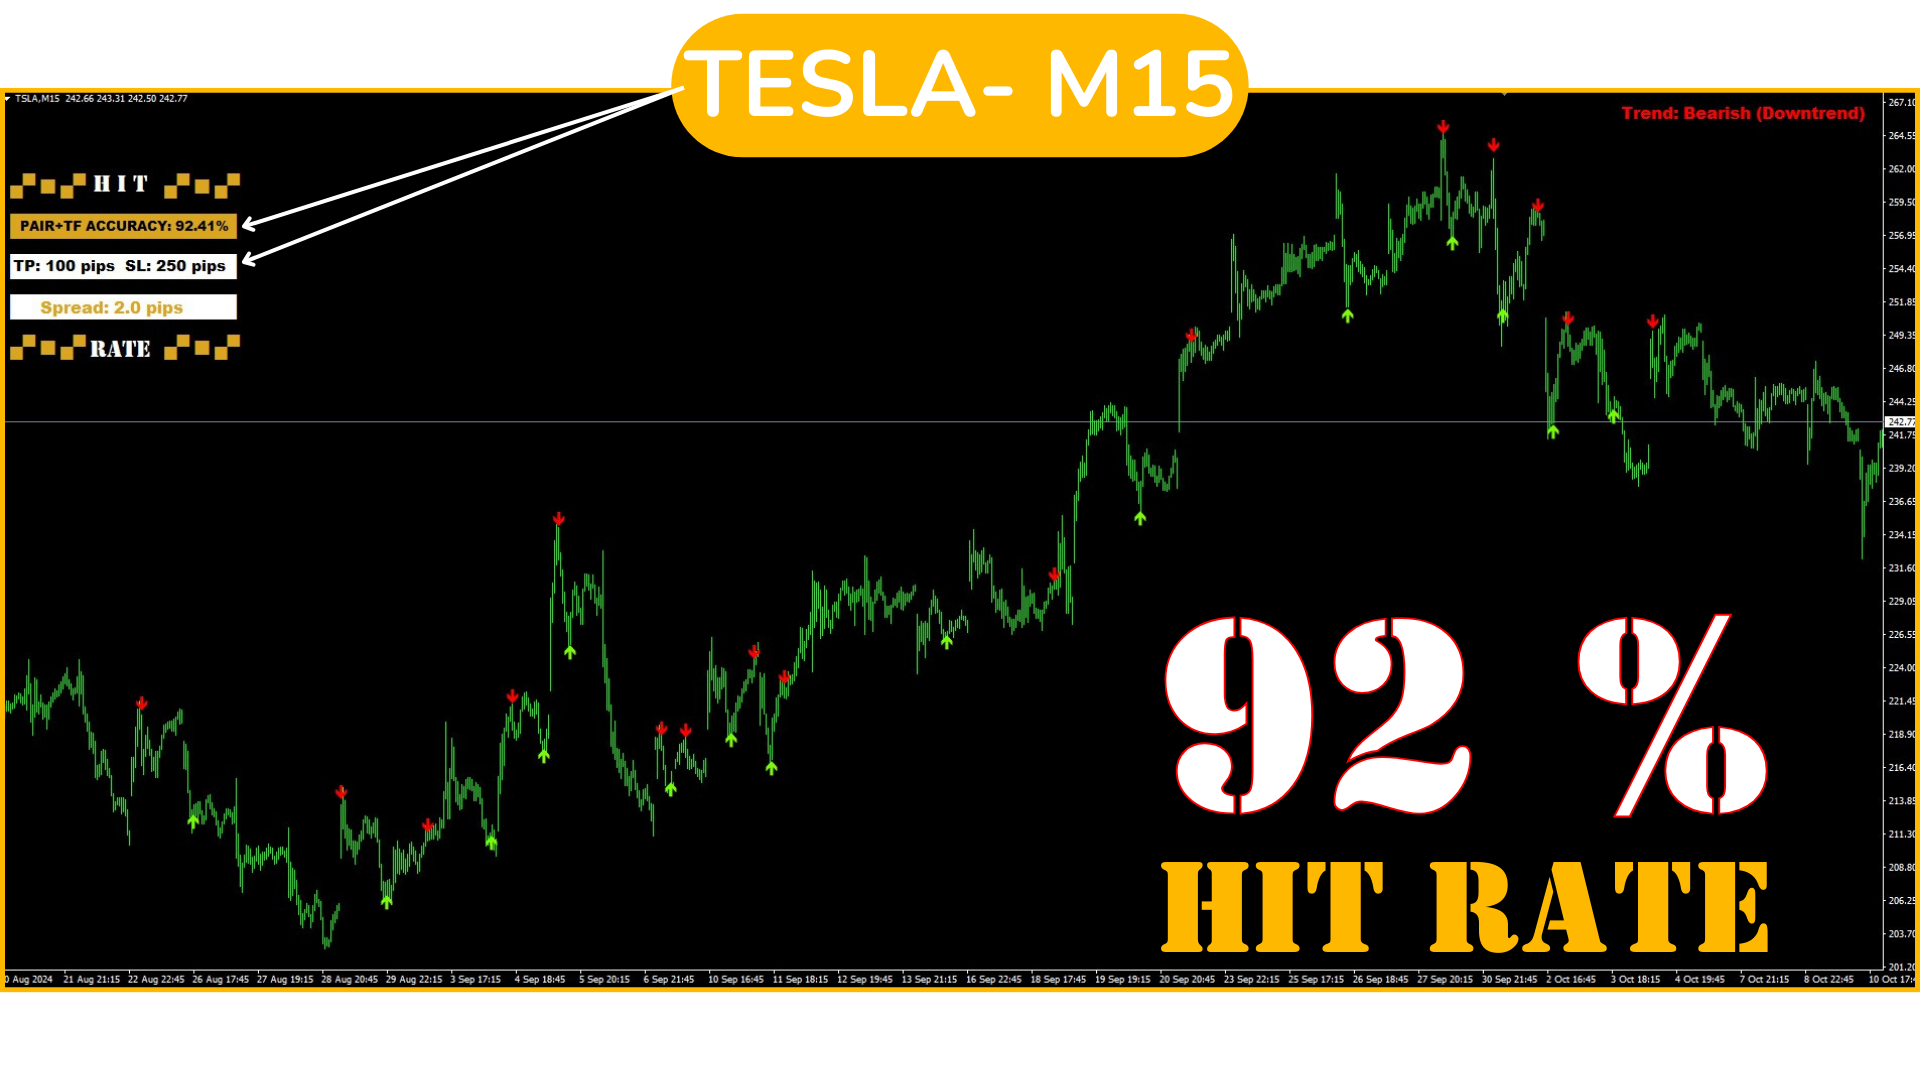
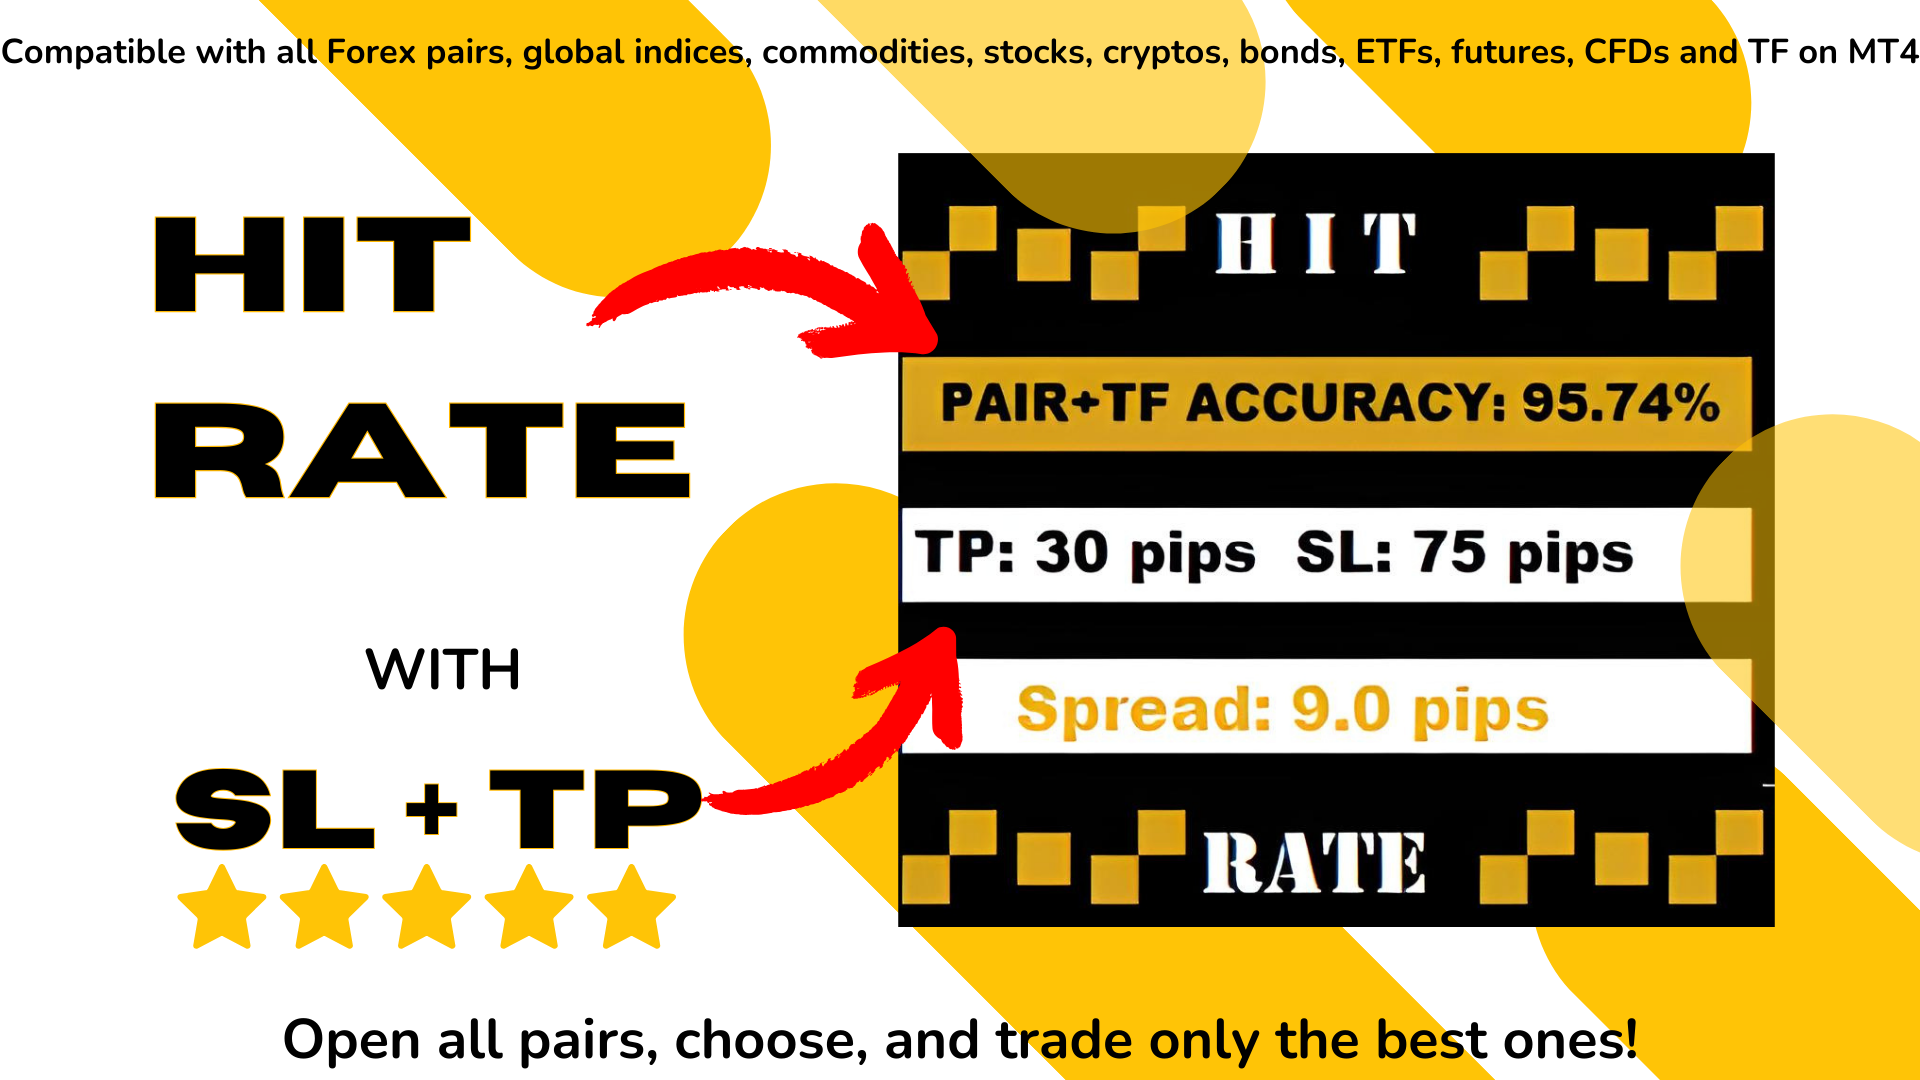
打开多个货币对并在每个货币对上加载指标。现在,分析每个货币对,以确定哪些货币对和时间框架(TF)信号效果最好,并集中精力在这些货币对上。(见图)

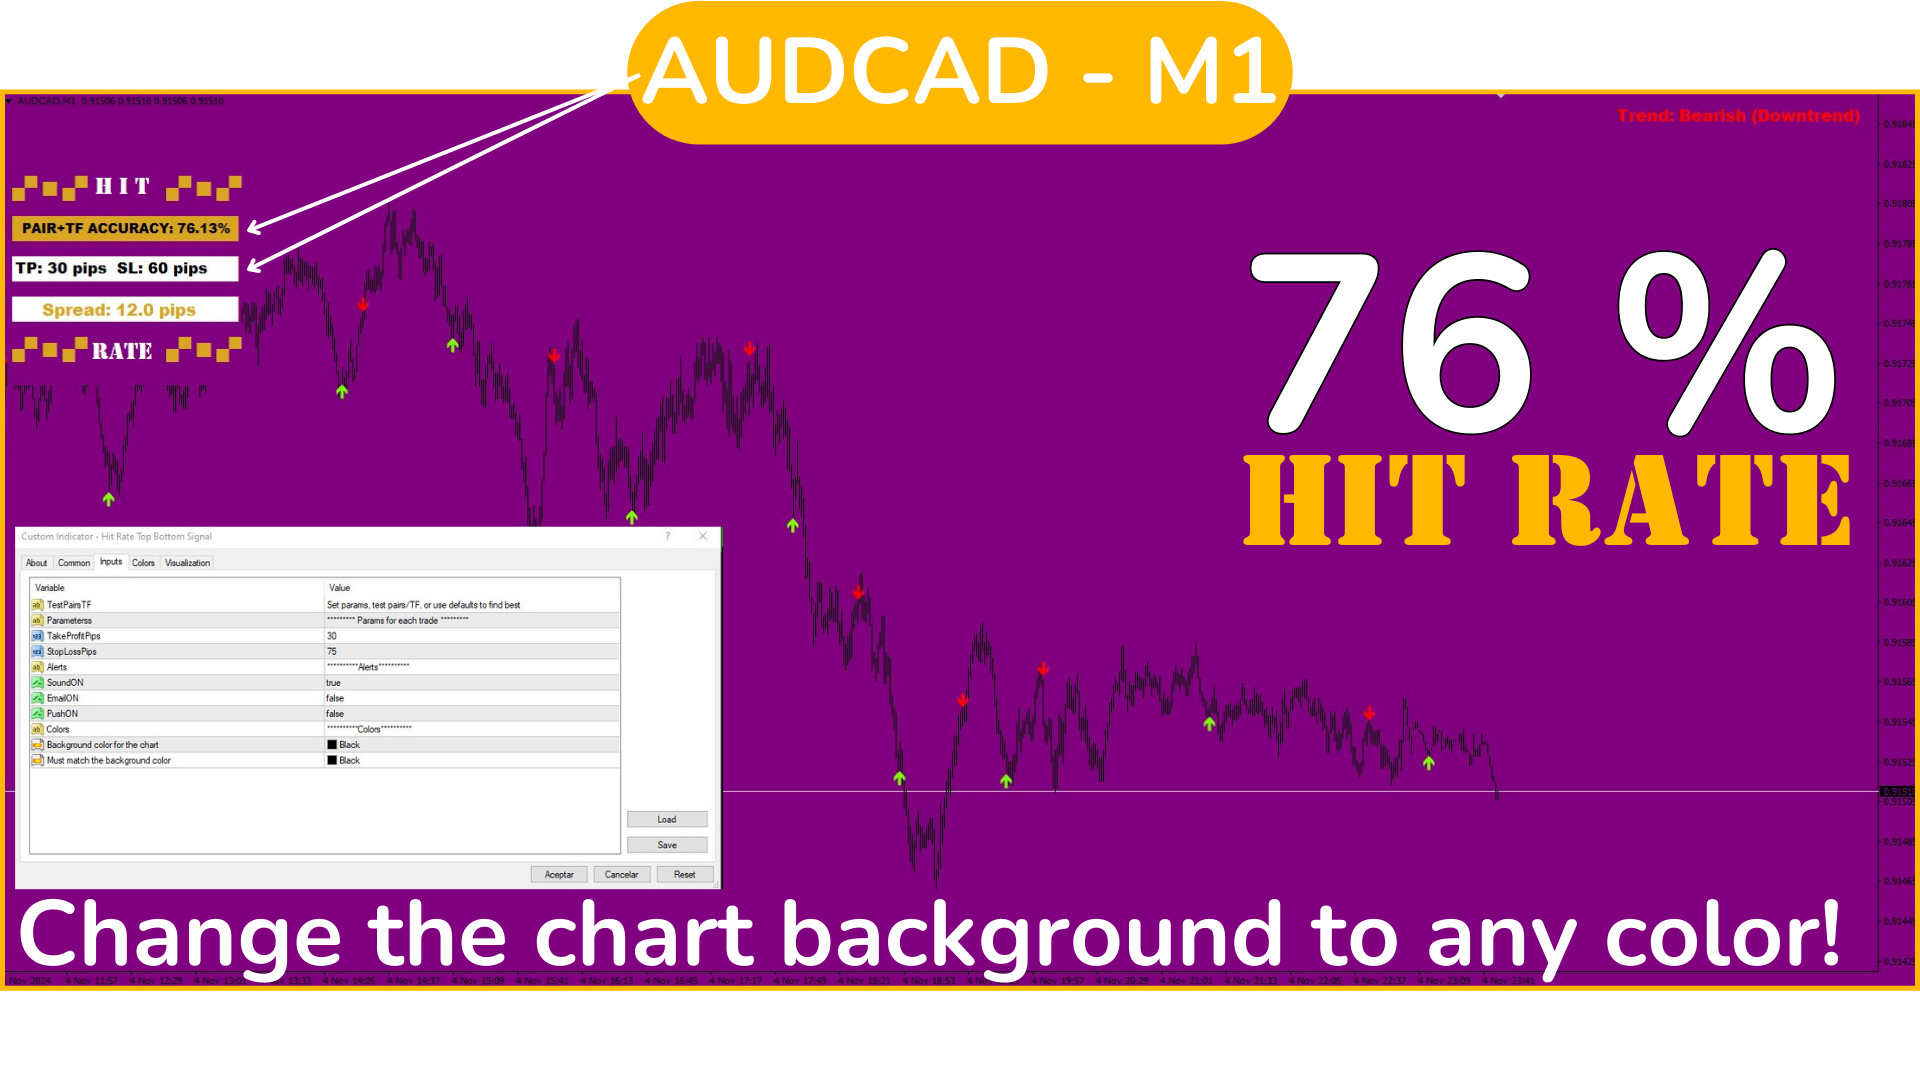
默认情况下,信号设有100点的TP和250点的SL,但您可以设置自己想要的值或保留默认值。

请注意,250点的SL在H1和M1上并不相同,但不用担心:手动更新SL和TP参数时,系统会重新计算该信号在新参数下的命中率,从而提前知道这些参数的预期结果。

这样,您可以调整每个货币对的具体参数以“优化”该货币对和时间框架的策略,从而了解该信号在该特定背景下的命中率。建议每天进行此过程,每次交易前都要进行,以识别当前最有效的货币对/时间框架。默认参数在M30或H1等时间框架上效果最好,具体取决于货币对。

步骤说明:

  1. 选择一个货币对并检查每个时间框架。 验证在哪一个的命中率最高,例如,如果使用默认TP和SL设置,命中率超过85%-90%。选择该时间框架。 若您不使用默认TP和SL,欲了解最佳比率,请阅读下方的“SL/TP与命中率比率”。

  2. 对所有可用的货币对重复此过程;货币对越多,您将获得更多交易机会。

  3. 现在,只需等待信号并在信号发出后立即进行交易,遵循预设的SL和TP。

  4. 如果您希望选择特定的TP和SL进行交易,首先需在“输入”标签中修改数据并设置每个货币对的值,始终以点数为单位。然后检查该货币对的每个时间框架,选择效果最好的时间框架并保持关注信号。

在手机上自由交易:

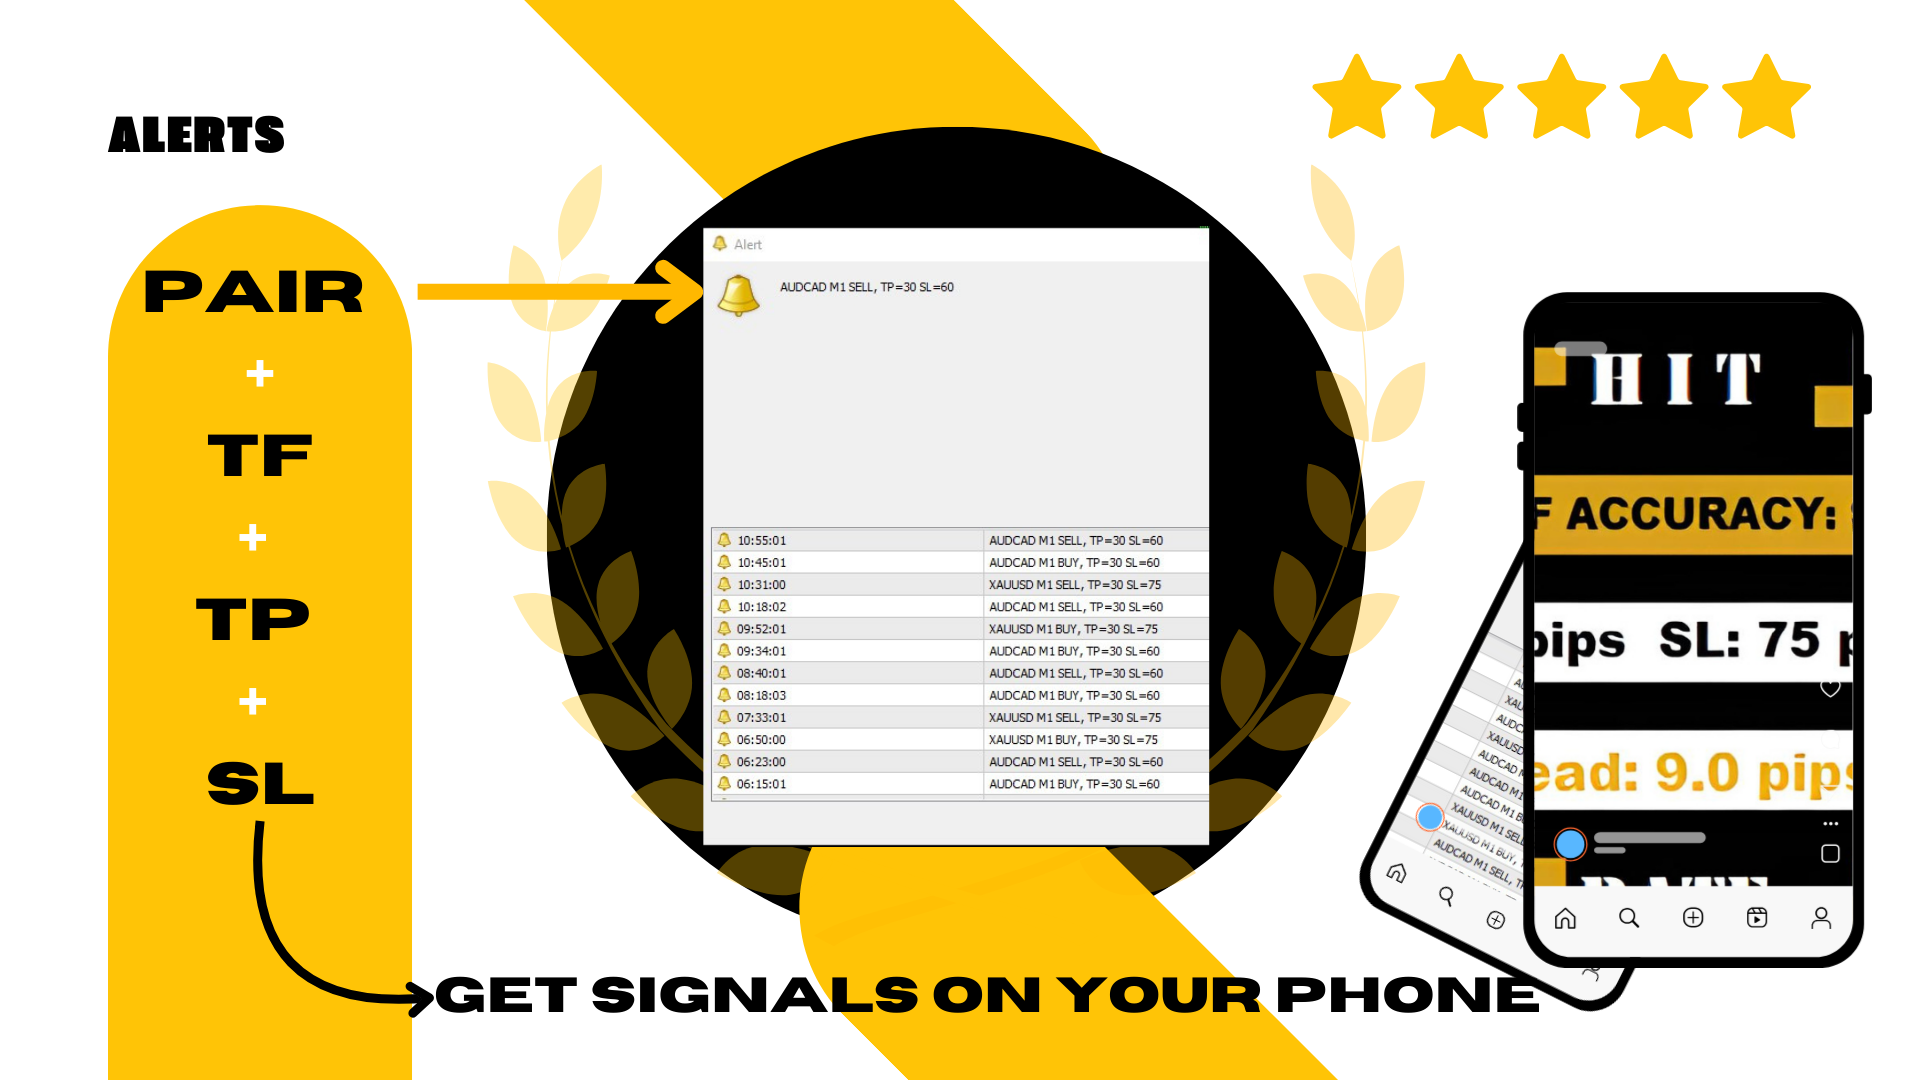
此“步骤说明”流程应在电脑上进行配置,然后您可以在手机上接收交易通知。 如何做到?确保您的手机已设置在MT4终端上接收推送消息,并允许您的终端从手机接收通知。

当信号发出时,您会收到通知:货币对 - 时间框架 - 信号类型(买/卖)-以及该货币对预先设置的TP和SL值。


这样,您无需一直在电脑前,因为您可以 从手机上进行交易,设置货币对的SL和TP,无需持续监控。

当然,对于那些希望在电脑上交易的用户,屏幕上会出现声音和视觉信号,每当货币对发出信号时,您将看到相同的数据(货币对 - 时间框架 - 信号类型以及TP和SL值)。


理解SL/TP与命中率的比率

交易策略的成功取决于两个关键因素一是止损(SL)和止盈(TP)之间的比率,二是信号的命中率。每个因素都在策略的盈利性中起着至关重要的作用,理解它们的相互作用是优化系统的关键。

1. SL/TP 比率:

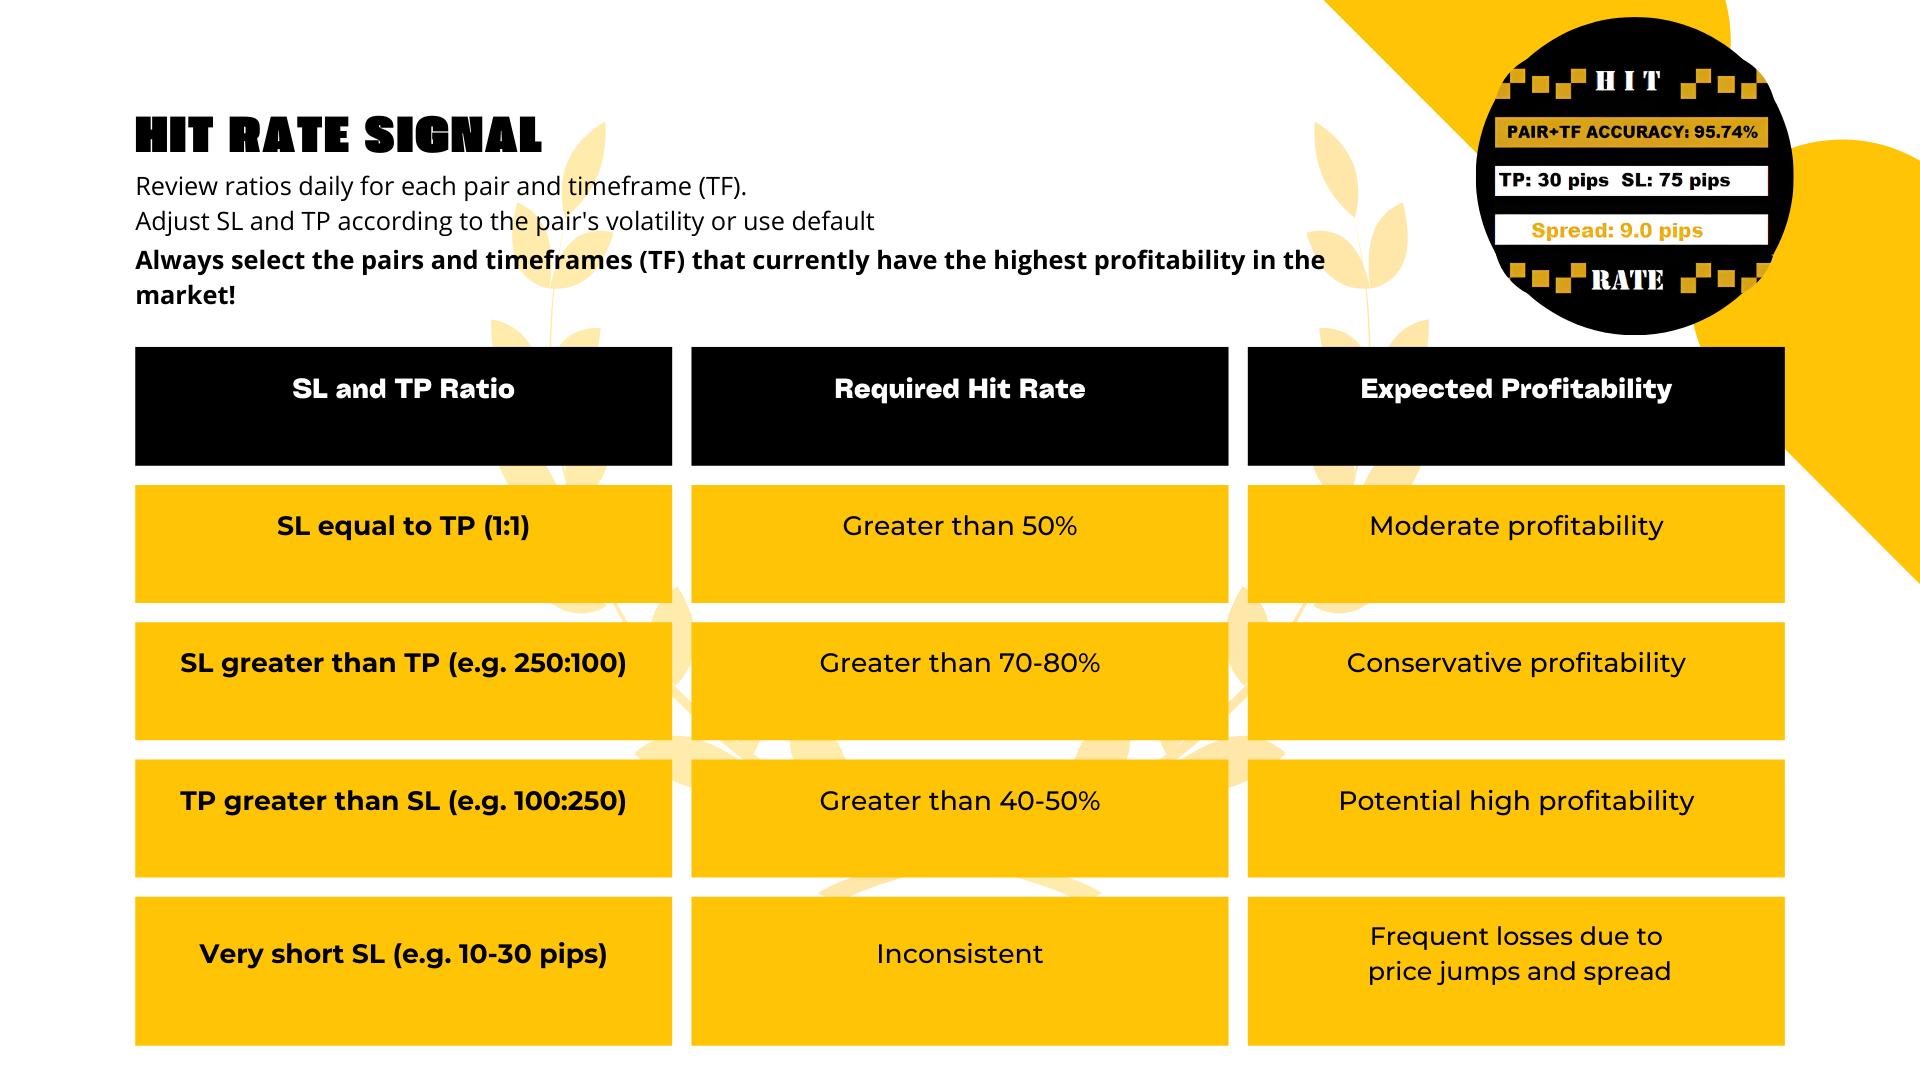
  • SL/TP 比率为 1:1: TP值与SL值相等(例如,SL:100点,TP:100点)。在这种情况下,策略需要超过50%的命中率才能盈利,因为收益和损失基本相同。
  • SL大于TP:例如,SL:250点,TP:100点),需要更高的命中率来弥补触及SL时的损失。在这种情况下,理想的命中率应在70%-80%以上。
  • TP大于SL: (例如,TP:250点,SL:100点),即使命中率较低,该策略也可获利,因为每次盈利的交易可以弥补多次亏损。在此情况下,40%-50%的命中率即可产生盈利。

在所有情况下!!始终注意,如果SL设得太“紧”,例如10-30点,可能会频繁触发(请注意点差),导致本应盈利的交易变成亏损。因此,请小心,为价格提供足够的活动空间(宽松的SL)。

2. 命中率:

  • 命中率表示系统的准确率。高命中率的系统(例如90%)更可靠,并允许使用更宽的SL/TP比率(SL大于TP)。
  • 但是,低命中率不一定意味着亏损,只要TP大于SL。即使命中率较低,利润也足以覆盖亏损。

    因此,提前了解信号的命中率非常重要,以便在良好的资金管理(SL+TP)下实现最佳结果。


3. 根据货币对和时间框架进行优化:

每个货币对和时间框架对相同的SL/TP比率可能有不同的反应,因此重要的是根据货币对和时间框架的表现来调整SL和TP。例如,在波动较大的货币对或更高的时间框架上,使用更大的TP可能更合适。

尝试在每个货币对和时间框架上使用不同的SL和TP设置,观察每个的命中率。这将帮助您找到最佳平衡,以最大化收益并最小化亏损。


盈利性评估示例:

假设一个策略的SL为250点,TP为100点。为了让此配置实现盈利, 命中率应达到 理想上高于70%-80%,以覆盖触及SL所造成的损失。

然而,如果反转比率至SL 100点和TP 250点,则40%-50%的命中率已足够,因为每笔盈利交易可弥补多次亏损。


总结:

  • SL 大于 TP: 需要较高的命中率(理想上在70%以上)。
  • TP 大于 SL: 可以在较低的命中率下工作,约40%-50%。
  • 每日优化: 每日检查每个货币对和时间框架中的比率是否保持,以达到最佳表现。如果发现某个货币对的表现下降,请重复“步骤说明”并重新扫描最佳配置。

重要的是要理解,因为该策略可以在所有外汇对、黄金、白银、股票、指数甚至加密货币(如果您的经纪商允许)以及任何时间框架中使用,所以没有必要坚持使用:1-点差过高的货币对 2-不符合所需比率的货币对,请从最佳货币对中选择!


最后,请记住,没有一种通用的理想配置。通过更改设置,您会发现不同的配置可能根据货币对和时间框架提供良好的结果。这就是为何拥有一个清晰的信号来通知我们何时交易及其对应的SL和TP(已提前测试),并提供
 命中率分析,使命中率顶部底部信号成为一项完整的策略。即使只需阅读通知中的数据并据此进行交易,您也能确信所做的决策是经过分析和测试的。

轻松交易,简单明了,无需猜测和疑惑!


推荐产品
Arbitrage Indicators 是一个专业且易于使用的外汇交易指标,它使用最新AI的套利模型的最佳交易原则。 该指标提供准确的买入和卖出信号。只适用于货币对。 它共有六个不同的指标选项, MACD、KDJ、RSI、CCI、RVI、DEMARK。 可供用户自由切换。 它直观展示了货币对的走向及反转信号,当两线交叉颜色时货币即有很大概率发生反转。 推荐时间框架: 任何时间框架都有效,但我们喜欢使用   M5、 M15、M30 和 H1   也是不错的选择! 推荐交易品种: 我们喜欢使用的最佳交易品种是   M15 时间框架上的 EURUSD 、GBPUSD 、USDJPY、 USDCAD、 AUDUSD 、USDCHF 有问题可联系:QQ:2813871972 微信: FX-AIEA 邮箱:2813871972@qq.com

Divergence Matrix Pro for MetaTrader 4 Divergence Matrix Pro is a confirmed multi-oscillator divergence indicator for MetaTrader 4. It detects regular and hidden divergence between price and selected oscillators, then presents the confirmed structure through divergence lines, pivot labels, action markers, an optional current-timeframe Matrix Panel and optional alerts. The indicator is an analysis and confirmation tool. It does not open or close trades, and the signal score is not a win rate or a
Alpha Trend sign Alpha Trend sign 是我么长期以来非常受欢迎的交易工具,它可以验证我们的交易系统,并且明确的提示交易信号,并且信号不会漂移。 主要功能: •  根据市场显示活跃区域,根据指标可以很直观的判断当前行情是属于趋势行情,还是震荡行情。    并根据指标的指示箭头切入市场,绿色箭头提示买入,红色箭头提示卖出。 •  建议使用5分钟以上的时间周期进行交易,避免因为小周期波动出现频繁的交易信号。 •  您也可以开启信号提示,以免错过最佳的交易时机。 •  本指标不但可以很好的预测趋势行情,也可以在宽幅震荡行情中获利。 •  本指标本着大道至简的原则,适合不同阶段的交易者使用。 注意事项: •  Alpha Trend sign 有明确的进出场信号,不建议逆势操作,以免造成损失。 •  Alpha Trend sign 是特别成熟的指标,我们团队人手一个,使用它可以实现稳定盈利。     
REX complete 3in1
Christophe Godart
This is the complete REX package. It consists of the lite, pro and ULTRA version.  Perfect for beginners and intermediates. REX complete is 100% non repaint. The strategy is based on a mix of different strategies, statistics, including pivot points, oscillators and patterns.  As the trading idea consists of a variety of some classic indicators like Momentum, Williams Percent Range, CCI, Force Index, WPR, DeMarker, CCI, RSI and Stochastic, it is clear that the fundamental indicators have being u
Chart Patterns Detect 15 patterns (Ascending Triangle, Descending Triangle, Rising Wedge, Falling Wedge, Bullish Flag, Bearish Flag, Bullish Rectangle, Bearish Rectangle Symmetrical triangle, Head and Shoulders, Inverted Head and Shoulders, Triple top, Triple Bottom, Double Top, Double Bottom) Use historical data to calculate the probability of each pattern to succeed (possibility to filter notification according to the chance of success) gives graphic indication about the invalidation level and
Supertrend Professional 是一款基于 Supertrend 指标的 MetaTrader 4 智能交易系统。专为德国指数(GER30/GER40/DAX)的趋势跟踪交易而设计。 FTMO 合规 EA 按照自营交易公司(FTMO、The Funded Trader 等)的规则实现回撤计算: - 每日回撤使用 MAX(余额, 净值) 作为计算基准,完全符合 FTMO 要求 - 参考余额每天午夜自动更新 - 达到限制时自动平仓所有持仓 - 非常适合使用 funded 账户交易或遵守专业风险管理规则的交易者 功能特点 EA 包含以下功能: - 内置 Supertrend 指标(无外部依赖) - 可配置的回撤限制(每日和总计),采用 FTMO 合规计算 - 自动保本功能 - 渐进式追踪止损 - 可选的马丁格尔系统,可配置倍数和最大步数 - 交易时段过滤器 - 终端重启后状态持久化 风险管理 EA 提供多种风险控制选项: - 每日最大亏损限制(FTMO 合规计算) - 从开始至今的总最大亏损限制 - 可调整的手数大小 - 用户自定义级别的保本激活 - 保本
Szia! Egy indikátorral. Több idő gyertyájának kirajzoltatása egy charton. Különböző színek rendelhetők a long és short gyertyákhoz. Vonal vastagsága állítható. A gyertya kitöltése engedélyezhető. Hello! With an indicator. Drawing multiple time candles on a chart. Different colors can be ordered for long and short candles. Line thickness can be adjusted. Filling the candle can be allowed. Videó: https://www.youtube.com/watch?v=-9bequnAw-g&amp ;ab_channel=GyulaKlein
Nomen Magic Candle
Noomen Ben Khadimallah Khadimallah
Nomen Magic Candle – Put an End to Chart Chaos! No Repaint MT4 Indicator The wait is finally over. It is time for a revolution on your screen. Welcome to the "Magic Chart." Use the cleanly plotted lines as a high-precision trading strategy, backed by advanced, algorithmic market analysis that precisely decodes hidden liquidity zones—giving you the decisive, invisible edge over the crowd. Do you also feel overwhelmed? By endless analysis, overloaded charts, and indicators that constantly contr
Crypto_Forex MT4 指标“强力指数和两条移动平均线”。无需重绘。 .............................................................................. - 此指标非常适合顺势交易,顺应趋势方向。 - “强力指数和两条移动平均线”指标可让您查看强力指数的快速和慢速移动平均线。 - 强力指数是将价格和成交量数据合并为单一数值的顶级指标之一。 - 强力指数本身是一个强大的震荡指标,用于衡量推动价格波动的力量。 - 指标让您有机会尽早发现趋势变化。 - 此指标可通过参数轻松设置,适用于任何时间范围。 - 您可以在图片上查看买入和卖出入场条件。 .................................................... 点击这里查看高质量的交易机器人和指标! 此为原创产品,仅在本 MQL5 网站提供。
Preface: First of all, let me introduce myself. I am a programmer and have been working for over 20 years. 2023 has passed, and our studio has achieved a record of 500 times with 7 manual transmissions. Below, we will show you how to do it through a series of operations. The first step is to model. Modeling is to find a fixed trading pattern. I think everyone has heard of a 2/8 probability, and through this probability, we can further refine it, which means that 1 to 4 is the optimal state. We h
FreqoMeterForecast
Stanislav Korotky
The main idea of this indicator is rates analysis and prediction by Fourier transform. Indicator decomposes exchange rates into main harmonics and calculates their product in future. You may use the indicator as a standalone product, but for better prediction accuracy there is another related indicator - FreqoMaster - which uses FreqoMeterForecast as a backend engine and combines several instances of FreqoMeterForecast for different frequency bands. Parameters: iPeriod - number of bars in the ma
Visual Vortex Indicator MT4
AL MOOSAWI ABDULLAH JAFFER BAQER
Unleash the Power of Market Dynamics with the Vortex Indicator! The Visual Vortex Indicator is your advanced tool for decoding market trends, reversals, and momentum shifts. Priced at $65, this indicator provides a comprehensive view of market behavior, but it’s designed for you to fine-tune and optimize it according to your unique trading strategy. What Makes It Unique? The Vortex Indicator is based on a strategy that identifies directional movements and trend strength by analyzing key price d
This indicator is another variant of the famous powerful indicator Fibonacci-SS https://www.mql5.com/en/market/product/10136 but has different behaviour in placing Pending Order and TP Line. Automatically places Fibonacci retracement lines from the last highest and lowest visible bars on the chart with: An auto Pending Order (Buy/Sell). Taking Profit 1, Taking Profit 2 is pivot point and Taking Profit 3 for extended reward opportunity. The best risk and reward ratio. Simple and powerful indicat
Stratos Pali
Michela Russo
4.43 (7)
Stratos Pali Indicator   is a revolutionary tool designed to enhance your trading strategy by accurately identifying market trends. This sophisticated indicator uses a unique algorithm to generate a complete histogram, which records when the trend is Long or Short. When a trend reversal occurs, an arrow appears, indicating the new direction of the trend. Important Information Revealed Leave a review and contact me via mql5 message to receive My Top 5 set files for Stratos Pali at no cost! Dow
RTSPattern
Tomas Belak
The indicator provides a superior alternative to price action analysis. It enables the identification of normalized patterns, which are then transformed into a graphical representation to forecast future steps within a time series. In the top-left corner, you'll find information regarding the expected prediction accuracy, determined through a complex MSQE calculation. You have the flexibility to adjust the time window, making it easy to validate the indicator's performance. Additionally, you can
True SnD
Indra Lukmana
5 (1)
This Supply & Demand indicator uses a unique price action detection to calculate and measures the supply & demand area. The indicator will ensure the area are fresh and have a significant low risk zone. Our Supply Demand indicator delivers functionality previously unavailable on any trading platform. Trading idea You may set pending orders along the supply & demand area. You may enter a trade directly upon price hit the specific area (after a rejection confirmed). Input parameters Signal - Set
Simple to read and powerful, no fancy lines and drawings to clutter your chart or distract you. The trend probability oscillator estimates how likely a trend will continue in a certain period. The cummulator period controls how many bars in the past to use and is a proxy for the timescale the trend probability should hold. The use of a Max Line improves this further by indicating when a trend is likely to reverse. In most cases a trend must lose momentum before reversing. Hence, a trend probabil
供求区关键价指标 背景 系统自动搜索 K 线中的供求区域,并画出实时的关键价格线,交易者可以根据价格交易线进行交易。 主要特点 系统是自动搜索 K 线中的供求区域的,系统同时会画出实时的关键价格线,交易者可以根据价格交易线进行交易。所以使用供求区策略的交易员无需再耗费时间去寻找标识供求区域,而可以关注在价格对供求区域以及关键价格的反应,制定适合自己的交易策略。 然而供求区策略本身就是一个在震荡时期更加有效的策略,所以当市场呈现强大趋势的时候,应当小心使用,或者按顺应趋势的方向使用指标提供的建议。   范围 ShowZones :是否显示供求区域 DrawLines: 是否显示关键价格 SupplyZoneLineColor: 供给区价格线颜色 DemandZoneLineColor: 需求区价格线颜色 PenatratedLineColor: 被击穿价格线颜色   执行 只需将指标附加到图表上即可。 请给我您宝贵的意见,让我改进指标。 如有问题,联系微信 imlizard
Watch the Clock
David Leander Tschacher
Watch the Clock shows a clock at a desired position. The clock is useful if you want to check when a candle closes. You can also set an alert to be prepared before the news. ️ Watch the Clock works also in the strategy tester. ️ Watch the Clock requires a minimum of CPU power. ️ Watch the Clock can improve your manual style of trading. Inputs Alert -> At which time should the alert occur? Time Shift in Minutes -> Should the time be incremented by x minutes? Size -> The font size of the tim
MACD Divergence
Sergey Deev
2.5 (2)
The indicator detects divergence signals - the divergences between the price peaks and the MACD oscillator values. The signals are displayed as arrows in the additional window and are maintained by the messages in a pop-up window, e-mails and push-notifications. The conditions which formed the signal are displayed by lines on the chart and in the indicator window. Indicator Parameters MacdFast - fast MACD line period MacdSlow - slow MACD line period MacdSignal - MACD signal line period MacdPric
Dynamic Forex28 Navigator
Bernhard Schweigert
4.43 (7)
Dynamic Forex28 Navigator - 下一代外汇交易工具。 当前 49% 折扣。 Dynamic Forex28 Navigator 是我们长期流行的指标的演变,将三种功能合二为一: 高级货币强度 28 指标 (695 条评论)+ 高级货币 IMPULSE 带警报 (520 条评论)+ CS28 组合信号(奖励)。 有关指标的详细信息 https://www.mql5.com/en/blogs/post/758844 下一代强度指标提供什么? 您喜欢的原始指标的一切,现在通过新功能和更高的精度进行了增强。 主要特点: 专有货币强度公式。  所有时间范围内的平滑和准确的强度线。 非常适合识别趋势和精确进入。 动态市场斐波那契水平(市场斐波那契)。  此指标独有的独特功能。 斐波那契应用于货币强度,而不是价格图表。 适应实时市场活动以获得准确的反转区域。 实时市场动量。  第 9 行显示市场是活跃还是被动。 对于定时交易至关重要。 全面的警报和显示。  每种货币最强的买入和卖出动量。 ​​28 对的双重动量买入和卖出。 超买/超卖警告外部范围和止损。 反转
ZhiBiMACD MT4
Qiuyang Zheng
4.5 (2)
这是一款独特的MACD指标,它比传统MACD要准确,而且好用。它适合任何图表周期,并且适合任何市场品种。 红色的柱子是(Buy)的波段信号、蓝色的柱子是(Sell)的波段信号。 黄色线和绿色线是趋势线,这两条线永远不会交叉。 Buy:蓝色柱子中,再看绿色线向上穿越中间0轴。 Sell:红色柱子中,再看黄色线向下穿越中间0轴。 这款MACD的背离形态信号的准确率在99%: 背离形态Buy:价格一个波段比一个波段低,而指标的柱子却越缩越高,这种情况下可以立即做Buy单。 背离形态Sell:价格一个波段比一个波段高,而指标的柱子却越缩越低,这种情况下可以立即做Sell单。 注意:指标里面的五角星会随着价格波动而变化。
The indicator identifies two most important patterns of technical analysis - Pin Bar and Engulfing. MT5-version  https://www.mql5.com/en/market/product/53701 Settings: Mincandle size for PinBar - The minimum size of the Pin-Bar candlestick; Percentage of candle body on size - The percentage of the candle body in relation to its length; PinBar Alert - Alert when a Pin-Bar is detected; PinBar Mail - Sends an email when a Pin Bar is found; PinBar Notification - Sends a push notification when a Pin
ECM Elite Channel is a volatility-based indicator, developed with a specific time algorithm, which consists of finding possible corrections in the market. This indicator shows two outer lines, an inner line (retracement line) and an arrow sign, where the channel theory is to help identify overbought and oversold conditions in the market. The market price will generally fall between the boundaries of the channel. If prices touch or move outside the channel, it's a trading opportunity. The ind
PABT Pattern Indicator - it's classical system one of the signal patterns. Indicator logic - the Hi & Lo of the bar is fully within the range of the preceding bar, look to trade them as pullback in trend. In the way if indicator found PABT pattern it's drawing two lines and arrow what showing trend way.  - First line - it's entry point and drawing at: 1. On the high of signal bar or on middle of the signal bar (depending from indicator mode) for buy; 2. On the low of signal bar or on middle of t
RQL Trend Board – Description RQL Trend Board   is a simple but powerful multi-timeframe trend dashboard. It shows the current market bias across several timeframes at the same time, using an internal trend-classification method. Each timeframe is displayed as a colored box:   Green   – bullish bias → look for   long   setups   Yellow   – ranging / unclear →   no trade zone   Red   – bearish bias → look for   short   setups The indicator gives a clear   overall picture   of where the
FREE
VR Cub
Vladimir Pastushak
VR Cub 这是获得高质量切入点的指标。该指标的开发是为了促进数学计算并简化对仓位入场点的搜索。多年来,该指标所针对的交易策略已被证明其有效性。交易策略的简单性是其巨大的优势,即使是新手交易者也能成功进行交易。 VR Cub 计算开仓点以及获利和止损目标水平,这显着提高了效率和易用性。查看使用以下策略进行交易的屏幕截图,了解简单的交易规则。 设置、设置文件、演示版本、说明、问题解决,可以从以下位置获取 [博客] 您可以在以下位置阅读或撰写评论 [关联] 版本为 [MetaTrader 5] 计算入场点的规则 开仓 要计算入场点,您需要将 VR Cub 工具从最后一个高点拉伸到最后一个低点。 如果第一个点在时间上早于第二个点,交易者等待柱线收于中线上方。 如果第一个点在时间上晚于第二个点,交易者等待柱线收于中线下方。 根据上述条件,严格在 柱线收盘 后建仓。 换句话说,如果我们在小时图上进行交易,那么从最高点到最低点的时间距离必须超过24小时,最高点和最低点之间的点数必须大于或等于平均价格变动每天。 维持和改变市场地位 可以有多个未平仓头寸;每个头寸都可以单独修改。 VR Cub
Spirit mt4
Alena Snigireva
5 (1)
Spirit mt4 is an indicator that works without flashing, the signals are triggered after the arrow at the beginning of the next candle Includes several indicators for overbought and oversold levels. Works with any currency pair: EUR/USD, AUD/USD and others. After the purchase, send me a private message and I will send you the settings that I use for this indicator. Suitable for trading cryptocurrencies. I like to trade cryptocurrency more, so I use it more there. It can also be used for bi
Distinctive
Tatiana Savkevych
Distinctive is a forex trending arrow indicator for identifying potential entry points. I like it, first of all, because it has a simple mechanism of work, adaptation to all time periods and trading tactics. Created on the basis of a regression channel with filters. Plotting the Lawrence indicator signals on a price function chart using a mathematical approach. How it works - when the price breaks out in the overbought / oversold zone (channel levels), a buy or sell signal is generated. Everyt
FFx Basket Scanner
Eric Venturi-Bloxs
MetaTrader 5 version available here : https://www.mql5.com/en/market/product/24882 FFx Basket Scanner is a global tool scanning all pairs and all timeframes over up to five indicators among the 16 available. You will clearly see which currencies to avoid trading and which ones to focus on. Once a currency goes into an extreme zone (e.g. 20/80%), you can trade the whole basket with great confidence. Another way to use it is to look at two currencies (weak vs strong) to find the best single pairs
该产品的买家也购买
TrendMaestro
Stefano Frisetti
4 (4)
Attention: beware of SCAMS, TRENDMAESTRO is only ditributed throught MQL5.com market place. note: this indicator is for METATRADER4, if you want the version for METATRADER5 this is the link:  https://www.mql5.com/it/market/product/108106 TRENDMAESTRO ver 2.5 TRENDMAESTRO recognizes a new TREND from the start, he never makes mistakes. The certainty of identifying a new TREND is priceless. DESCRIPTION TRENDMAESTRO identifies a new TREND in the bud, this indicator examines the volatility, volumes a
Miraculous 指标 – 100% 不重绘的外汇和二元期权工具,基于江恩九方图 这个视频介绍的 Miraculous 指标 是一款专为外汇和二元期权交易者开发的高精度、强大交易工具。该指标的独特之处在于它建立在传奇的 江恩九方图 和 江恩振动法则 之上,使其成为现代交易中可用的最精确预测工具之一。 Miraculous 指标 完全不重绘 ,这意味着它的信号在 K 线收盘后不会改变或消失——你看到的就是你得到的。这为交易者提供了可靠且一致的基础,让他们能够自信地进出场交易。 主要特点: 基于江恩九方图和江恩理论构建 100% 不重绘的信号系统 适用于所有时间周期(M1、M5、H1、H4、日线、周线) 适用于外汇和二元期权交易 清晰的买卖信号,准确率高 可用于剥头皮、日内交易或波段交易 兼容大多数 MT4 平台 这款工具旨在帮助初学者和专业交易者做出更好、更明智的决策。无论您是交易货币、指数还是二元期权,Miraculous 指标都将为您在市场中提供所需的优势。
Breakout Arrows Mt4
Michael Oko Oboh
5 (1)
Trend Breakout Arrows Indicator The Trend Breakout Arrows Indicator is a momentum-based signal tool designed to identify potential bullish and bearish breakout opportunities. It displays clear arrow signals directly on the price chart, helping traders quickly recognize possible trend changes and continuation setups. Up Arrow (Buy Signal) A magenta up arrow appears below a candle when bullish momentum begins to strengthen. This signal indicates that buying pressure may be overtaking selling press
TRADING STRATEGY GUIDE DELIVERY The full Trading Strategy Guide will be sent directly to you after purchase. Just message me on MQL5 and ask for it — you'll receive it instantly, along with priority support and setup help. Powered Market Scanner for Smart Trading Decisions Keypad Support & Resistance is a next-generation MT4 trading system built for serious traders who demand precision, reliability, and clarity. It combines advanced smart filters with real-time price structure logic to genera
CountSig
Yin Zhou Luo
一款信号统计指标(MT4)——实现基于当前图表周期下的单线MA转向和双线MA金叉/死叉统计 . 转向定义:前一K向下或走平,当前K向上,视为转向向上;反之,转向向下。 金死叉定义:前一K快线在慢线下方,当前K快线在慢线上方,为金叉;反之,死叉。 参数及使用说明: 1、可指定统计K线数。 2、可指定4个不同的日内时间段,格式如"03:00-07:59",4个时间段可交叉任意输入。 3、可配置ABC三个浮盈区间段点值。如:分界区间统计小点值设为500,即当某转向信 号出现后到下一反向信号止浮盈<=此点值,计入A区间; 若大于此点值<大分界点值时,计入B区间;若大于“大分界点值”计入C区间。 4、最大/最小浮盈统计。显示所有统计区间内的最大浮盈点值和最小浮盈点值(亏损点值)。 5、输出完整信号,按信号出现顺序排列,如“ACCBCA”之类。 6、综合预测。使用概率、周期、趋势、马尔可夫链等综合概算输出预测该信号出现的归类概率值。 7、加载指定MA线。在当前图表自动载入相应设置的MA线。 8、自适应列宽。以完整显示统计信号数。 9、用法:点击相应统计按钮即输出相应的统计表格.
Fxland Price Reversal Zones (MT4) FXLAND Smart Reversal Indicator is a professional technical analysis tool designed to help traders identify potential price reversal zones and key market turning points with clarity and precision. The best reversal indicator and price return by choosing only one ceiling or floor in each time frame A masterpiece of combining mathematics and Gann, fractal matrix, Fibonacci, movement angle and time. Completely intelligent Key Features Detects potential pr
VTrende Pro mt4
Andrii Diachenko
3 (2)
VTrende Pro MT4 - MTF indicator for trend trading with a display panel for MT5 *** Videos can be translated into any language using subtitles (video language - Russian) Although the signals of the VTrende Pro indicator can be used as signals of a full-fledged trading system, it is recommended to use them in conjunction with the Bill Williams TS. VTrende Pro  MT4 is an extended version of the VTrende indicator. Difference between Pro version and VTrende: - Time zones - Signal V - signal 1-2 wave
WanaScalper MT4
Isaac Wanasolo
1 (1)
A scalping indicator based on mathematical patterns, which on average gives signals with relatively small SL, and also occasionally helps to catch big moves in the markets (more information in the video) This indicator has three main types of notifications: The first type warns of a possible/upcoming signal on the next bar The second type indicates the presence of a ready signal to enter the market/open a position The third type is for SL and TP levels - you will be notified every time price re
FFx Engulfing Setup Alerter gives trade suggestions with Entry, Target 1, Target 2 and StopLoss. Below are the different options available: Entry suggestion - pips to be added over the break for the entry 3 different options to calculate the SL - by pips, by ATR multiplier or at the pattern High/Low 3 different options to calculate the 2 TPs - by pips, by ATR multiplier or at Risk/Reward Offset the dashboard - any place on the chart Remove the suggestion once the price reached the SL line Lines
FFx InsideBar Setup Alerter gives trade suggestions with Entry, Target 1, Target 2 and StopLoss. Below are the different options available: Entry suggestion - pips to be added over the break for the entry Minimum candle size - to avoid too close buy/sell entry suggestions 3 different options to calculate the SL - by pips, by ATR multiplier or at the pattern High/Low 3 different options to calculate the 2 TPs - by pips, by ATR multiplier or at Risk/Reward Offset the dashboard - any place on the c
FFx OutsideBar Setup Alerter gives trade suggestions with Entry, Target 1, Target 2 and StopLoss. Below are the different options available: Entry suggestion - pips to be added over the break for the entry. 3 different options to calculate the SL - by pips, by ATR multiplier or at the pattern High/Low. 3 different options to calculate the 2 TPs - by pips, by ATR multiplier or at Risk/Reward. Offset the dashboard - any place on the chart. Remove the suggestion once the price reached the SL line.
FFx PinBar Setup Alerter gives trade suggestions with Entry, Target 1, Target 2 and StopLoss. Below are the different options available: Entry suggestion - pips to be added over the break for the entry Minimum candle size - to avoid too small candles 3 different options to calculate the SL - by pips, by ATR multiplier or at the pattern High/Low 3 different options to calculate the 2 TPs - by pips, by ATR multiplier or at Risk/Reward Offset the dashboard - any place on the chart Remove the sugges
Lineverse Trendlines
Arkady Segal
5 (1)
Automatic, live & interactive picture of all trendlines. Assign push, email and sound alerts to the lines of your choice and be informed about price rollback, breakout, rollback after breakout, number of rollbacks, line expiration by double breakout. Correct, drag or delete the lines and interactively tune the line system. https://youtu.be/EJUo9pYiHFA . Chart examples https: //www.mql5.com/en/users/efficientforex Price Interaction Events All events are effective immediately and only after one
FFx MACD Divergences
Eric Venturi-Bloxs
The purpose of this new version of the MT4 standard indicator provided in your platform is to display in a sub-window multiple timeframes of the same indicator with its divergences. See the example shown in the picture below. But the display isn't like a simple MTF indicator. This is the real display of the indicator on its timeframe. Here's the options available in the FFx divergences indicator: Select the timeframes to be displayed (M1 to Monthly) Define the width (number of bars) for each tim
FFx RSI Divergences
Eric Venturi-Bloxs
The purpose of this new version of the MT4 standard indicator provided in your platform is to display in a sub-window multiple timeframes of the same indicator with its divergences. See the example shown in the picture below. But the display isn't like a simple MTF indicator. This is the real display of the indicator on its timeframe. Here's the options available in the FFx divergences indicator: Select the timeframes to be displayed (M1 to Monthly) Define the width (number of bars) for each tim
FFx CCI Divergences
Eric Venturi-Bloxs
The purpose of this new version of the MT4 standard indicator provided in your platform is to display in a sub-window multiple timeframes of the same indicator with its divergences. See the example shown in the picture below. But the display isn't like a simple MTF indicator. This is the real display of the indicator on its timeframe. Here's the options available in the FFx divergences indicator: Select the timeframes to be displayed (M1 to Monthly). Define the width (number of bars) for each ti
The FFx Dashboard MTF alerter will show you on a single chart all the timeframes (M1 to Monthly) with their own status for the indicator. 2 Alert Options: Single timeframe: each selected timeframe alert separately when a signal occurs Multi timeframes: all selected timeframes must agree for an alert to be triggered Both options have an input to select the timeframes to be used for the alert(s). How to Understand the Status: Green/Red square: histogram above/below 0 line Green square + Red bord
The FFx Dashboard MTF alerter will show you on a single chart all the timeframes (M1 to Monthly) with their own status for the indicator. 2 Alert Options: Single timeframe: each selected timeframe alert separately when a signal occurs Multi timeframes: all selected timeframes must agree for an alert to be triggered Both options have an input to select the timeframes to be used for the alert(s). How to understand the status: Green/Red square: RSI above/below 50 line Green square + Red border: R
The FFx Dashboard MTF alerter will show you on a single chart all the timeframes (M1 to Monthly) with their own status for the indicator. 2 Alert Options: Single timeframe: each selected timeframe alert separately when a signal occurs Multi timeframes: all selected timeframes must agree for an alert to be triggered Both options have an input to select the timeframes to be used for the alert(s). How to understand the status: Green/Red square: Stoch above/below 50 line Green square + Red border:
The FFx Dashboard MTF alerter will show you on a single chart all the timeframes (M1 to Monthly) with their own status for the indicator. 2 Alert Options: Single timeframe: each selected timeframe alert separately when a signal occurs Multi timeframes: all selected timeframes must agree for an alert to be triggered Both options have an input to select the timeframes to be used for the alert(s). How to understand the status: Green/Red square: Price above/below Cloud (Kumo) Green square + Red bo
The FFx Dashboard MTF alerter will show you on a single chart all the timeframes (M1 to Monthly) with their own status for the indicator. 2 Alert Options: Single timeframe: each selected timeframe alert separately when a signal occurs Multi timeframes: all selected timeframes must agree for an alert to be triggered Both options have an input to select the timeframes to be used for the alert(s). How to understand the status: Green/Red square: MA pointing Up/Down Green square + Red border: MA po
The FFx Dashboard MTF alerter will show you on a single chart all the timeframes (M1 to Monthly) with their own status for the indicator. 2 Alert Options: Single timeframe: each selected timeframe alert separately when a signal occurs. Multi timeframes: all selected timeframes must agree for an alert to be triggered. Both options have an input to select the timeframes to be used for the alert(s). How to understand the status: Green square: Price above PSAR Red square: Price below PSAR Options
The FFx Dashboard MTF alerter will show you on a single chart all the timeframes (M1 to Monthly) with their own status for the indicator. 2 Alert Options: Single timeframe: each selected timeframe alert separately when a signal occurs Multi timeframes: all selected timeframes must agree for an alert to be triggered Both options have an input to select the timeframes to be used for the alert(s). How to understand the status: Green/Red square: CCI above/below levels (ie. 100/-100) Grey square: C
The FFx Dashboard MTF alerter will show you on a single chart all the timeframes (M1 to Monthly) with their own status for the indicator. 2 Alert Options: Single timeframe: each selected timeframe alert separately when a signal occurs Multi timeframes: all selected timeframes must agree for an alert to be triggered Both options have an input to select the timeframes to be used for the alert(s). How to understand the status: Green/Red square: ADX above level Grey square: ADX below level Red bor
The FFx Dashboard MTF alerter will show you on a single chart all the timeframes (M1 to Monthly) with their own status. 2 Alert Options: Single timeframe: each selected timeframe alert separately when a signal occurs Multi timeframes: all selected timeframes must agree for an alert to be triggered Both options have an input to select the timeframes to be used for the alert(s). How to understand the status: Green/Red square: bullish/bearish candle Options available in the FFx Dashboard Alerter
The indicator of a Professional Trader is an arrow indicator for predicting the direction of price movement. I have been working on this indicator since 2014. You can use this indicator as your main indicator, use its entry signals, and use it as your only indicator to find entry points. About the product: Recommended TF [H4-D1-W1]   . The indicator predicts the direction of the next candle. Fits a variety of tools; Flexibility in settings for different instruments and intervals through the MO
THE GRAFF III
Charles Harper
The [GRAFF] III manual trading system is based on multiple MetaTrader (MT4) indicators. Together, the entire PACK of GRAFF III indicators makes an advanced trading tool. The system consists of over 20 different custom-built indicators which have been carefully selected and tested in the long term to produce strong and efficient trading signals. The particular indicators are based on different mathematical formulas, so the entire system is calibrated to remove false signals from its own indicator
FFx Universal Strength Meter PRO is more than a basic strength meter. Instead of limiting the calculation to price, it can be based on any of the 19 integrated strength modes + 9 timeframes. With the FFx USM, you are able to define any period for any combination of timeframes. For example, you can set the dashboard for the last 10 candles for M15-H1-H4… Full flexibility! Very easy to interpret... It gives a great idea about which currency is weak and which is strong, so you can find the best pai
作者的更多信息
NextCandlePredictor No Repaint
Martin Alejandro Bamonte
NextCandlePredictor 指标 NextCandlePredictor 是一种带有警报的信号指标,不会重绘,不会改变颜色,不会移动,不会消失且没有延迟。它将帮助您识别任何时间框架内的下一个或即将到来的蜡烛的方向。高度推荐用于纽约、伦敦或甚至两者重叠等高波动市场。 主要特征: 时间框架的多功能性: 提供在任何时间框架内快速准确的信号,从 M1 到 H1 及更长时间。 清晰的买入/卖出信号: 使用 ADX 的 DI+ 和 DI- 线生成清晰的买入和卖出信号,确保您做出最佳的交易决策。 直观的可视化: 信号直接显示在图表上,绿色(买入)和红色(卖出)箭头,允许快速和轻松的读取。 可自定义的设置: 根据您的偏好和交易策略调整分析的柱数和警报选项。请根据您希望使用的 TF 查看下面的建议表。 即时和蜡烛收盘时的可选警报: 默认情况下,警报会在满足 ADX 条件的同一蜡烛上发出,确保信号的及时性。您还可以选择在当前蜡烛收盘时接收警报以获得更多确认。 快速性能: 设计为高效运行,理想用于高频操作和快速决策。 不重绘: 一旦信号发出,它将固定在当前蜡烛上,不会移动、改变颜色或消失。 无延
Candle Probability Scalper
Martin Alejandro Bamonte
Candle Probability Scalper 该指标使得剥头皮交易变得简单且100%直观。 Candle Probability Scalper 会让你一目了然地看到买方和卖方的力量百分比数据,以 实时 方式显示在当前K线中。 百分比数据会在每个跳动中更新,因此每秒钟你都可以知道大多数买卖双方的行为,没有任何延迟。这将极大地帮助你确定或确认买方和卖方的力量,以及价格可能的走向。 以下是如何使用的指南: 1. 查看M1时间框中的买方和卖方百分比,并用其他时间框(M5, M15)进行确认: 如果 M1中的买方百分比超过60% ,且M5和M15中的买方百分比与M1一致,也超过60%,这是一个 买入 的好信号。 如果 M1中的卖方百分比超过60% ,且M5和M15中的卖方百分比与M1一致,也超过60%,这是一个 卖出 的好信号。 这确保了动力不仅仅是短暂的,并有助于确认方向的稳定性。 就是这么简单!观察1分钟时间框中的市场主导方,并通过其他时间框来确认信号。 2. 何时退出交易: 保持交易短平快:一旦方向开始减弱或买卖双方的百分比显著下降,就退出市场。记住,这是一种剥头皮交易方式,
Trade Planner Pro
Martin Alejandro Bamonte
Now free. Plan every trade before you click, see your real risk, reward and lot size right on the chart. Plan the trade. See the risk. Trade with confidence. Trade Planner Pro turns any chart into a visual trade-planning workspace. Drag three lines — Entry, Stop Loss and Take Profit — and instantly see your risk/reward ratio, the exact lot size for your chosen risk %, the real money you put on the line, the spread cost, and clear warnings before you commit. No more manual lot math, no more gu
FREE
Real Spread Monitor Pro
Martin Alejandro Bamonte
Now free. Know your real spread, and know exactly what it costs you on every trade. Know your real spread. Know what it costs you. Real Spread Monitor puts the one number most traders ignore right on your chart: the real bid/ask spread, live, and exactly what it costs you per trade. Scalpers and intraday traders lose money to the spread every single day. This tool shows you when the spread is normal, when it is too wide to trade, and how it behaves hour by hour — so you trade with your eyes o
FREE
Automatic Fibonacci Pivots
Martin Alejandro Bamonte
Now free. The key Fibonacci pivot levels, drawn for you automatically every day, on any timeframe. Automatic Fibonacci Pivots calculates the daily support and resistance from the Fibonacci sequence and plots them clean on your chart: the daily pivot, S1/S2/S3 below and R1/R2/R3 above. These are the price zones where the market tends to react, bounce or break, and now you see them without drawing a single line. What it does: - Daily Fibonacci pivot levels (pivot, S1/S2/S3, R1/R2/R3), updated
FREE
Forex Inspector Broker X-Ray See exactly what your broker charges, and how it compares, in one clean panel on your chart. ForexInspector Broker X-Ray reads your live account conditions and shows them in a professional tabbed panel: real spread, true cost per lot (spread plus commission), swaps in money, leverage, margin, execution type, stop-out, ping and a 0 to 10 broker score. It also shows how your broker ranks against the community on forexinspector.com. 100% FREE  •  It never trades  •  It
FREE
"MultiSymbol & TF Chart Integrated" 指标旨在快速提供全面的市场视图,允许您在单个图表上监控多达60个货币对(多模式)或在所有时间框架中查看您交易的货币对(简单模式)。 主要优点: 全面监控: 允许在单个图表上一目了然地实时监控所有所需的货币对。 节省时间: 避免了在图表之间切换的需要,实时查看每个货币对的行为。 趋势分析: 非常适合趋势交易者,允许您查看更高的时间框架以在做出决策前确认趋势。 极端定制化: 根据您的具体需求调整指标的每个方面。 极端定制化: 高度可配置的指标参数: 符号和时间框架: 允许配置多达60个不同的符号。 每个符号可以有自己的时间框架(例如,M1,M5,M15,M30,H1,H4,D1,W1,MN1)。 显示模式: 简单模式: 配置具有特定时间框架的单个图表。 多模式: 配置具有不同符号和时间框架的多个图表。 颜色配置: 可定制的看涨和看跌蜡烛颜色。 蜡烛灯芯的颜色。 价格刻度的颜色。 缩放和定位: 基于价格范围和ATR的图表自动缩放。 使用像素参数定位图表。 图表布局的行数和列数。 列与列之间的间距和行与行之间的间距。 图
FREE
Pairs and TF Changer
Martin Alejandro Bamonte
厌倦了在多个图表之间切换以监控不同的货币对和时间框架? Pairs and TF Changer 指标将彻底改变您的交易体验! 加载所有策略指标后,将 Pairs and TF Changer 添加到图表中。如有必要,您可以调整其位置、颜色或显示的列数! 主要特点: 无缝集成: 轻松将此指标集成到您的交易策略中。 只需点击一次,即可在单个图表上交易所有货币对和时间框架。 无需切换或打开其他图表。 高度可定制: 在图表上的任何位置调整其位置(上、下、左、右)。 配置显示1行或10行按钮。 自定义颜色以匹配您的交易主题。 使按钮透明以保持图表清晰整洁。 通用兼容性: 兼容所有类型的指标和策略。 支持所有符号,包括外汇、金属、美股、指数、石油、期货和加密货币。 配置参数: UniqueID: "Pairs and TF Changer" 指标的唯一标识符。 ToAddSymbols: "您可以添加任何无空格的符号,以分号 ';' 分隔" 允许您添加要监控的符号。 Symbols: "EURUSD;USDJPY;GBPUSD;USDCHF;AUDUSD;AUDCAD;AUDCHF;AUDNZD
FREE
Aurum Apex Mt4 EA
Martin Alejandro Bamonte
5 (2)
AURUM APEX: The 2026 Gold Standard in Automated Trading 专为 XAUUSD 打造的高频(HFT)智能交易系统(EA) ,现已支持 MT4 和 MT5 MT5 版本: https://www.mql5.com/en/market/product/179737 以下是每个账户的 investor(只读)登录信息: MetaTrader 4 • 账户: 12754297 • Investor 密码: BinaryforexeaAurum-MT4 MetaTrader 5 • 账户: 52904796 • Investor 密码: BinaryforexeaAurum-MT5 无论您从较小的资金还是较大的资金起步,Aurum Apex 都能自动适应:当您追求速度时,它会激进地复利增长;当您想要稳健时,它会以极小的回撤平稳前行。油门始终掌握在您手中。 要求 账户类型: 仅限 RAW 或 ECN。不支持 micro、mini、cent 或 standard 账户!! 账户类型 -  MT5: 必须为 HEDGING(对冲)模式。
Scalping Signal NO Repaint NO Lag
Martin Alejandro Bamonte
3 (2)
"Scalping Signal No Repaint No Lag" 是市场上唯一一个在拖动到任何图表上时,无需加载任何模板或其他指标就能自动加载所有必要指标的指标。它会自动配置图表,使其看起来与提供的图像完全相同。此指标保证没有重绘或延迟的信号,因此非常适合在所有货币对和时间框架(TF)上进行剥头皮交易策略。 功能 自动加载指标 :当您将指标拖动到任何图表上时,所有附加的必要指标都会自动加载,并且图表会根据预设的偏好进行配置。不过,如果您愿意,可以从设置中更改参数。 图表可视化 :调整图表属性以增强可视化效果,包括使用日本蜡烛和特定颜色的多头和空头蜡烛。可以根据需要修改背景和蜡烛的颜色。 信号生成 :使用两个移动平均线之间的差异以及RSI与其EMA的交叉来生成买入和卖出信号,并在图表上用箭头表示。 趋势可视化 :根据快速和慢速移动平均线的比较显示当前市场趋势(多头、空头或中性)。 点差可视化 :在图表上显示当前货币对的点差,以便您选择点差较低的货币对。开仓前请务必检查。 用于信号的指标 简单移动平均线(SMA) :用于计算快速和慢速移动平均线之间的差异。这些移动平均线不会重绘,因为
Clear Breakout
Martin Alejandro Bamonte
5 (2)
"Breakout Buy-Sell" 指标旨在根据不同市场交易时段(东京、伦敦和纽约)的价格突破,识别并突出潜在的买卖机会。该指标帮助交易者清晰地可视化买卖区域,以及止盈(TP)和止损(SL)水平。 使用策略 该指标可以按以下方式使用: 初始设置 :选择交易时段并调整 GMT 偏移。 市场可视化 :观察每个交易时段开始时绘制的突破箱。这些箱子表示该期间的最高点和最低点。 买卖信号 :价格突破箱子的最高点被认为是买入信号。价格突破最低点被认为是卖出信号。 风险管理 :使用 TP1、TP2、TP3 和 SL 水平来管理头寸。TP 水平设计用于不同的利润目标,而 SL 确保对不利走势的保护。 应用策略 为了最大限度地利用此指标,建议采用以下策略: 伦敦时段 :选择伦敦时段,并根据您的经纪商位置调整 GMT 偏移。 目标设置 :根据当前市场波动性定义 TP 和 SL,或允许每个货币对的特定建议。 主动监控 :观察突破箱,等待市场条件下的买入或卖出信号。 警报管理 :设置警报,当价格达到关键水平时通知您,这样就不需要不断监控图表。 外部参数说明 Margin :在突破水平上添加的点数空间,以建
GbpUsd Pip Hunter EA
Martin Alejandro Bamonte
GBPUSD Pip Hunter EA 主要功能: 为GBPUSD在M15时间框架优化: 专为GBPUSD货币对在15分钟图表上设计和测试。 最低推荐账户余额: 要求最低账户余额为1000美元,以确保低回撤。 适合的点差: 最好使用低点差或ECN账户,以最大化盈利。 风险管理: 包括通过将指数手数功能设置为1.0来禁用该功能的选项,根据您的交易需求进行调整。 可定制参数: 提供一系列可调整参数,允许用户根据自己的交易风格和风险承受能力定制EA。 GBPUSD Pip Hunter EA参数解释 MM(资金管理开关) 描述: 一个用于启用或禁用资金管理功能的开关。 选项: 否: 禁用资金管理。 是: 启用资金管理。 MMType 描述: 指定使用的资金管理类型。 选项: 否: 禁用资金管理。 是: 启用资金管理。 UseAdd 描述: 用于启用或禁用额外交易仓位的布尔参数。 选项: 是: 允许多个交易仓位。 否: 只允许一个交易仓位。 LotExponent 描述: 用于计算手数的指数值。 示例: 1.5 备注: 将其设置为1.0表示禁用指数手数功能,所有交易使用相同的手数。 Slip
Multi Timeframe Moving Averages
Martin Alejandro Bamonte
MTFMA(多时间框架移动平均线)指标在不同的时间框架上使用多条移动平均线(MA)提供买卖信号(不会重绘),显示在主图表的独立窗口中。它既多功能又易于解读,适用于小时间框架的剥头皮交易和大时间框架的长期交易。 为什么是多时间框架? 术语多时间框架指的是指标使用和组合多个时间框架数据的能力。MTFMA基于四条可配置的移动平均线(MAs)计算并显示信号。每条MA可以调整不同的周期、计算方法和价格类型,使交易者能够在一个图表上看到短期和长期趋势的组合。 关键点: 多功能性:适用于任何时间框架,从几分钟到几个月,适用于剥头皮交易和长期交易。 不重绘:一旦生成信号(向上或向下箭头),它不会改变颜色,允许交易者依靠生成的信号做出交易决策。 易于解读:买卖信号在下方指标中清晰显示为绿色和红色箭头,消除了复杂分析的需要。 可配置性:用户可以调整移动平均线的参数以适应他们的具体交易策略。 增强策略: 为了实现安全的入场,建议等待所有四条EMA变为相同颜色。最佳入场是在所有四条EMA变色的第一根或第二根蜡烛上进行。 只有在与区间突破相一致时,您可以在4根甚至5根蜡烛后打开您的头寸。我想强调,只有在出现明确
GO Trend MultiTimeFrame
Martin Alejandro Bamonte
GoTrend 多时间框架指标 "GoTrend Multi-Timeframe" 指标是交易员寻求快速高效地评估不同时间框架内货币对整体和具体趋势的必备工具。 此指标允许交易员一目了然地获得市场方向的清晰全面视图,优化决策过程并提高其交易策略的有效性。 主要特点: 多时间框架分析: 此指标提供六个不同时间框架的详尽分析:M5, M15, M30, H1, H4 和 D1,使交易员能够了解每个时间段的趋势。 集成技术指标: 此指标使用五个可靠的技术指标:RSI, SAR, MA, MACD 和 ADX,以确定每个时间框架的趋势方向。 清晰直观的可视化: 信号显示在主图表的选定角落,使用直观的符号和颜色。这使得交易员能够一目了然地评估市场情况。 组合信号: 除了每个指标的单个信号外,"GoTrend Multi-Timeframe" 还提供一个组合信号,总结该货币对的整体市场趋势。 交易优势: 快速清晰的趋势概览: 使用此指标,交易员可以快速清晰地看到多个时间框架内的趋势方向,这对于做出知情且及时的决策至关重要。 优化进出场点: 不同时间框架内的买卖信号帮助交易员优化进出场点,增加交易成
Gold Vertex EA
Martin Alejandro Bamonte
Gold Vertex EA is a reliable and stable option for those looking to automate their trading in the gold market. With a robust system based on one of the most effective indicators and a solid trend-following strategy, Gold Vertex EA is a powerful tool for traders who want precise, worry-free trading. Requirements Platform : MetaTrader 4 Supported Instruments : Specifically developed and configured for Gold (XAUUSD) Recommended Account Type : ECN or low spread Minimum Deposit Recommended : $100 Tim
Inferno Signals EA
Martin Alejandro Bamonte
Inferno Signals EA 旨在利用市场的重大波动,运行在稳健的 M30 时间框架上。 它非常适合那些希望以较少的初始资金开始的用户,最低只需每对 100 美元,具有自动资金管理功能,包括动态手数调整和安全措施,如止损(SL)。 凭借低回撤和专注于捕捉最佳机会的策略,Inferno Signals EA 旨在在确保投资安全的前提下最大化收益。该 EA 避免过度交易,仅在特定区域开仓,能够检测到强劲趋势的延续和可能的反转点。当价格处于最佳区域时,Inferno Signals EA 将采取行动并持续进行交易,而当没有明确的机会时,它将暂停操作。 EA 操作: EA 使用挂单方式,如 Buy Stop 和 Sell Stop,这些挂单将相应地变成买单或卖单,并始终通过止损 (SL) 进行保护。 默认设置适用于大多数环境。然而,根据账户类型(推荐使用 ECN 或 Zero Spread 账户),可能需要调整“Distance”参数(默认设置为 21)。根据经纪商和滑点情况,可能需要将其增加到 51。例如,这一调整需要每位交易者根据他们的账户特性和交易的货币对进行测试。 EA 包含最
MarketPrice Indicator
Martin Alejandro Bamonte
The MarketPrice Indicator is designed to provide a quick, one-glance visualization of the trend direction for a currency pair across all time frames (Time Frames), streamlining decision-making. MarketPrice Indicator is based on daily levels and trading signals derived from moving average crossovers and market strength according to various technical indicators. It comes fully configured, though you can, of course, modify any parameters as desired. Indicator Logic The indicator uses a combination
Last 50 Pips
Martin Alejandro Bamonte
FlashPoints Breakout
Martin Alejandro Bamonte
在每天的市场开始时, Flashpoints Breakout 将使用前一天的数据(最高价、最低价和收盘价)来审查枢轴、支撑和阻力位,以计算两个突破水平(看涨和看跌)。 这样一来,您可以在早上第一时间获得新的入场水平以及止盈 (TP) 和止损 (SL) 值,从而在无需额外计算的情况下下达买入止损或卖出止损挂单。 通过 Flashpoints Breakout ,您每天可以根据预期的突破水平下达 1 或 2 笔买入止损单和 1 或 2 笔卖出止损单,以确保不遗漏任何机会。 查看顶部的数据面板并下达订单 —— 1 或 2 笔买单和 1 或 2 笔卖单。在面板中,您会找到精确的入场值、SL 和 TP,以及图表上对应这些值的线条(参见图像)。 1. 买入操作 (BUY): 入场 1 "BUY" ==> 在买入区域: 订单 1: 买入止损在买入区域。 止损 (SL): 卖出区域。 止盈 (TP): 突破高点。 入场 2 "BUY" ==> 在突破高点: 订单 2: 买入止损在突破高点。 SL: 买入区域。 TP: 目标。 2. 卖出操作 (SELL): 入场 1 "SELL" ==> 在卖出
Buy Sell Magic Signal
Martin Alejandro Bamonte
BUYSELLMAGIC is a non-repainting signal-type trading indicator designed to precisely detect entry points in the market.  Features Reliable and permanent signals : BUYSELLMAGIC signals are final once the candle closes, ensuring they will not be modified or removed from the chart. This gives you the confidence of working with an indicator that keeps its signals stable and trustworthy. Comprehensive alerts : In addition to signals on the chart, you’ll receive notifications via email, pop-up alerts
M1 Easy Scalper
Martin Alejandro Bamonte
4 (3)
M1 EASY SCALPER is a scalping indicator specifically designed for the 1-minute (M1) timeframe, compatible with any currency pair or instrument available on your MT4 terminal. Of course, it can also be used on any other timeframe, but it works exceptionally well on M1 (which is challenging!) for scalping. Note: if you're going to scalp, make sure you have an account suitable for it. Do not use Cent or Standard accounts as they have too much spread! (use ECN, RAW, or Zero Spread accounts) Robustn
Trade Insights Display
Martin Alejandro Bamonte
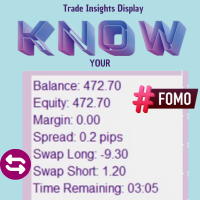
Trade Insights Display is the ideal companion for traders who want to operate with clarity and precision. This indicator provides real-time access to critical account data, such as: Balance Equity Margin Spread Swap Remaining time for the current candle . These data points are essential, regardless of the strategy or other indicators you use. Having this indicator always visible allows you to quickly assess your account status, the swap for each pair (helping you avoid high-cost trades), and the
EuroGeddon EA
Martin Alejandro Bamonte
EUROGEDDON EA – 无与伦比的稳定性与风险控制 EUROGEDDON EA 是一款 自适应智能 全自动交易机器人,专为小账户稳健增长而设计,确保始终保持对账户资金的全面控制。 使用 每 $200 对应 0.01 手 的低风险策略,它在运行过程中实现了极低的回撤,同时展现出卓越的性能 —— 值得你亲自验证。 下载演示版本并亲自体验。 不要只看回测结果,试试我们频道中提供的演示账户,看看它在真实市场中的表现。 即使在重大经济新闻期间也能稳定运行 EA 的逻辑不会受到高影响力的基本面事件影响。它可以在高波动期间持续运行而不被打乱。 自适应智能 (这正是它能在新闻期间稳定运行的关键) 虽然 EA 预设了入场间距和止盈点位,但它并不总是严格遵守这些参数。 在常规市场环境下它会执行设定值,但一旦检测到由新闻或其他因素引发的 高波动情况 ,它就会 实时调整策略 。 它可以在已有交易的情况下,动态修改入场间距和止盈点,从而降低风险,保护账户资金,避免过度暴露。 无需再担心新闻时段! EUROGEDDON 会自动检测市场波动并进行调整, 你无需手动干预 。
ZeroLag TrendCandle Signal
Martin Alejandro Bamonte
ZeroLag TrendCandle — 实时蜡烛图着色与信号系统(无重绘) ZeroLag TrendCandle 是一款 实时趋势检测工具 ,基于先进的 Williams 百分比范围指标(WPR)进行 无重绘的蜡烛图着色 。它通过动态颜色系统高亮显示趋势变化、动量转换和潜在反转, 帮助交易者通过清晰直观的图表立即识别当前市场方向,如图所示。只需一眼,即可清楚识别主导动量及其强度。 核心功能: 无重绘 无重绘, 无后绘 , 信号不消失 , 实时交易中无虚假警报 — 请参阅下方技术说明。    图表上显示的内容不会改变。 实时信号检测(零延迟) 信号在当前蜡烛图收盘后立即生成——无延迟,无重新计算。确保您始终响应经过确认的市场变化,而不是滞后的信号。 支持所有交易品种与周期 完全兼容以下资产类型: 外汇货币对(主要、副对、冷门对) 商品(黄金、白银、原油) 指数(如 S&P500、纳斯达克、DAX、富时等) 加密货币(如比特币、以太坊,取决于您的经纪商) 期货与差价合约(CFD) 股票(如您的经纪商支持) 所有时间周期(从 M1 至 MN) 蜡烛颜色逻辑说明
Candle Fusion Pro
Martin Alejandro Bamonte
Candle Fusion Pro — 蜡烛图形态识别 + 趋势过滤器 + 动量过滤器(无重绘) 检测强大的蜡烛图形态,并通过实时趋势与动量分析确认其强度。 Candle Fusion Pro 是一款为依赖 价格行为精度 、趋势结构和 多重确认 的交易者而打造的终极可视化工具。 核心功能 基于形态的入场 :检测超过 10 种高级日式蜡烛图形态 ,包括: 流星形态(级别 2、3、4) 看涨/看跌吞没 晨星 / 晚星 十字星与十字星形态 锤子线(级别 2、3、4) 刺透线和乌云盖顶 无重绘、无延迟 :箭头和形态标签仅在蜡烛收盘时绘制, 不会随行情变化而改变 。 实时确认 : 趋势过滤器 (根据时间周期自动调整) RSI 强度标签 :颜色显示(绿色 <30,橙色,中性,红色 >70) ADX 动量过滤器 :显示趋势延续或震荡状态(阈值为 25): 强趋势 = 趋势延续 , 弱趋势 = 横盘震荡 可视化优势 : 箭头偏移和文字大小根据时间周期自动调整 整洁界面,趋势方向、RSI、ADX 一目了然 可选图表配色增强视觉聚焦 智能提醒 : 可按图形单独启用或关闭提醒 支持总开关控制所有提醒
ClearView Trend Finder
Martin Alejandro Bamonte
ClearView Trend Finder — 你看得有多清晰? 你是否觉得图表太混乱?太多指标、信号冲突和复杂的线条,反而让分析更加困难? ClearView Trend Finder 完全消除了这些视觉干扰,让你专注于真正重要的部分: 清晰的趋势 。 该系统将图表转化为干净、精准的视图,绝不重绘或修改。 每根K线都经过过滤,仅显示市场的主导方向。这不是普通的蜡烛图,而是专为消除噪音、突出真实趋势而设计的。在图表右上角,标签会清楚地显示当前主趋势是上涨( UPTREND )还是下跌( DOWNTREND ),无需猜测或解释。 如你所见,一切都非常直观: 无需费力,无需猜测,无需困惑 。在后台,指标执行复杂计算,让你以清晰、直接的方式进行交易。 非常适合初学者,在图表上加载后,呈现效果与示例图一致。对于重视简洁操作的交易者来说,也是理想的工具:无多余元素,无复杂系统,关键信息始终可见。 如何使用? ClearView Trend Finder 适用于初学者和资深交易者,可根据交易风格灵活应用。 针对初学者或波段交易者: 推荐的做法是 跟随图表右上角显示的趋势方向进行交易 。这样
Aurum Apex Mt5 EA
Martin Alejandro Bamonte
AURUM APEX: The 2026 Gold Standard in Automated Trading 专为 XAUUSD 打造的高频(HFT)智能交易系统(EA) ,现已支持 MT4 和 MT5 MT4 版本:   https://www.mql5.com/en/market/product/118221 以下是每个账户的 investor(只读)登录信息: MetaTrader 4 • 账户: 12754297 • Investor 密码: BinaryforexeaAurum-MT4 MetaTrader 5 • 账户: 52904796 • Investor 密码: BinaryforexeaAurum-MT5 无论您从较小的资金还是较大的资金起步,Aurum Apex 都能自动适应:当您追求速度时,它会激进地复利增长;当您想要稳健时,它会以极小的回撤平稳前行。油门始终掌握在您手中。 要求 账户类型: 仅限 RAW 或 ECN。不支持 micro、mini、cent 或 standard 账户!! 账户类型 -  MT5: 必须为 HEDGING(对冲)模式
筛选:
无评论
回复评论