Weis Wave with Alert MT5

4.94

Rental/Lifetime Package Options and Privileges 


Rent Monthly Six Months   Yearly/Lifetime
Weis Wave with Speed with Alert+Speed Index
x
x
x
Manual 
x
x
x
Quick Set up Video
x
x
x
Blog
x
x
x
Lifetime Updates
x
x
x
Setup and Training Material
x
x
Discord Access Channel "The SI traders"          x
Rectangle Break Alert Tool     
x


How to trade with it:   http://www.tradethevolumewaves.com 

** If you purchase please contact me to setup your  : Training Room and  complete manual access. 


Weis Wave with Alert MT5

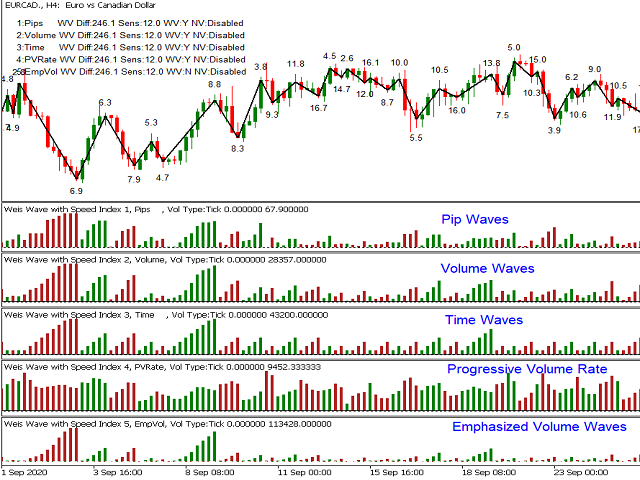
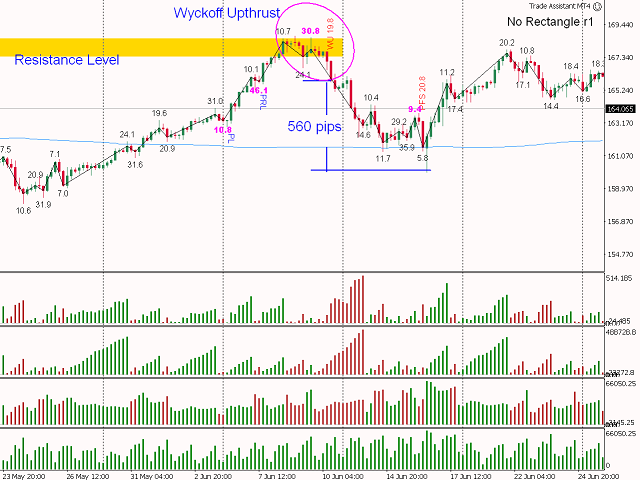
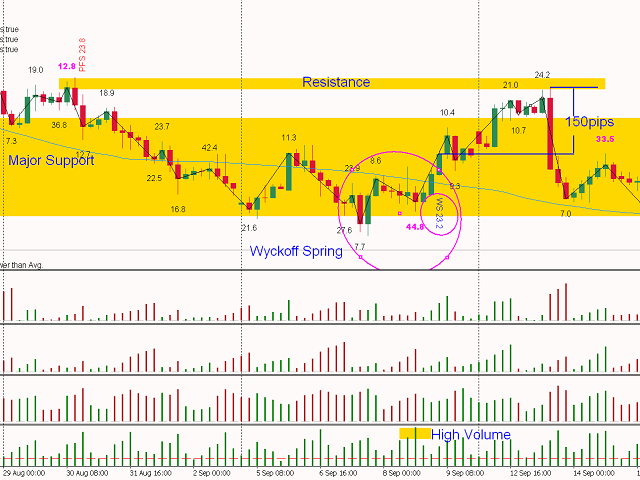
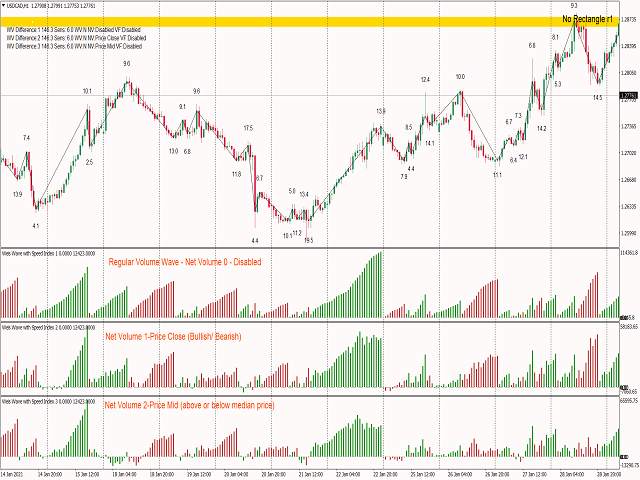
This is a Weis Wave indicator which is based on Richard D. Wyckoff theory. It works in all time periods, range bar and tick bar charts and it can be applied to any market.

This indicator is an evolution of Weis Wave because it offers 3 different swing methodologies feature (auto, manual and ATR, six different wave types,the powerful Speed Index and a display panel analyzing x waves back..  Each price wave is moving in a specific direction up or down until it reverses. In order for the indicator wave to reverse in the opposite direction, the price should exceed the number of points (pip*10) set in the parameters. Therefore, the last wave repaints but the theory behind this trading method is forecasting where the market will go by reading  the previous waves.


Trading Strategies: www.tradethevolumewaves.com Setup Parameters
  • Indicator Number: Multiple Indicators can be added on the same chart. Valid values "0 to 9" and "a-z"
  • Maste Child indicator relationship for parameter sync
  • Swing Metdod
  • Show Orders: display or not your orders
  • Load all Bars: true/false, if false Number of bars back will be loaded
  • Number of bars back: numbers of bars that the indicator will load
  • Wave Direction Change difference in Points: Number of points required for the current wave to reverse and form a new wave
  • Volumetype= true=Tick Volume, false=Real Volume
  • Weighted Volume: true/false - Weights volume of  different sessions taking into consideration that when London and US are operating at same time have the highest volume of all sessions occurs and adjusts the rest of the sessions. With this parameter it very easy visualize which volumes are significant even on Asian hours or non-significant on London-US hrs.
  • Net Volume: 0-Disabled, 1-Price Close, 2 Price Median
  • Wave Type: 0-Regular Volume, 1-Pips, 2-Progressive Volume Rate, 3-Time,4 Emphasized Volume Waves, 5 Inverse Progressive Pip Rate
Speed Index Display and Alert Parameters
  • SI Display: Show or not speed index on the chart 0-No Display, 1 Speed Index only, 2 Volume and Speed Index, 3 Speed Index and Average Speed Index, 4 Speed Index and Wave speed (Fast or SLow)
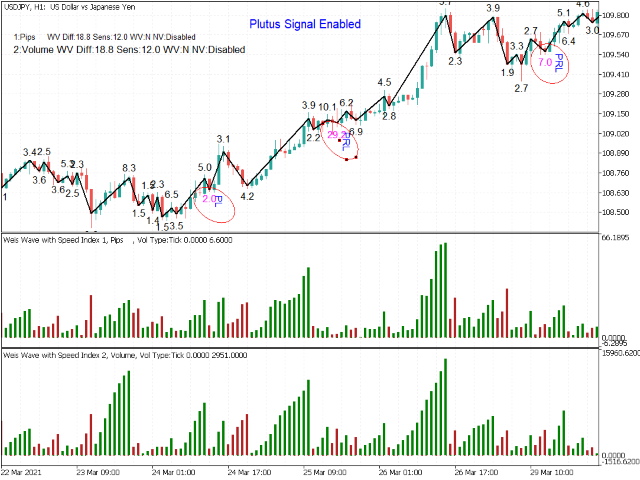
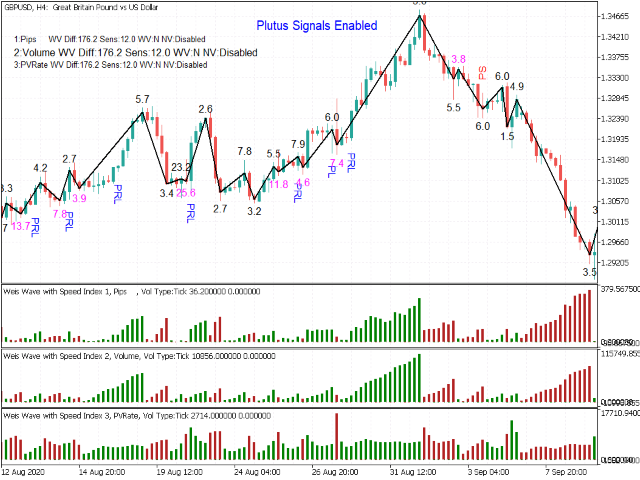
  • Show Plutus Patterns or Not
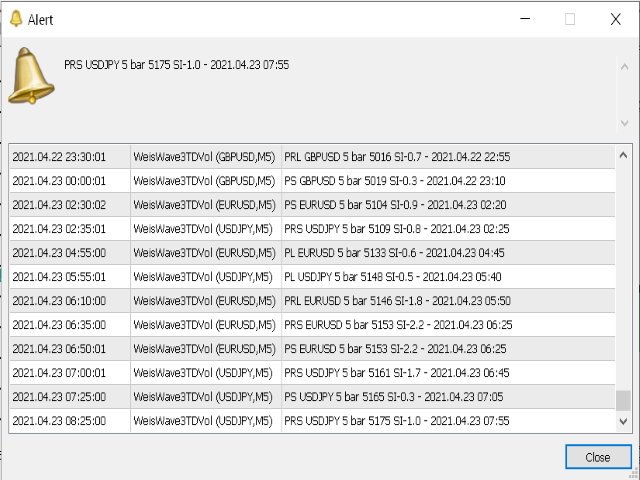
  • Alert on Plutus Patterns: Popup, Sound, Email, Push Notification
  • Display Panel of x wave back analyis
  • SpeedAlert: There are two ways that you can be notified for Extreme Speed Index numbers the Automatic and the Manual, please refer to the manual for explanations.
    • Alerts :Popup, Sound, Email, Push

Format Wave and Label
  • ShowLabels: Display or not the wave type the pips and the number of bars of each wave
  • What to Display:1-Volume,2-Pips, 3-Bars, 4-All, 5-Volume and Pips
  • ShowWaveLine: Draw the wave line or not on the price chart
  • Format: LabelShift, Font size, Color Up, Color Dn, wave color, wave width

Format Numbers for better display parameters
  • Auto Divisor to adjust numbers to your preference.
  • VolDivBy: Volume divider in order to avoid big numbers on the display
  • PipDivBy: Pip distance  divider in order to avoid big numbers on the display
  • SI Multiplier: Speed Index Multiplier for better display
  • Reverse Style: inverts wave style


评分 17
Elgoc Tech
42
Elgoc Tech 2025.10.02 19:37 

I would like to sincerely thank you for sharing your experience and putting together the Weis Wave with the Speedy Index Indicator. Combining the Wyckoff Method, David Weis’s Wave Theory, and Forex into one practical approach has been a breakthrough for me. To me, this is not just another “indicator” – it’s a way to truly read the charts for yourself, without relying on the usual signals like moving average crossovers or candle patterns. For years, I searched for a logical process and a common denominator in trading. I spent thousands of dollars on books, platforms, data feeds, and systems, and honestly, I was close to giving up – thinking maybe I just wasn’t smart enough to figure this out. But after applying the Trade The Volume Wave Method for just three months, I’ve seen more consistent results than ever before. Most importantly, I now have confidence in what I’m learning and why it works. Even when I make mistakes, I can clearly understand the “why” behind them, which helps me improve instead of repeating them. On top of that, your generosity in offering a two-hour training session to help us get started, as well as the supportive Discord community where we can share and discuss trades, shows how much you care about helping retail traders like me. Thank you, Panagiotis (Takis), for giving us peace of mind, hope, and a method that finally makes sense.

Mr_Corazon
74
Mr_Corazon 2024.03.10 09:28 

I read a book by David Weis and watched a video of his, from there I found this product which has been developed by Takis. He is passionate about what he has created and he is generous with his offering of expertise and more importantly he is generous with his time. It looks very complicated but its quite simple in essence and time spent with the creator and programmer himself was a pleasure. Thank you for everything so far Takis. And here is to a plentiful 2024

TruthMV
49
TruthMV 2023.06.03 00:23 

I just want to say thank for sharing your experience in putting together the "Weis Wave with Speedy Index Indicator". Using the Wyckoff Method, David Weis's Wave theory with Forex all in one. I would say it's not really a indicator, it's a way to read the charts for your self and not dependent on a line crosses this line or candle crossed a MA. I've been searching for many years trying to find some sort of logical process and common denominator in trading, I've spent thousands on all sort of esoteric books, platforms, data feeds etc. and was almost ready to quit, thinking I'm not smart enough to figure all this out. I've been applying the, "Trade The Volume Wave Method" for only three months, but I've had more consistent results and the confidence in what I'm learning will work. Even though I've made mistakes, now I know why and learn from them. Also, thanks for offering a two hour training session for free, for now, to get me up and running and the Discord Channel where we can discuss potential trades. Thank you Panagiotis (Takis) for giving all of us retail traders peace of mind and hope. Mark USA

推荐产品
Limitless MT5
Dmitriy Kashevich
Limitless MT5 is a universal indicator suitable for every beginner and experienced trader. works on all currency pairs, cryptocurrencies, raw stocks Limitless MT5 - already configured and does not require additional configuration And now the main thing Why Limitless MT5? 1 complete lack of redrawing 2 two years of testing by the best specialists in trading 3 the accuracy of correct signals exceeds 80% 4 performed well in trading during news releases Trading rules 1 buy signal - the ap
Seven fugures
Simanga Mkhwanazi
7FIGURES TREND — MT5 Trend & Signal Indicator See the trend. Read the market. Trade with greater clarity. 7FIGURES TREND is a professional MetaTrader 5 trend and signal indicator designed for traders who want a cleaner and simpler view of market direction without filling their charts with unnecessary technical information. The indicator performs its analysis in the background and presents the trader with clear information directly on the chart. WHAT 7FIGURES TREND SHOWS The system identifies the
RAD Real Acummulation and Distribution
Jose Alejandro Jacome Jimenez
RAD CRITICAL LEVES RAD indicator tracks “Relevant Volume” in real time, identifying accumulation and distribution processes, projecting them in the chart as SUPPORT or RESISTANCE zones. Natural   support   and resistance levels are generated by Volume Accumulation and Distribution processes. As these processes evolve, levels at which the relevant volume in the market place is positioned, become difficult areas to cross upwards or downwards. By using this information, traders can identify very s
Color Histogram Volume Set
Ricardo Almeida Branco
Do you use volume in your reading of the market? Certainly many traders use it, and do not imagine operating without it. The Color Histogram Volume Set indicator allows the user to choose the value that he considers interesting to monitor. When you pass this you will have visual confirmation and if you want you will also have the audible alert that is given by the indicator. Of course, there are other ways to try to find a high volume, such as assessing whether the volume is above av
HandleTrend
Kirill Subot
Trend indicator, a revolutionary unique solution for trend trading and filtering with all important trend features built into one tool! This is a 100% non-repainting multi-timeframe and multi-currency indicator that can be used on all currency pairs. HandleTrend is an effective trend following indicator that gives trend signals in the form of arrows on the chart.
The Plasma Trend indicator is a simple technical indication that is used to determine the current trend direction in the market. The Plasma Trend indicator is a powerful tool for determining the direction of the trend in the Forex market. It is based on both standard technical indicators and proprietary mathematical calculations, which provides a more accurate and reliable trend determination. Its implementation in the form of lines of two colors simplifies the visual determination of a change
MarketMagnet
Kelly Adediran Raymond
Are you ready to take your trading journey to new heights? Look no further than MarketMagnet, this groundbreaking indicator designed to propel your trading success with excitement and accuracy. Powered by the convergence of Momentum and CCI (Commodity Channel Index), MarketMagnet equips traders with the ultimate tool to determine direction and entry prices for a wide range of recommended currency pairs and instruments. It is designed for traders seeking to scalp for a few pips on lower timeframe
RCE Pro
Renan Araujo Muniz
RCE Statistical Cycles PRO: Divergence & Market Reversal Indicator Stop guessing where the market will reverse and start trading with mathematical precision. RCE Statistical Cycles PRO is a premium analytical tool designed for professional traders who want to pinpoint structural market reversals before they happen. By combining Hidden RSI Divergences with a robust Statistical Cycle Engine, this indicator does the heavy lifting of market analysis, delivering clear visual signals directly on your
CyberTrade Matrix: Multi-Timeframe S&R Spectrum Institutional-Grade Multi-TF Trend Matrix & Dynamic Support/Resistance Shields for MT5 CyberTrade Matrix is a premium, high-performance technical indicator engineered for professional traders who require a bird's-eye view of market structures across multiple horizons simultaneously. Powered by a optimized multi-timeframe engine, this indicator combines an Institutional EMA Cross Matrix (14/26) with Dynamic Visual Support and Resistance Shields (H4/
RobotCopy
Olivier Metenier
Bonjour cette vente nous vous apportera rien elle a juste pour but de récupérer des fond d’un broker malhonnête je n’ai rien à vendre ni à promouvoir bon trade à tous et passez votre chemin. Je doit continuer d’écrire pour valider les 300 caractères mais vraiment n’attendez rien de ce système , un groupe de personne c’est fait arnaquer par un broker qui ne veut pas valider de retrait alors je vais récupérer les fond différents mêmes s’il faut s’assoir sur une jolie Com’ prise par Mql5
Forex Signal Confidence
Jhones Jorente Garcia
"This indicator was designed so that you don't trade against the trend, the price strength helps you have more confidence in your entries. Note: The indicator can be used on any currency pairs, don't worry if you don't have all the indicators it uses installed, it will be calculated from the indicators you already have on the platform.With an interface that changes color for buy (blue), sell (red), and neutral
FREE
GDS Renko Entry Helper - Free Renko Price Interaction Indicator for MetaTrader 5 GDS Renko Entry Helper is a free Renko price interaction indicator for MetaTrader 5. It helps traders highlight important areas where price reacts, slows down, returns to a zone or changes behavior around support and resistance. The tool is designed for manual Renko analysis. It does not generate buy or sell signals and does not tell the trader when to enter the market. Its purpose is to help focus attention on area
Wave X Pro AI Agents Indicator Wave X Pro is a signal-analysis indicator developed for MetaTrader 5 and designed for short-duration binary trading workflows. It operates on the M1 chart and presents directional signals with a five-minute evaluation period. The indicator combines several specialized analytical modules in one coordinated workflow. Each module examines a different aspect of price behavior before the system presents its final signal. Wave X Pro is an analytical tool. It does not exe
Manyal trading system, CovEchoTrend Robot, focuses on reliability and flexibility. By employing statistical analysis methods to study the relationships between the base indicator and market patterns, the system enables a deeper understanding of market processes. Intelligent pattern analysis: The application of statistical data processing helps identify key trend reversal points more accurately, signaling significant market shifts. Informed decision-making is based on the intersection of indicato
成交量分布多模式:按您自己的方式分析成交量,而不是按指标的方式。 大多数成交量分布指标将交易者限制在预定义的分析范围内。但市场并非按照固定的模式运行,所以你的分析也应该如此。 成交量分布多模式指标 让您可以完全自由地决定在何时何地以及如何分析成交量。无论您是研究市场结构、分析交易时段、监控更高时间框架的活动,还是追踪正在形成的竞价行情,该指标都会适应您的交易风格,而不是强迫您去适应它。 Volume Profile Multi-Mode 专为寻求直观工作流程的初学者和要求灵活性的专业人士而设计,它将四种强大的分析方法结合到一个高度交互式和可定制的交易工具中。 四种强大的分析模式 1.       灵活框: 在控制面板中将切换按钮设置为 “灵活框” ,然后点击“创建新的灵活框” 。只需在任何价格结构周围绘制一个矩形,指标即可立即在选定区域内生成成交量分布图。您可以随时移动、调整大小或删除该框,以便在分析发生变化时创建多个独立的分布图,从而同时比较不同的市场结构。 2.       固定范围 :将切换按钮设置为 “固定范围” ,然后单击 “创建新的固定范围” 。图表上会显示两条可移动的垂直
http://www.tradepositive.lat ALGO Smart Flow Structure Indicator The ALGO Smart Flow Structure Indicator is designed for serious traders who use objective Market structure. Forget noise and slow indicators; this tool provides you with a crystal-clear, unambiguous view of structural breakouts across all timeframes. Based on the rigorous rules of the ALGO Smart Flow methodology, the indicator filters out internal structure and only shows you the Major Structural Points (Swing Points) , ensuri
FREE
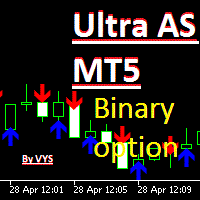
Ultra AS MT5
Yaroslav Varankin
3 (2)
The indicator is designed for binary options trading. The "period" parameter can be adjusted to fit your trading strategy, allowing you to customize the number and quality of signals. A red arrow pointing down indicates a sell signal, while a blue arrow pointing up indicates a buy signal. Recommended expiration time is one candle. You can enter a trade either when the signal appears or on the next candle. Attention: the signal may sometimes disappear on the current candle, so it's important to
CRT Confluence Pro
Jessica Victoria Huera Rodriguez
CRT Confluence Pro by TraderJess92 is a professional MetaTrader 5 indicator designed for traders who use the CRT methodology , institutional structure, liquidity sweeps, FVG, CISD and multi-timeframe analysis. The indicator helps identify high-confluence CRT setups through a clean visual sequence: HTF candles, TS / liquidity sweep, first CISD after the TS, FVG zones, Daily/Weekly Bias and DOL as the logical target of the setup . Main Features Displays HTF candles directly on the main chart. Aut
Professional Support & Resistance Signal Indicator v1.00 Identify key levels. Read market structure. Trade with greater clarity. Professional Support & Resistance Signal Indicator is a comprehensive MetaTrader 5 analysis tool designed for traders who want a clear, structured view of important market levels and potential trading opportunities. Instead of manually searching the chart for Support and Resistance, the indicator continuously analyzes price action using a proprietary multi-factor analy
The MACD Divergence Indicator is a powerful tool designed to identify Classical (Normal) Divergences on the MACD, which can signal potential market reversals or continuation trends. Divergences occur when the price and the indicator move in opposing directions, highlighting potential shifts in momentum. What is a Classical (Normal) Divergence? Classical Divergences are categorized into two main types: Bullish Divergence: Occurs when the price forms lower lows, but the MACD forms higher lows. Thi
Классификатор силы тренда. Показания на истории не меняет. Изменяется классификация только незакрытого бара. По идее подобен полной системе ASCTrend, сигнальный модуль которой, точнее его аппроксимация в несколько "урезанном" виде, есть в свободном доступе, а также в терминале как сигнальный индикатор SilverTrend . Точной копией системы ASCTrend не является. Работает на всех инструментах и всех временных диапазонах. Индикатор использует несколько некоррелируемых между собой алгоритмов для класси
HTB Throne Gold Scalper EA 是一款用于 XAUUSD(黄金)的自动化交易系统,运行于 M5 时间周期。 该系统根据预定义规则执行日内剥头皮交易,并采用受控的风险参数。 该 EA 通过分析市场结构和波动性条件来选择交易机会。 每一笔交易都是独立管理的。 系统不使用网格策略或马丁格尔交易方式。 风险管理 设置每日亏损限制,用于控制整体风险 交易活动会根据账户余额进行调整 新闻过滤器用于在高波动性事件期间减少交易 经纪商与账户要求 适用于 Raw Spread 或 ECN 类型账户 建议使用低点差和快速执行的交易环境 针对 XAUUSD 进行了优化 交易概况 交易品种 XAUUSD(黄金) 时间周期 M5 交易风格 日内剥头皮交易 交易周期 短期 风险模型 受控 策略类型 非网格,非马丁格尔 适合的用户 希望使用自动化交易并控制风险的交易者 避免使用马丁格尔策略的用户 专注于 XAUUSD 短期交易的交易者 偏好算法交易系统的用户 总结 HTB Throne Gold Scalper EA 是一款用于 XAUUSD 的自动化交易系统,支持以下功能: 日内剥头皮交易
Phantom Edge SMC
Nattapon Chuekamhod
Phantom Edge SMC — The Ultimate Smart Money Indicator for MT5 Tired of manually drawing structures while trading SMC or ICT concepts? Let Phantom Edge SMC do the heavy lifting for you. Key Features Internal & Swing Structure: Automatically detects BOS and CHoCH across two structural levels. Order Blocks (OB): Identifies Internal and Swing OBs with automated mitigation tracking. Equal Highs / Lows: Highlights EQH / EQL to pinpoint Liquidity pools. Fair Value Gaps (FVG): Displays FVGs with
Smart Trend Signal Indicator
Constantin-andrei Todirica
XAUUSD Smart Trend & Signal Indicator Trade smarter. Filter the noise. Catch the move. Take your Gold trading to the next level with a professional technical indicator designed to identify high-quality BUY and SELL opportunities while filtering market noise and weak setups. Built with XAUUSD (Gold) in mind, the indicator is especially suitable for scalping and intraday trading , including fast timeframes such as M1, M5 and M15 . Key Features BUY & SELL Signals Get clear visual BUY and SELL
Fibonnaci path profile Metatrader 5 indicator Overview Fibonacci Path Profile analyses historical ABC swing structures to show how price has developed after comparable retracements. It matches historical patterns with similar swing characteristics and displays the subsequent price paths as a distribution of possible outcomes. The indicator is designed to support scenario analysis for continuation, retracement, and reversal conditions. Its projections are historical comparisons, not fixed-price
Naked Forex Kangaroo Tail Indicator Kangaroo Tail Indicator is a pattern recognition indicator for Forex, Stocks, Indices, Futures, Commodities and Cryptos. The Kangaroo Tail is a multi-bar pattern. The Kangaroo Tail pattern is very effective and is very simple to trade. The strategy that comes with the Kangaroo Tail is based on price action. The indicator does what it was designed for: displaying Kangaroo Tail patterns.   Don't expect to follow the up and down arrows and make money . Tradin
PulseTrail Pro
Andrei Bogdanov
PulseTrail Pro is an all-in-one trend indicator for MetaTrader 5. It combines an adaptive ATR trailing line, a colored tick-volume histogram, an automatic position tool with three take-profit levels, and a multi-timeframe dashboard with four oscillators. HOW IT WORKS The indicator builds a trailing level around an EMA: EMA ± ATR × multiplier. The level moves only in the direction of the current trend. When the bar closes beyond it, the trend flips and a Buy or Sell arrow appears on the chart.
Magicxx
Hasan Abdulhussein
The indicator places a buy or sell signal when the conditions of the strategy it was designed with are met. The strategy is guaranteed, strong, and has been tested for 9 years. The indicator is for binary options and can be converted into a bot by linking it to MT2Trading, where it sends the signal to this platform. This platform automatically opens a trade on the trading platform you are using, whether it is Pocket Option, IQ Option, or any other binary options platforms. The entry is on the ne
AlphaSeekingBull5
Thendo Evans Sithagu
Introducing the Ultimate Trend-Following Indicator: Precision Signals at Your Fingertips In a market saturated with "black-box" systems and cluttered, confusing charts, clarity is the ultimate advantage. Alpha Seeking Bull strips away the noise, distilling complex market analysis into a single, high-fidelity visual cue. Whether you are a seasoned day trader or just starting your journey, this indicator is engineered to provide the confidence you need to execute trades with surgical precision. Th
该产品的买家也购买
ARIPoint
Temirlan Kdyrkhan
1 (4)
ARIPoint is a powerful trading companion designed to generate high-probability entry signals with dynamic TP/SL/DP levels based on volatility. Built-in performance tracking shows win/loss stats, PP1/PP2 hits, and success rates all updated live. Key Features: Buy/Sell signals with adaptive volatility bands Real-time TP/SL/DP levels based on ATR Built-in MA Filter with optional ATR/StdDev volatility Performance stats panel (Success, Profit/Loss, PP1/PP2) Alerts via popup, sound, push, or email Cu
Boba Analysis Suite Boba Analysis Suite 是一款适用于 MetaTrader 5 的分析指标。它将市场结构、关键价格区域和整体市场背景整合到同一图表视图中。 该指标源于交易及交易教学的实践经验,旨在帮助用户建立有条理的分析流程:评估市场方向、识别重要价位,并结合多个时间周期进行分析。 结合市场背景进行分析 单个信号的意义取决于市场背景。Boba Analysis Suite 帮助用户将当前图表状况与更大范围的市场结构相结合,并根据预先制定的规则评估交易思路。 分析功能包括: **趋势与市场结构:**评估市场方向及相关结构背景。 **关键价格区域与价位:**在图表上直观标示值得进一步分析的重要区域。 **多时间周期:**整合不同时间周期的信息,评估整体市场背景。 **可视化分析流程:**直接在图表上查看分析信息。 自主做出交易决策 Boba Analysis Suite 适合希望系统分析图表并结合多个时间周期信息的交易者。 该指标用于辅助分析,不会开仓或平仓,也不能替代交易策略或风险管理。每一笔交易的决策均由用户自行做出。 使用与许可 平台:Meta
ARICoins
Temirlan Kdyrkhan
ARICoin is a powerful trading companion designed to generate high-probability entry signals with dynamic TP/SL/DP levels based on volatility. Built-in performance tracking shows win/loss stats, PP1/PP2 hits, and success rates all updated live. Key Features: Buy/Sell signals with adaptive volatility bands Real-time TP/SL/DP levels based on ATR Built-in MA Filter with optional ATR/StdDev volatility Performance stats panel (Success, Profit/Loss, PP1/PP2) Alerts via popup, sound, push, or email Cust
Meravith Scanner
Ivan Stefanov
5 (3)
MERAVITH SCANNER 是一款适用于 MetaTrader 5 的专业金融市场指标,将多种分析工具整合为一个统一的系统。它基于专有的成交量加权平均价格(VWAP)方法自动完成所有计算,完全消除主观判断。 该指标适用于所有资产类别(外汇、股票、指数、大宗商品、加密货币)以及从 M1 到 Monthly 的所有时间周期。其核心原理是价格跟随成交量。MERAVITH 识别机构资金成交量的集中区域,并从该集中区域中推导出数学上精确的价格水平。它不预测,不推测。它只计算。 使用 MERAVITH SCANNER,您可以在 2–3 分钟内扫描全部 28 个主要外汇货币对的所有时间周期。您也可以扫描任何您选择的市场——例如,大约 100 只股票约需 10 分钟。 该指标计算耗尽水平、平衡线、偏差、统计水平以及目标投射。 图表元素 Origin Point 标记所有计算的起始位置。指标会自动将其放置在最佳位置。红色标签(TOP)表示市场高点并带有看跌倾向。绿色标签(BOTTOM)表示市场低点并带有看涨倾向。 Sentiment Line 是一条动态曲线,反映基于成交量加权计算得出的市场情绪。
一句话理解 这是一个 二合一的智能指示器 ——把 RSI 和 MACD 两位“专家”的意见打包成一个简单的结论:出现箭头,就行动;没有箭头,就等待。 而且箭头 不会重绘 ,收盘后是什么样,永远就是什么样。 它解决了什么问题 很多交易者同时看 RSI(判断动量和超买超卖)和 MACD(判断趋势方向),但两者经常给出矛盾信号。 这个指示器的做法是: 只有两人同时同意 ,才发出信号。这就过滤掉了大量假信号和模糊时段。 你实际看到的东西 独立的指示器窗口(不遮住 K 线图) 清晰的 买入箭头 和 卖出箭头 放大版的 MACD 柱状图(更容易看清动量变化) RSI 和 MACD 的线依然在,但你的注意力只需放在箭头上 谁适合用 新手 :不用学两个指标如何配合,跟着箭头做即可 老手 :节省时间,快速过滤噪音,且不重绘的特性让回测结果可信 所有讨厌信号闪烁的人 为什么它不重绘 因为它的判断逻辑基于 完整收盘后的价格数据 。信号只有在满足条件的那一刻才会固定下来,之后不会因为后续 K 线的变化而修改之前的箭头。 这意味着你可以放心做回测,也能在实盘中信任你看到的每一个信号。 底层特点(不复杂地说) 它
TrendMaestro5
Stefano Frisetti
note: this indicator is for METATRADER4, if you want the version for METATRADER5 this is the link:  https://www.mql5.com/it/market/product/108106 TRENDMAESTRO ver 2.5 TRENDMAESTRO recognizes a new TREND from the start, he never makes mistakes. The certainty of identifying a new TREND is priceless. DESCRIPTION TRENDMAESTRO identifies a new TREND in the bud, this indicator examines the volatility, volumes and momentum to identify the moment in which there is an explosion of one or more of these da
Meravith MT5
Ivan Stefanov
5 (3)
MERAVITH 是一款适用于 MetaTrader 5 的多周期成交量与流动性指标,它在每一个时间周期上显示趋势、支撑与阻力区域、入场、目标和止损。它为您提供完整的市场流动性地图,一个对冲基金风格的流动性工具,并用专有的成交量加权平均价格方法自动完成全部计算,因此没有主观解读。 适用于外汇、黄金(XAUUSD)、指数和加密货币,适用于所有时间周期。 购买后赠送:一套关于如何用 MERAVITH 交易的视频课程。购买后请给我发消息。 MERAVITH 的功能 分析所有时间周期,并显示每个周期上正在生效的趋势。 标记流动性区域(Volume Equilibrium),即多头与空头成交量相等的位置。 将所有时间周期的流动性水平直接显示在您的图表上。 写出市场的文字分析供您参考。 根据当前趋势计算入场、目标、支撑位和止损。 计算您交易的风险回报比。 按您的账户余额计算仓位大小,并估算潜在利润。 在市场出现重要变化时提醒您:警报、电子邮件和推送到手机的通知。 主要线条 Bullish / Bearish Volume Exhaustion 线:目标位。 趋势线:随趋势改变颜色(多头或空头),显
Cycles Plotter
Edoardo Centorame
Cycles Plotter 带移动平均线和开始日期的可自定义周期指标 Cycles Plotter 是一种高级技术指标,可根据用户输入绘制两个完全可自定义的正弦周期。它不会自动生成周期:所有周期都完全根据用户设置的参数计算,为交易者提供一种视觉工具,用于研究价格波动和潜在的趋势变化,而不产生自动信号或预测。 关键点: 用户定义的周期:周期 1 P1 和 2 P2 完全由用户配置。可以设置周期长度、幅度、移动平均线以及精确的开始日期和时间。如果用户未输入参数,则不会绘制任何周期。 幅度控制:每个周期可以具有不同的幅度,从而可以相对于参考移动平均线调整波动的高度。 趋势检测:快速和慢速移动平均线表示周期的方向: Fast MA 大于 Slow MA 上涨阶段 绿色 lime Fast MA 小于 Slow MA 下跌阶段 magenta 红色 Fast MA 约等于 Slow MA 横向阶段 flat 橙色 蓝色 周期绘图:每个周期有三条独立的线: 上涨阶段 绿色 lime 下跌阶段 magenta 红色 横向阶段 flat 橙色 蓝色 可自定义的开始日期和时间:可以定义每个周期开始绘制
AriX
Temirlan Kdyrkhan
1 (4)
AriX Indicator for MT5 A powerful trend-following and signal-evaluation tool AriX is a custom MT5 indicator that combines Moving Averages and ATR-based risk/reward logic to generate clear buy/sell signals. It visualizes dynamic SL/TP levels, evaluates past trade outcomes, and displays win/loss statistics in a clean on-chart panel. Key features include: Buy/Sell signals based on MA crossovers ATR-based SL/TP1/TP2/TP3 levels with visual lines and labels Signal outcome tracking with real-time stat
看清市场真正在做什么。   在您眼前实时观察三大市场阶段(收缩、扩张、趋势),并在趋势阶段的早期阶段抓住更优的入场点。   不要再猜测。开始像机构和聪明钱那样解读市场。   Apex Market Structure Pro(MT5 版)是一款精准的聪明钱分析工具,它剥离噪音,向您展示每根 K 线之下的真实结构:流动性、结构转变、吸   筹区域与趋势偏向,全部呈现在一个简洁、专业的图层中。专为厌倦了滞后指标、准备以清晰视角交易的严肃交易者打造。   重要提示:本指标专为 Heikin Ashi(平均足)K 线设计。使用前请将图表切换为 Heikin Ashi,以释放其全部威力。全部分析都围绕 Heikin   Ashi 的价格流构建。正是在这里,Apex Market Structure Pro 发挥出最佳表现。   交易者为何选择 Apex Market Structure Pro:   流动性,一览无遗: 瞬间看清止损池所在之处。卖方与买方流动性会被自动标注。实时关注尚未被扫的价位,捕捉价格攫取流动性并反转的精确时   刻。在聪明钱交易的地方交易。   会说话的结构:
FX-AIEA 供给需求区智能识别指标(Supply and Demand Indicators MT5)——技术原理与参数讨论 版本:2.51 | 适用平台:MetaTrader 5 引言 供给需求区是机构订单流的重要表现形式,相比传统支撑阻力位能更直接地反映买卖力量的失衡。本指标尝试通过算法自动识别高概率供需区域,以减少手动绘制的耗时与主观性。其核心逻辑基于自适应 ZigZag 算法,提取波峰波谷并生成区域标识 。 核心技术特点 全自动绘制机制 :基于改良版 ZigZag 动态提取有效极值,标记潜在供给区与需求区。指标遵循 MQL5 原生   prev_calculated   机制,在新 K 线生成时自动重绘,支持跨周期强制计算( Forced_TimeFrame   参数)。 区域边界模式 :支持宽带(覆盖K线影线极值)与窄带(仅覆盖实体)两种模式,用户可通过   use_narrow_bands   参数切换,以适应不同交易风格。 滤噪算法 :启用   kill_retouch   后,自动剔除被后续行情反复轻触但未有效突破的弱势区域,以提升信号有效性。 视觉与性能 :支持自
ORB Seeker MT5
Marcela Goncalves De Oliveira
特价促销,限量供应,保持产品稀缺性! 仅售 599 美元! 购买后请联系我以获取奖励的 ORB Seeker EA 和个人优化设置文件。 自信地捕捉干净利落的比赛片段! ORB Seeker MT5 是一款专业的开盘区间突破 (ORB) 指标,专为追求准确性、简洁性、灵活性和清晰图表结构的交易者而设计。 它能自动绘制任何交易品种的盘前或自定义交易时段区间,然后给出清晰的突破信号,包括入场点、止损点、止盈点以及可选的50%部分止盈位。所有数据均实时计算并直接显示在图表上。 您可以选择交易伦敦开盘、纽约交易时段、亚洲交易时段,或者自定义交易时段。ORB Seeker MT5 会自动适应您选择的交易时段,让您精准掌握市场波动范围、突破位和交易位。 每次购买均免费赠送 ORB Seeker EA 智能交易系统。该 EA 系统读取指标的突破信号并可自动下单,您可以选择手动交易,也可以让 EA 系统根据指标的信号逻辑自动处理入场。   为什么选择 ORB Seeker MT5 支持多个交易时段 - 您可以自行设置伦敦、纽约、亚洲或自定义交易时段的盘前交易时间和交易时段。 完整的突破视觉效果 -
Volume Arrow Signal Product Description Volume Arrow Signal is a smart trading indicator designed to help traders identify potential buy and sell opportunities using price action, volume behavior, and directional arrow signals. The indicator places clear arrows directly on the chart, making it easy to spot possible market reversals, trend continuations, and entry opportunities without spending hours analyzing charts manually. Whether you are trading Gold (XAUUSD) , Forex pairs, Indices, or Crypt
AriFocus
Temirlan Kdyrkhan
AriFocus - Non-Repainting Buy/Sell Signals AriFocus - one clear signal. AriFocus marks buy and sell signals directly on the chart and suggests a stop-loss level for each one. Every signal is confirmed on bar close and never repaints. - Buy/sell arrows, confirmed on bar close - Suggested stop-loss level for every signal - Trend band and candle coloring to show direction at a glance - 10 ready-made presets, or your own settings (14 calculation methods) - Pop-up, push and email alerts with entr
Transaction Speed MT5
Ivan Stefanov
5 (4)
当然,以下是翻译成中文(简体)的版本: 该指标标出市场中显现出 交易兴趣 的区域,并随后显示 订单积累区域 。它的工作方式类似于大规模的订单簿。 这是为 大资金 打造的指标,性能卓越。市场中有任何兴趣,你都能通过它清晰看到。 (这是一个 完全重写的自动化版本 —— 不再需要手动分析。) 交易速度 是一个全新的概念指标,它显示了市场上大订单 何时 、 何地 聚集,并揭示了其背后的意义。它可以在 非常早期 就检测到趋势的变化。 在外汇市场,所谓的“交易量”实际上是误导性的,因为那指的是价格在单位时间内的变化,因此真正的名称应是“交易速度”。 一切都取决于我们如何思考、如何行动、如何分析。 改变分析范式至关重要。 该指标完全重构了外汇市场上“交易量”的概念,用逻辑方式重新定义并应用,从而成为一个 独特而精准的工具 。 使用方法: 默认情况下,指标处于 自动模式 ,可独立用于任何时间周期。如果你希望切换到手动模式,只需点击 Auto / Manual Mode 按钮即可。 在 手动模式 下,所有计算从 2025年1月1日 开始。你可以根据需要更改该日期,以查看不同的分析结果。 最优数据周期
Zain Gold ScalpingV5
Ahmed Gamal Abdel Nasser Mohamed
Zain Gold Scalping V5 is a technical analysis indicator for MetaTrader 5 designed for Forex and Gold markets. It provides chart-based market information, trend analysis, signal conditions, and an on-screen dashboard to help traders analyze price movement across multiple timeframes. Main Features The indicator supports multiple timeframes, including M1, M5, M15, M30, H1 and higher timeframes. It can be used with Gold (XAUUSD), Forex currency pairs, indices and other supported instruments. The in
VTrende Pro
Andrii Diachenko
5 (1)
VTrende Pro - MTF indicator for trend trading with a display panel for MT5 *** Videos can be translated into any language using subtitles (video language - Russian) Although the signals of the VTrende Pro indicator can be used as signals of a full-fledged trading system, it is recommended to use them in conjunction with the Bill Williams TS. VTrende Pro is an extended version of the VTrende indicator. Difference between Pro version and VTrende: - Time zones - Signal V - signal 1-2 waves -    S
KenKem Master Volume Profiler - Brief Introduction A Display-only volume-profile cockpit for XAUUSD, BTCUSD and other liquid symbols. Draws profile structure, multi-timeframe flow, EMA trend and study-only setup markers. Places no orders. Not a signal service.  It maps where the market has actually traded and reads recent order flow, so you can see structure and lean at a glance.  What it shows: Master and local volume profiles (POC and value-area high/low) - the price shelves that matter. A liv
SMC Institutional Suite
Catur Cipto Nugroho
SMC Institutional Suite v3.7 Professional Smart Money Concept Indicator for MetaTrader 5 What is New in Version 3.7 - Visual Stability Update This release focuses entirely on one goal: making every zone, label, and line on your chart rock-solid stable. There is no more flickering, no more zones disappearing on a new candle, and no more duplicate drawings. Order Block (OB) zones no longer flicker or disappear. Once drawn, they stay permanently on the chart. Equal Highs and Equal Lows (EQH / EQL)
MasterTrend
Temirlan Kdyrkhan
MasterTrend Indicator for MT5 A powerful trend-following and signal-evaluation tool MasterTrend   is a custom MT5 indicator that combines Moving Averages and ATR-based risk/reward logic to generate clear buy/sell signals. It visualizes dynamic SL/TP levels, evaluates past trade outcomes, and displays win/loss statistics in a clean on-chart panel. Key features include: Buy/Sell signals based on MA crossovers ATR-based SL/TP1/TP2/TP3 levels with visual lines and labels Signal outcome tracking wit
Volality 75 Boom crash VIX
Cristofher Robles
4.5 (2)
Volatility 75 Boom Crash VIX Pro V2 Volatility 75 Boom Crash VIX Pro V2 is a high-performance trading indicator specifically engineered for Synthetic Indices (Deriv) and Forex . This tool focuses on identifying institutional liquidity zones and generating high-accuracy, non-repainting signals based on Price Action and Fibonacci levels. Key Advantages: No Repainting: Once a signal arrow appears and the candle closes, it will never move or disappear. Institutional Liquidity Zones: Automatically ca
SMC Sweep Fvg MT5
Daniil Sleptsov
5 (1)
SMC Sweep Fvg MT5 — 像聪明钱一样看市场,就在你的图表上 你一定有过这种感觉:价格扫掉你的止损,随后反转,并正好走到你预期的方向。方向你是对的,错的只是入场。 这个指标就是为了让这类情况少发生。它接手分析中最繁重的部分——图表标注,把真正重要的留给你:决策。 你会在图表上看到什么 市场结构 — 真实的结构高点与低点,带有 HH / HL / LH / LL 标记和水平线。趋势一目了然,无需猜测。 失衡区(FVG) — 价格推进过快、之后常会回补的区域。未回补与已回补的区域用不同颜色显示。 流动性行为 — 指标跟踪市场在反转前扫过关键水平的时刻。 现成的交易布局 — 入场箭头、止损位与盈利目标。全部画好,无需心算。 趋势过滤 — 更高周期的趋势线,帮你站在主趋势一侧。 指标关注流动性扫荡、失衡形成与结构状态——并只突出这些因素同时对齐的情形。 统计面板——回应每一个疑虑 你不必只听别人说。图表上的内置面板会按所选历史显示: 分析周期(K线数量); 检测到的情形总数; 多少到达目标、多少触及止损; 仍在运行中的数量; 以点数计的净结果。 切换品种——面板重
==================================================================== SMC Pro v6.1 APEX AI — XAUUSD Gold Empire MetaTrader 5 指标 · Smart Money Concepts · 预测智能引擎 ==================================================================== SMC Pro v6.1 APEX AI 是一套专业的 Smart Money Concepts 指标系统,专为 MetaTrader 5 上的 XAUUSD(黄金)打造。 它将完整的 SMC 框架——Order Blocks、Liquidity sweeps(流动性扫荡)、Fair Value Gaps、Break of Structure、Change of Character——与 8 个全新的 AI 驱动模块相结合,直接在图表上呈现精准的可视化信号、预测轨迹线、彩色的 SL/TP 风险回报框,以及三级自适应 TP Ladde
PrimeScalping
Temirlan Kdyrkhan
PrimeScalping is a powerful trading companion designed to generate high-probability entry signals with dynamic TP/SL/DP levels based on volatility. Built-in performance tracking shows win/loss stats, PP1/PP2 hits, and success rates — all updated live. Key Features: Buy/Sell signals with adaptive volatility bands Real-time TP/SL/DP levels based on ATR Built-in MA Filter with optional ATR/StdDev volatility Performance stats panel (Success, Profit/Loss, PP1/PP2) Alerts via popup, sound, push, or e
TraderHUD
Justino Porto Neto
5 (1)
TraderHUD v2 — 专业交易者的完整面板 TraderHUD v2 是 MetaTrader 5 最完整可视化指标的进化版本。它将交易者在图表上需要看到的所有信息整合到一个工具中,以做出更明智的决策:时间背景、美元强度、统计区间、枢轴点位、运动速度和宏观趋势——全部集成、可配置且不会使图表显得杂乱。 此版本基于实盘交易的实际使用经验构建,遵循明确的理念: 更多背景,更少噪音 。 v2 新增功能 将 8 个模块完全整合到单一指标中 可配置的侧边面板,DayRange 和 DollarFlow 自动衔接 市场时段标记与整点时间一起显示 经典枢轴点,可选择在各水平之间显示均线 两个标记为测试版的实验性模块:波动率和宏观趋势均线 完全可配置的布局——角落位置、宽度、颜色和字体 模块 计时器与点差 当前K线的倒计时,每500毫秒更新一次,不依赖于tick 计时器旁边显示实时点差 可配置的分隔符——计时器默认为"t",点差默认为"s" 智能锚定:当价格接近底部边缘时,文本会自动上移 整点时间与市场时段 垂直线指示下一个整点时间——新资金可能进入的时刻 带有时间和开盘时段名称的标
Pan PrizMA CD Phase
Aleksey Panfilov
The Expert Advisor and the video are attached in the Discussion tab . The robot applies only one order and strictly follows the signals to evaluate the indicator efficiency. Pan PrizMA CD Phase is an option based on the Pan PrizMA indicator. Details (in Russian). Averaging by a quadric-quartic polynomial increases the smoothness of lines, adds momentum and rhythm. Extrapolation by the sinusoid function near a constant allows adjusting the delay or lead of signals. The value of the phase - wave s
FFx Universal Strength Meter PRO is more than a basic strength meter. Instead of limiting the calculation to price, it can be based on any of the 19 integrated strength modes + 9 timeframes. With the FFx USM, you are able to define any period for any combination of timeframes. For example, you can set the dashboard for the last 10 candles for M15-H1-H4… Full flexibility! Very easy to interpret... It gives a great idea about which currency is weak and which is strong, so you can find the best pai
The FFx Universal MTF alerter shows on a single chart all the timeframes (M1 to Monthly) with their own status for the chosen indicator. 9 indicators mode (MACD-RSI-Stochastic-MA-ADX-Ichimoku-Candles-CCI-PSAR). Each can be applied multiple times on the same chart with different settings. Very easy to interpret. Confirm your BUY entries when most of the timeframes are showing green color. And confirm your SELL entries when most of the timeframes are showing red color. 2 Alert Options : input to s
FFx Watcher Pro MT5
Eric Venturi-Bloxs
The FFx Watcher PRO is a dashboard displaying on a single chart the current direction of up to 15 standard indicators and up to 21 timeframes. It has 2 different modes: Watcher mode: Multi Indicators User is able to select up to 15 indicators to be displayed User is able to select up to 21 timeframes to be displayed Watcher mode: Multi Pairs User is able to select any number of pairs/symbols User is able to select up to 21 timeframes to be displayed This mode uses one of the standard indicators
FFx Patterns Alerter gives trade suggestions with Entry, Target 1, Target 2 and StopLoss .... for any of the selected patterns (PinBar, Engulfing, InsideBar, OutsideBar) Below are the different options available: Multiple instances can be applied on the same chart to monitor different patterns Entry suggestion - pips to be added over the break for the entry 3 different options to calculate the SL - by pips, by ATR multiplier or at the pattern High/Low 3 different options to calculate the 2 TPs -
作者的更多信息
My Chart Generator
Trade The Volume Waves Single Member P.C.
What if your chart adapted to the market instead of the clock?   THE PROBLEM IT SOLVES   Instead of trying to find the best indicator that fits your timeframe chart, build a chart and find the most appropriate indicator.   My Chart Generator is a MetaTrader 5 background service that builds  live, fully historical three types of custom charts :1. Range/Volume Balanced chart, 2.  Range/Volume Absorption chart and 3. Constant Volume chart from any symbol — Forex pairs, crypto, indices, commodities,
Trend Lines MT5 with Alert
Trade The Volume Waves Single Member P.C.
Trend Lines Cross  This indicator will alert you on any cross of a Trendline. You can draw up to two trend lines and form a channel, a pennant , a triangle or a simple trend and when the price crosses either trend line the indicator  will provide you with alerts that you define plus an up or down arrow when the cross happened. How to:   Draw the 1st trendline and name it tl1.  Draw the 2nd trendline and name it tl2. Select which type of alerts you would like in the indicator properties and you a
FREE
TrendLines Cross with Alert
Trade The Volume Waves Single Member P.C.
4 (4)
Trend Lines Cross  This indicator will alert you on any cross of a Trendline. You can draw up to two trend lines and form a channel, a pennant , a triangle or a simple trend and when the price crosses either trend line the indicator  will provide you with alerts that you define plus an up or down arrow when the cross happened. How to:   Draw the 1st trendline and name it tl1.  Draw the 2nd trendline and name it tl2. Select which type of alerts you would like in the indicator properties and you a
FREE
My Chart Control
Trade The Volume Waves Single Member P.C.
Important: Do not download or install My Chart Control unless you already own My Chart Generator service. My Chart Control is not a standalone chart generator. It is designed to work together with the custom charts produced by My Chart Generator. Your Range/Volume chart, optimized for your indicator — automatically.   My Chart Control is the on-chart dashboard and intelligence interface for My Chart Generator. Attach it to your My Chart custom symbol chart and it gives you complete control over
FREE
Tick Chart Monitor
Trade The Volume Waves Single Member P.C.
DO NOT DOWNLOAD  UNLESS YOU OWN "Tick Chart - Constant Volume Generator EA" - This indicator acts as remote control of the specifc EA. The link for "Tick Chart - Constant Volume Generator EA" : https://www.mql5.com/en/market/product/171018 1. Tick Chart Monitor   1.1 What It Does The Monitor is an indicator that runs directly on the generated tick chart. It provides a graphical control panel that lets you change the EA’s style, volume, start date, or trigger a full rebuild — without touching the
FREE
Constant Volume Calculator MT5
Trade The Volume Waves Single Member P.C.
This is a free helper indicator for MT5 that will help traders setup their constant volume charts depending on their trading style. It will calculate the number of ticks that your constant volume chart should have depending on the following trading styles: Scalper Active Day trader Day trader Swing trader Position trader   Instruction video attached. Enjoy!
FREE
Constant Volume Calculator MT4
Trade The Volume Waves Single Member P.C.
This is a free helper indicator for MT4 that will help traders setup their constant volume charts depending on their trading style. It will calculate the number of ticks that your constant volume chart should have depending on the following trading styles: Scalper Active Day trader Day trader Swing trader Position trader   Instruction video attached. Enjoy!
FREE
RVH Monitor MT5
Trade The Volume Waves Single Member P.C.
This is an indicator to control the Parameters of Range Volume Hybrid Generator expert advisor -It does not work as stand alone, it works as a remote control of Range Volume Hybrid Generator and must be applied on the custom chart generated by the EA. To get Range Volume Hybrid Generator expert advisor:  https://www.mql5.com/en/market/product/165557 Parameters that can be adjusted: Trading Style as well as manual setting of Range, Volume and start Date of data collection. What's the video for 
FREE
Weis Wave with Alert
Trade The Volume Waves Single Member P.C.
4.82 (22)
Rental/Lifetime Package Options and Privileges' Rent Monthly Six Months   Yearly/Lifetime Weis Wave with Speed with Alert+Speed Index x x x Manual  x x x Quick Set up Video x x x Blog x x x Lifetime Updates x x x Setup and Training Material x x Rectangle Break Alert Tool      x Discord Access Channel "The SI traders" x   How to trade info visit:    http://www.tradethevolumewaves.com   ** If you purchase please contact me to setup your  : training Room and  complete manual access.  This is

No Demand No Supply
Trade The Volume Waves Single Member P.C.
4.5 (4)
This indicator identifies No Demand –No Supply candles  to your chart and plots volume bars colored according to the signal. It can be applied to all timeframes or to a specific one only. It can also be used as regular volume indicator but with exceptional future of WEIGHTED VOLUME. Furthermore is has an alert notification, sound and email when a signals occurs. The indicator does not repaint but the alert will come on two candles back due to the definition of No Demand No Supply. The VSA (Volum
Anchored VWAP with Alert
Trade The Volume Waves Single Member P.C.
5 (4)
What is the Volume Weighted Average Price (VWAP)? The volume weighted average price (VWAP) is a trading benchmark used by traders that gives the average price an instrument has traded at throughout the day, based on both volume and price.  It is important because it provides traders with insight into both the trend and value of the instrument. What is the Difference between VWAP and AVWAP? While VWAP is having as starting point the beggining of the day,week,month etc. in the AVWAP you can plac
Wave Anatomy
Trade The Volume Waves Single Member P.C.
5 (1)
Wave Anatomy Visit:   http://www.tradethevolumewaves.com   for more information Construct your own 5 Waves and analyze the price movements stages: Easy Movement Hard time to move Fast move This indicator is based on Wyckoff’s, David’s Weis and my Speed Index Theory. This indicator will you help analyze what is happening in 5 Price Waves that you can construct yourself. This tool is designed for scalpers and swing traders and will help them to analyze any wave on any timeframe at the same time.
No Demand No Supply MT5
Trade The Volume Waves Single Member P.C.
No Demand No Supply   This indicator identifies   No Demand –No Supply candles to your chart and plots volume bars colored according to the signal. It can be applied to all timeframes or to a specific one only. It can also be used as regular volume indicator  with exceptional future of WEIGHTED VOLUME. Furthermore is has an alert notification, sound and email when a signals occurs. The indicator does not repaint but the alert will come on two candles back due to the definition of No Demand No Su
Anchored VWAP with Alert MT5
Trade The Volume Waves Single Member P.C.
5 (1)
What is the Volume Weighted Average Price (VWAP)? The volume weighted average price (VWAP) is a trading benchmark used by traders that gives the average price an instrument has traded at throughout the day, based on both volume and price.  It is important because it provides traders with insight into both the trend and value of the instrument. What is the Difference between VWAP and AVWAP? While VWAP is having as starting point the beggining of the day,week,month etc. in the AVWAP you can pla
Wave Anatomy MT5
Trade The Volume Waves Single Member P.C.
Wave Anatomy Visit:  http://www.trafethevolumewaves.com  for more information Construct your own 5 Waves and analyze the price movements stages: Easy Movement Hard time to move Fast move This indicator is based on Wyckoff’s, David’s Weis and my Speed Index Theory. This indicator will you help analyze what is happening in 5 Price Waves that you can construct yourself. This tool is designed for scalpers and swing traders and will help them to analyze any wave on any timeframe at the same time. Fur
Range Volume Hybrid Generator
Trade The Volume Waves Single Member P.C.
1. Introduction Range Volume Hybrid (RVH) is a MetaTrader 5 Expert Advisor that creates custom chart symbols using a unique dual-condition bar formation method. Unlike traditional charts where bars close based on a single criterion (time, range, or volume), RVH bars close only when BOTH a minimum price range AND a minimum volume threshold are met simultaneously.  Download also and install RVH Monito r Indicator - to control the EA from the custom charts (it's Free)  https://www.mql5.com/en/marke
Tick Chart Constant Volume Generator
Trade The Volume Waves Single Member P.C.
1. Overview   The Tick Chart Toolset is a pair of tightly coupled MQL5 files that generate and control professional Constant Volume charts inside MetaTrader 5 as custom symbols. Unlike time-based charts, each bar closes only when a target volume threshold is reached, giving you a noise-filtered, activity-proportional view of the market. Free "Tick Chart Monitor Indicator" to control the generator EA:  https://www.mql5.com/en/market/product/17104   Component Type Role Tick_Chart_Generator_AI_MT5
筛选:
Elgoc Tech
42
Elgoc Tech 2025.10.02 19:37 

I would like to sincerely thank you for sharing your experience and putting together the Weis Wave with the Speedy Index Indicator. Combining the Wyckoff Method, David Weis’s Wave Theory, and Forex into one practical approach has been a breakthrough for me. To me, this is not just another “indicator” – it’s a way to truly read the charts for yourself, without relying on the usual signals like moving average crossovers or candle patterns. For years, I searched for a logical process and a common denominator in trading. I spent thousands of dollars on books, platforms, data feeds, and systems, and honestly, I was close to giving up – thinking maybe I just wasn’t smart enough to figure this out. But after applying the Trade The Volume Wave Method for just three months, I’ve seen more consistent results than ever before. Most importantly, I now have confidence in what I’m learning and why it works. Even when I make mistakes, I can clearly understand the “why” behind them, which helps me improve instead of repeating them. On top of that, your generosity in offering a two-hour training session to help us get started, as well as the supportive Discord community where we can share and discuss trades, shows how much you care about helping retail traders like me. Thank you, Panagiotis (Takis), for giving us peace of mind, hope, and a method that finally makes sense.

Trade The Volume Waves Single Member P.C.
7482
来自开发人员的回复 Panagiotis Diamantopoulos 2025.10.02 19:49
Thank you for kind words!
Mr_Corazon
74
Mr_Corazon 2024.03.10 09:28 

I read a book by David Weis and watched a video of his, from there I found this product which has been developed by Takis. He is passionate about what he has created and he is generous with his offering of expertise and more importantly he is generous with his time. It looks very complicated but its quite simple in essence and time spent with the creator and programmer himself was a pleasure. Thank you for everything so far Takis. And here is to a plentiful 2024

Trade The Volume Waves Single Member P.C.
7482
来自开发人员的回复 Panagiotis Diamantopoulos 2024.03.10 09:39
Thank you for your honest review and kind words.
TruthMV
49
TruthMV 2023.06.03 00:23 

I just want to say thank for sharing your experience in putting together the "Weis Wave with Speedy Index Indicator". Using the Wyckoff Method, David Weis's Wave theory with Forex all in one. I would say it's not really a indicator, it's a way to read the charts for your self and not dependent on a line crosses this line or candle crossed a MA. I've been searching for many years trying to find some sort of logical process and common denominator in trading, I've spent thousands on all sort of esoteric books, platforms, data feeds etc. and was almost ready to quit, thinking I'm not smart enough to figure all this out. I've been applying the, "Trade The Volume Wave Method" for only three months, but I've had more consistent results and the confidence in what I'm learning will work. Even though I've made mistakes, now I know why and learn from them. Also, thanks for offering a two hour training session for free, for now, to get me up and running and the Discord Channel where we can discuss potential trades. Thank you Panagiotis (Takis) for giving all of us retail traders peace of mind and hope. Mark USA

Trade The Volume Waves Single Member P.C.
7482
来自开发人员的回复 Panagiotis Diamantopoulos 2023.06.03 06:12
Thank you for your kind words Mark.
mistaeff
159
mistaeff 2023.01.05 22:15 

Throughout my time using the MQL5 platform, I have never come across anyone who is more devoted to the success of their customers. The developer is a great guy, he spends hours sharing his knowledge and is a successful professional trader in his own right. He has developed a personal trading system, along with a pretty unique indicator that will enable you to consistently profit in the forex markets. I would highly recommend this product, whether you are starting a brand new strategy or even adding additional verifications to an existing strategy.

Trade The Volume Waves Single Member P.C.
7482
来自开发人员的回复 Panagiotis Diamantopoulos 2023.01.05 22:18
Thank you for your honest review!
Mark Renier
33
Mark Renier 2022.11.27 07:57 

I wanted to have Weis wave indicator in my charts and I decided for this indicator because additional features that it offers. Actually I changed the platform just to get Weis wave indicator and I decided for MT5. MT5 has its flaws, so I would rather recommend others to choose MT4 if they have to made the same decision. Support for this indicator is exelent. Takis is always available for help and he is answering any questions. And personal private teaching from Takis is also very valuable. Beside that you get access to private discord group where trade opportunites are shared and also other discussions regarding Weis wave. I would like to thank Takis for his help and support.

Trade The Volume Waves Single Member P.C.
7482
来自开发人员的回复 Panagiotis Diamantopoulos 2022.11.27 09:54
Thank you Mark.
baszim
240
baszim 2022.06.21 17:22 

For me this was a Ahaa moment. The indicator helped me understand Wyckoff methodology in a better way. It provides you most of the times a early warning signal when analysing trading ranges on 1hr timeframe. The plutus signals are kickoff from phase D, the jump across the creek or the fall through the ice. Accompanied with the two hours teaching of Takis, his rectangle warning tool and the Discord group, you have another set of tools that gives you a better reward percentage in you trading. Make no mistake, this isn't a set and forget indicator with a signal! You have to read the background of the chart yourself and validate the signals and or tune the indicator sensitivity. This must be done for each currency pair. That takes practice and patients and time. Thanks for the tools Takis and the ongoing support and sharing on Discord!

Trade The Volume Waves Single Member P.C.
7482
来自开发人员的回复 Panagiotis Diamantopoulos 2022.06.21 17:58
Thank you for your review Bas. It is worth noting what you mentioned about this not being a signal indicator, if it was that easy I would have created a robot trading but markets change and you need to be able to read them and adjust accordingly. This is a tool that will help read the market and understand Wyckoff better as you already mentioned. Thanks again for the review!
Sh_Mikhail
236
Sh_Mikhail 2022.01.31 08:21 

Very pleased with the purchase. The two hours training with Takis are extremely valuable, and it does not stop at that. He is using a community App to share a lot of tips and to explain the rational behind some of the trades he takes. That means we are getting continuous education to improve our skills using the indicator. He also shares signals with us which he does not have to do. Highly recommended if you are serious about improving your manual trading. Thanks a lot Takis for all your efforts. Highly appreciated

Trade The Volume Waves Single Member P.C.
7482
来自开发人员的回复 Panagiotis Diamantopoulos 2022.01.31 08:25
Thank you for your kind words! Trying my best to educate retail traders because I have been there and know how it is. Thanks again.
Leguar
65
Leguar 2022.01.07 11:43 

The indicator is just the tip of the iceberg. The real value is the education you get for the price of the indicator. I highly recommend it and thank you!

Trade The Volume Waves Single Member P.C.
7482
来自开发人员的回复 Panagiotis Diamantopoulos 2022.01.07 13:45
Thank you Leguar. Exactly as you mention, the real value is the education behind it and it is worth much more than the indicator. Furthermore, I think it is worthwhile to mention that I am trading with the indicator myself, not just selling it. Thanks again.
Sumit Dubey
1794
Sumit Dubey 2021.12.13 05:09 

Excellent indicator and support. Best part is , knowledge to apply indicator and understand market move is free with indicator. Must say , price for education not indicator. Thanks a lot Mr. Panagiotis !

Trade The Volume Waves Single Member P.C.
7482
来自开发人员的回复 Panagiotis Diamantopoulos 2021.12.13 07:22
Thank you Sumit, I hope you make lots of pips with it.
Andre Gomes
2971
Andre Gomes 2021.10.14 20:30 

Excellent indicator and customer support. This tool really gives you an edge. Totally recommend it.

Trade The Volume Waves Single Member P.C.
7482
来自开发人员的回复 Panagiotis Diamantopoulos 2021.10.14 20:45
Thank you Andre!
Rutt Tungkiratichai
2898
Rutt Tungkiratichai 2021.09.13 05:43 

This is the price for education not only indicator.This indicator open new world for me.

Trade The Volume Waves Single Member P.C.
7482
来自开发人员的回复 Panagiotis Diamantopoulos 2021.09.13 06:54
Thank you Rutt!
adonis4ex
6375
adonis4ex 2021.07.29 11:49 

what can i say but, just an amazing product put forward by an aamazing guy. Panagiotis is so personable and really is looking to help you out as much as you are willnig to ask for help and work with him. i told him i wanted to learn everything i could and he is enthusiastic about teaching, im a former high level athlete and i call him my coach now, with his help and the help of this indicator i will master the foreign exchange market... just to bne clear i already am afull time trader and make my living doing it but i am never one to think i know everything adn i knew i wanted to take my trading to the next level, well this is definitely the next level. thank you my friend i lookk forward to us working together and making lots of money and happiness. anyone that is already doing well trading but kind of is still loking for that ultimate method or for that deper knowledge, this is the place

Trade The Volume Waves Single Member P.C.
7482
来自开发人员的回复 Panagiotis Diamantopoulos 2021.07.29 12:21
Thank you for your kind words Adonis4ex
satish vangipuram
33
satish vangipuram 2020.12.26 17:06 

this product and the methods taught by takis are geared towards practical trading purposes. there are not a lot of products out there about which this can be said. the personal mentoring and help by takis is high quality. he will work with you to develop a trading strategy. no bullshit. well worth the money.

SamitR
1541
SamitR 2020.06.23 00:13 

If there was a way I could give someone 100 stars , then this would be it !!!!! I have never had anyone like Panagiotis during all my time in the field of trading He literally held my hand and went through all the steps of how to use his fabulous indicators He is a true gentleman..God Bless

malmegrin
69
malmegrin 2019.12.04 18:27 

The Best Weis Wave indicator available!!!! Blazing fast and full of features. And the tech support is Awesome!!!!!! Thx a lot for the Work Mr. Panagiotis.

Eduardo Silva Vian
328
Eduardo Silva Vian 2019.11.30 05:00 

Excelente indicador. De todos weis wave, sem dúvida esse é o melhor. O speed index é muito efetivo para antecipar grandes movimentos, sem dúvida, o melhor indicador para rastrear o "smart money". Recomento. Um investimento que você não vai se arrepender.

Excellent indicator. Of all weis wave, no doubt this is the best. Speed index is very effective for anticipating large movements, arguably the best indicator for tracking smart money. I recommend it. An investment you will not regret.

Globex43
213
Globex43 2019.09.11 13:45 

Excellent!

回复评论