Yearly Levels Pro

3️⃣ 中文 (Chinese)

版本: 1.0
开发者: KOUAME N'DA LEMISSA
平台: MetaTrader 5 (MT5)
类型: 技术指标 / 年度价格水平

描述:
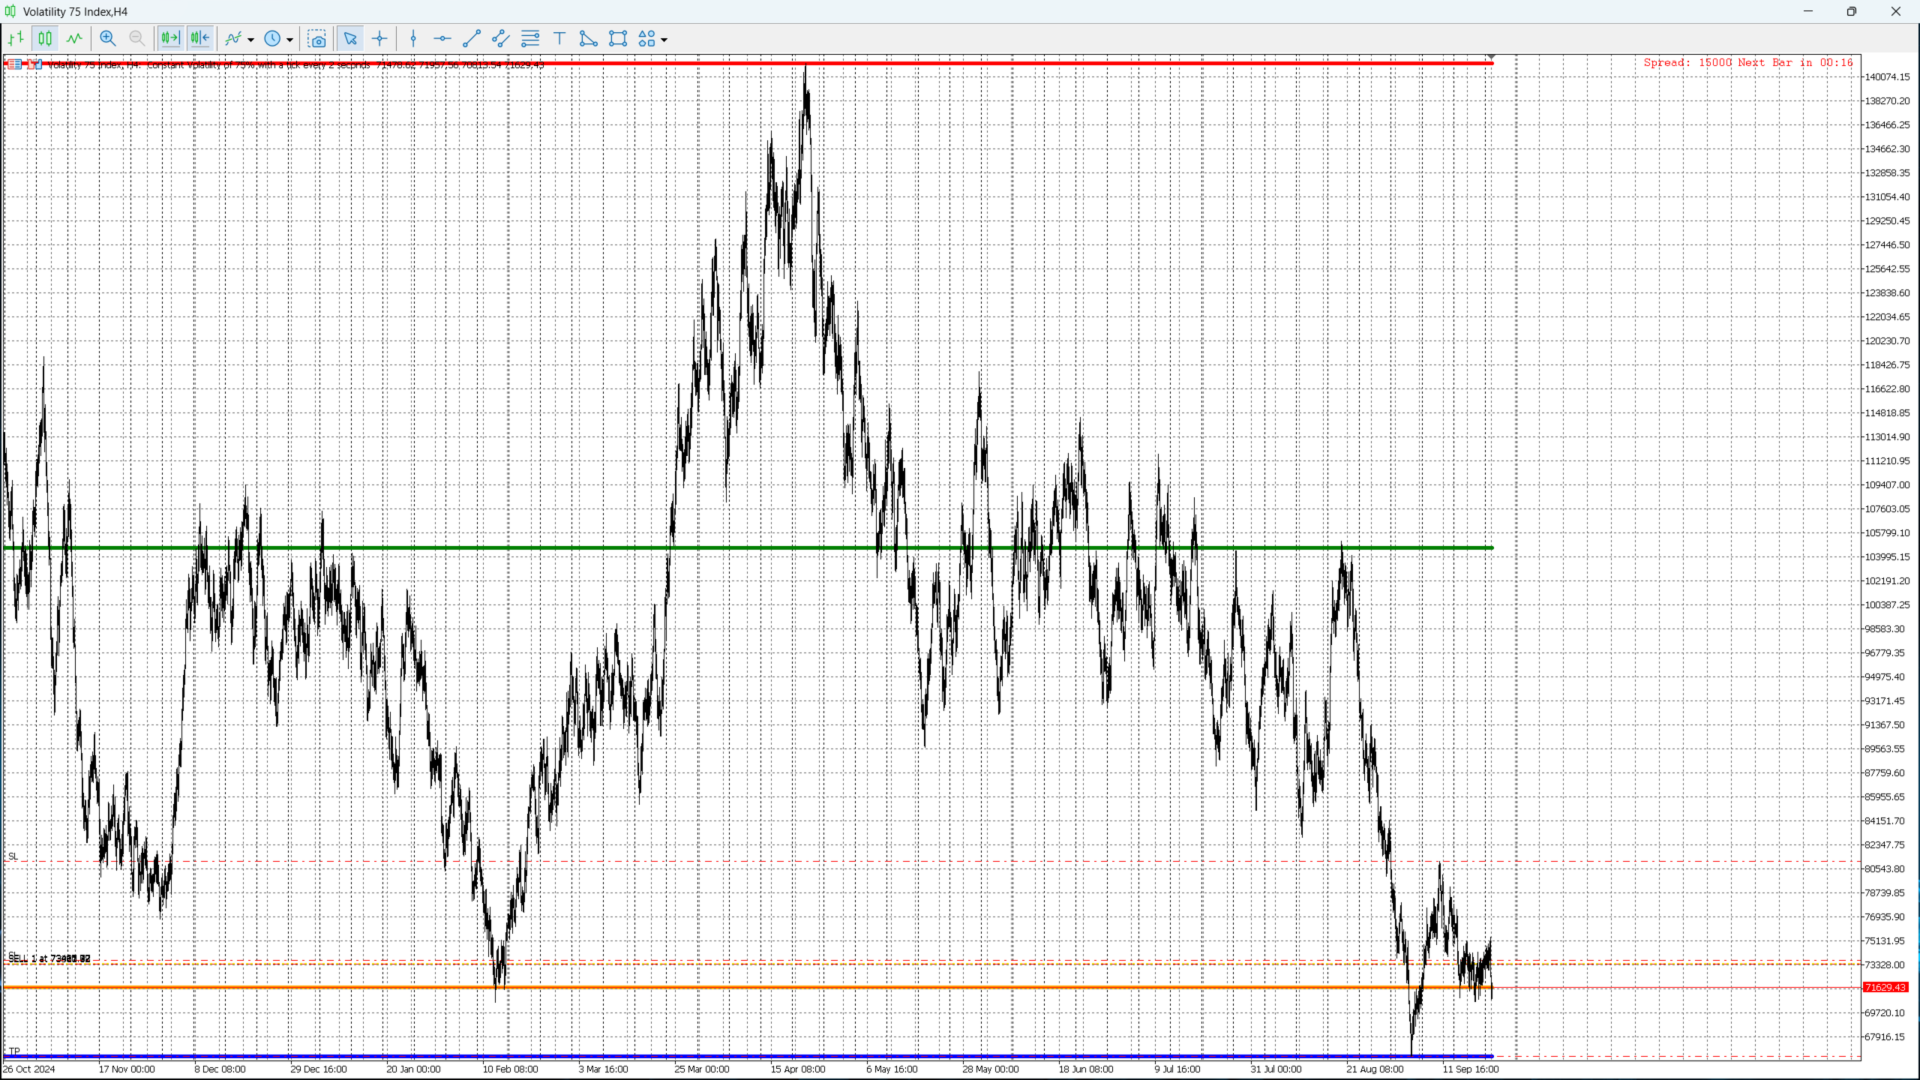
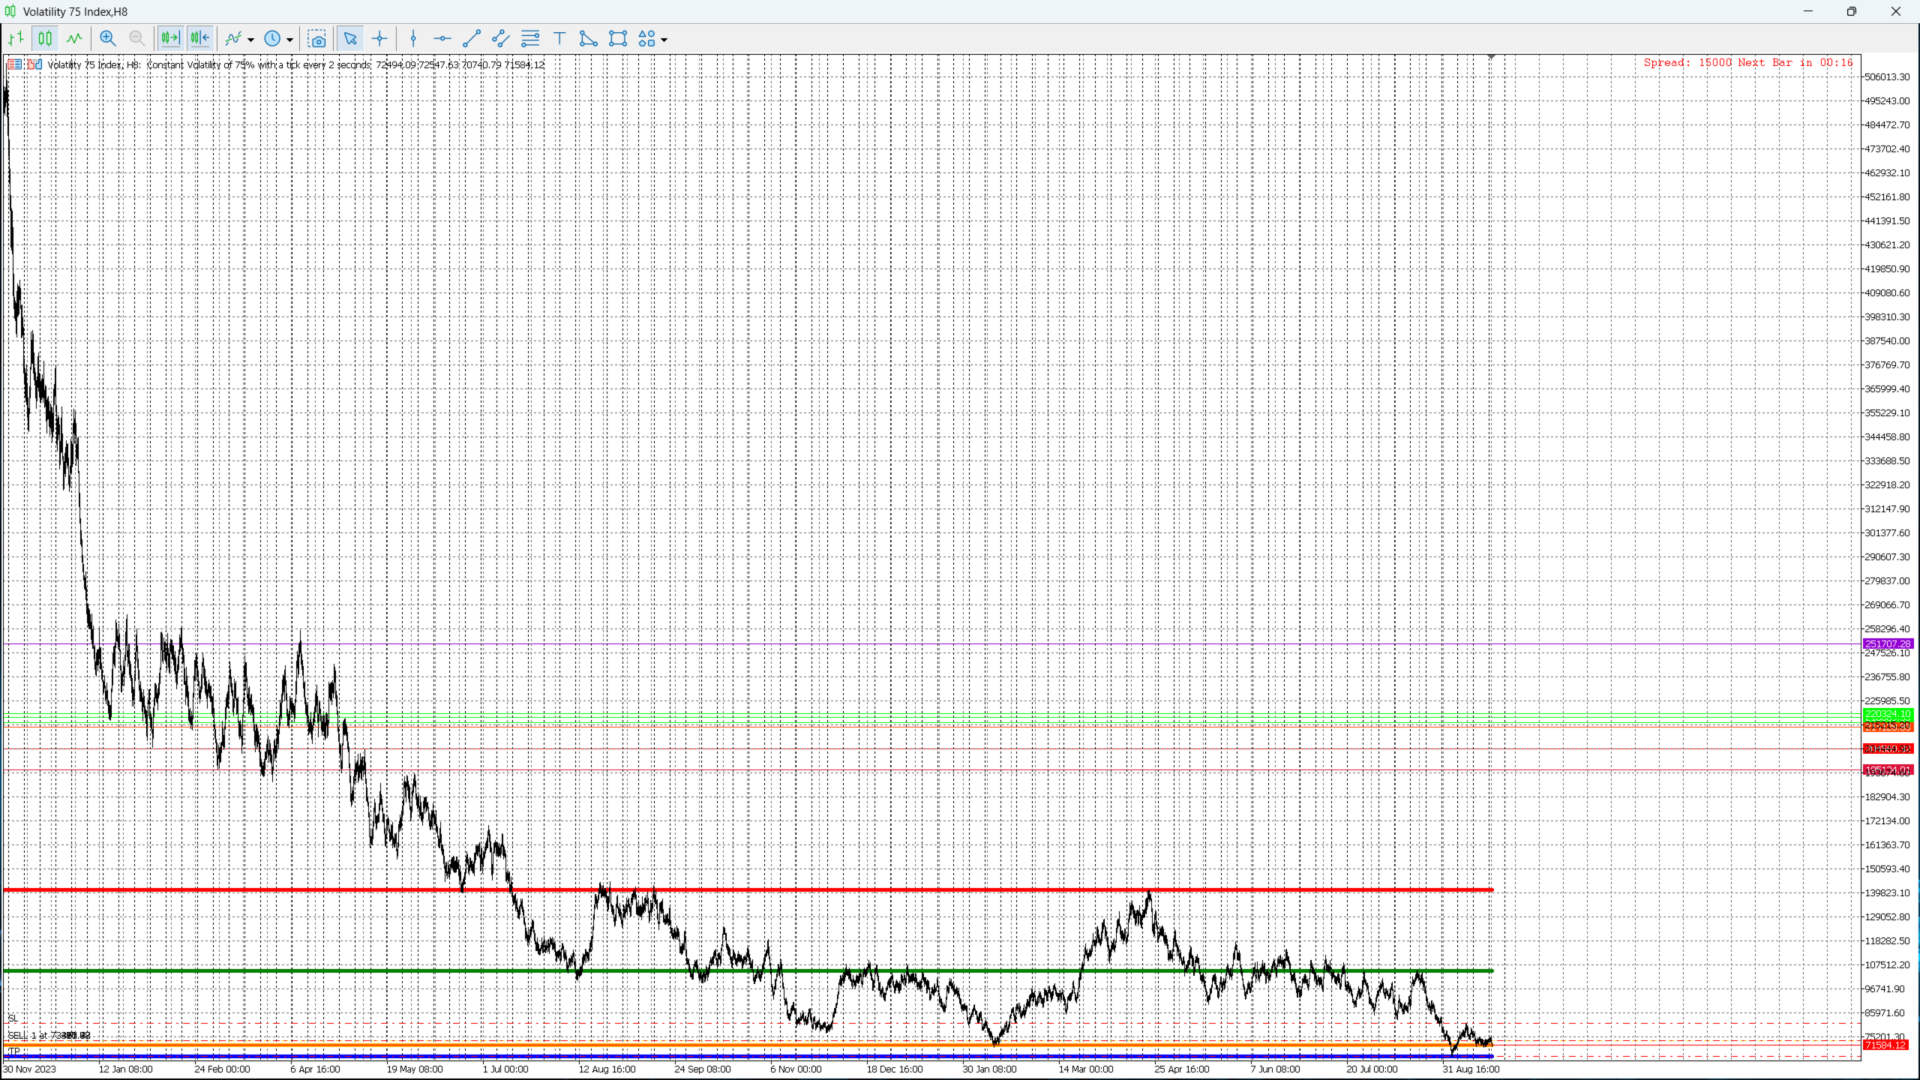
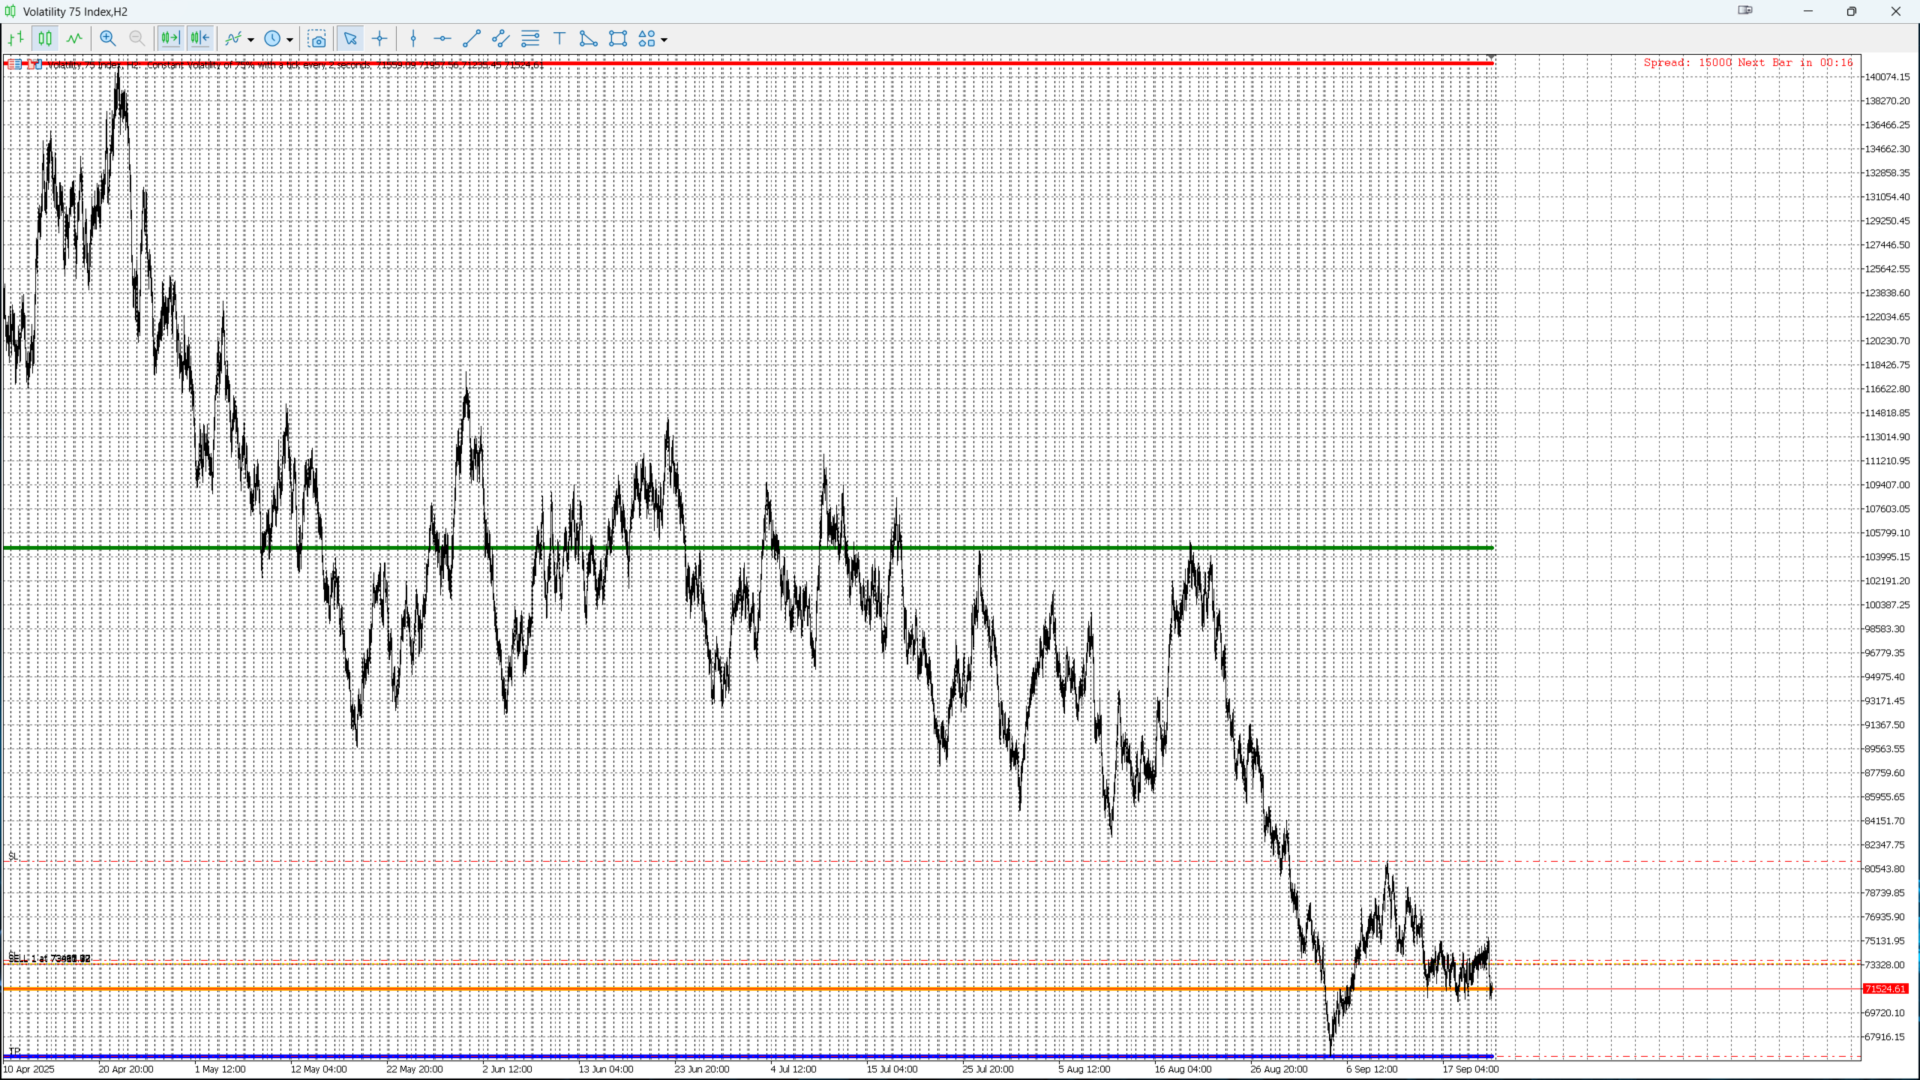
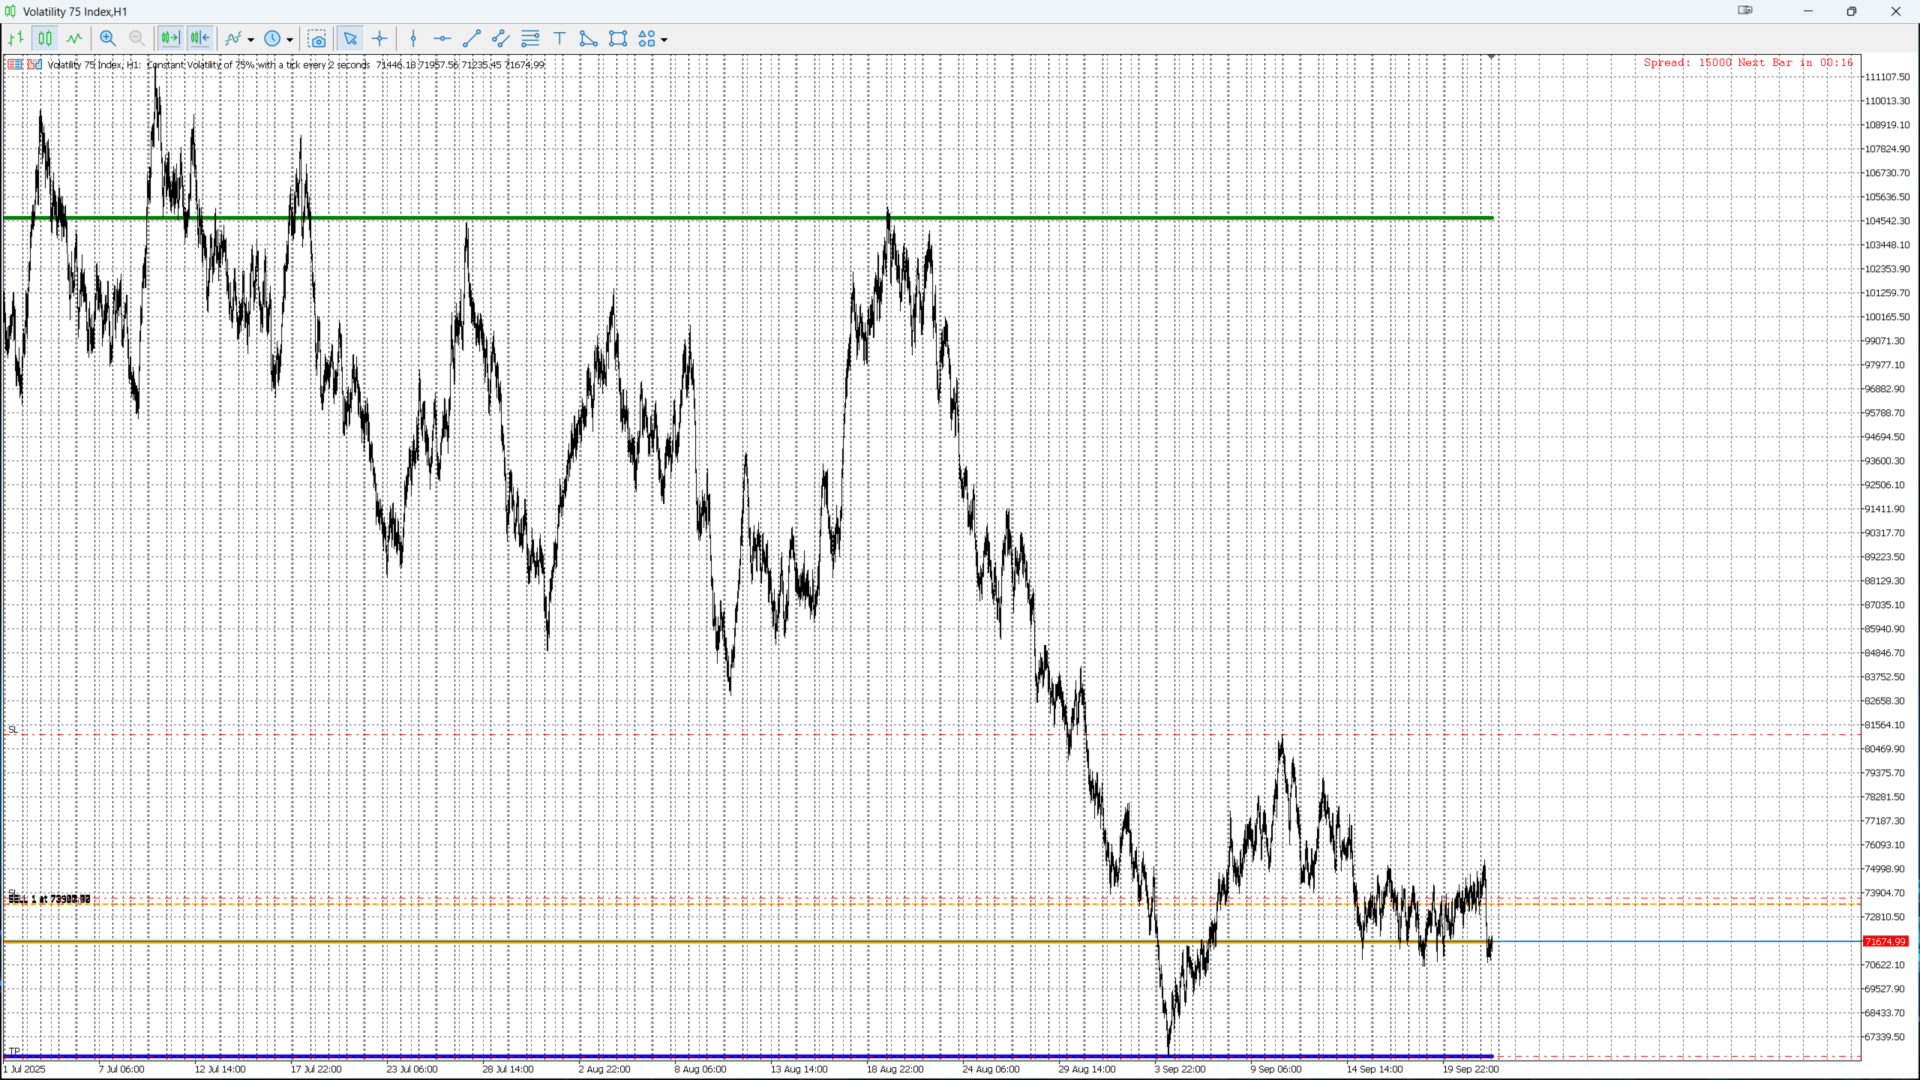
Yearly Levels Pro v1.0,由KOUAME N'DA LEMISSA开发,是一款强大的指标,可快速识别年度关键价格水平。它自动计算指定年份的开盘价、最高价、最低价和收盘价,并在图表上以彩色水平线显示。

主要功能:

  • High(红色)、Low(蓝色)、Open(绿色)、Close(橙色)

  • 通过 Year_Shift 选择年份

  • 支持所有交易品种和时间周期

  • 实时自动更新

参数:

  • Year_Shift : 0 = 当前年,1 = 上一年,依此类推

亮点:

  • 简单直观

  • 帮助识别年度支撑/阻力

  • 适合长期交易分析

使用建议:

  • 使用High/Low线识别支撑和阻力区域

  • 将当前价格与Open/Close比较,分析趋势

  • 可结合K线形态或其他指标确认信号


推荐产品
Manyal trading system, CovEchoTrend Robot, focuses on reliability and flexibility. By employing statistical analysis methods to study the relationships between the base indicator and market patterns, the system enables a deeper understanding of market processes. Intelligent pattern analysis: The application of statistical data processing helps identify key trend reversal points more accurately, signaling significant market shifts. Informed decision-making is based on the intersection of indicato
Visual Range Directional Force Indicator
AL MOOSAWI ABDULLAH JAFFER BAQER
Range Directional Force Indicator – Designed for You to Optimize! The Range Directional Force Indicator is a cutting-edge tool designed to empower traders by visualizing market dynamics and directional strength. Built to offer insights into market trends and reversals, this indicator is an invaluable asset for traders seeking precision in their strategies. However, it is important to note that this indicator is not optimized, leaving room for you to tailor it to your unique trading preferences.
SMC Venom 模型 BPR 指標是針對在智慧貨幣 (SMC) 概念內工作的交易者的專業工具。它會自動辨識價格圖表上的兩種關鍵模式: FVG (公平價值缺口)是三根蠟燭的組合,其中第一根和第三根蠟燭之間存在缺口。它在水平之間形成一個沒有成交量支撐的區域,這通常會導致價格調整。 BPR (平衡價格區間)是兩種 FVG 模式的組合,形成一個「橋樑」 - 當價格以低成交量活動移動時,突破並返回到水平的區域,從而在蠟燭之間產生間隙。 這些模式可協助交易者透過分析圖表上的交易量和價格動態(大型市場參與者和普通參與者之間的互動)來識別關鍵的支撐/阻力位、突破區域和切入點。 此指標以矩形和箭頭的形式可視化模式,也支援靈活的警報設定。 主要特點: 模式顯示模式:選擇顯示 BPR 模式(看漲和看跌)或 FVG 模式(看漲和看跌)。 可以隱藏所有圖表分析模式。 以條數過濾:BPR 結構中 FVG 之間的最小/最大距離。 訊號的附加視覺化: 箭頭有 9 種類型可供選擇(標準、細、分形等)或手動輸入 Wingdings 代碼,其表格可以選擇性地顯示在圖表上。 設定顏色、尺寸及其縮放時相對於價格的動態
General Description In the simplest terms this is a contrarian intra-day scalping system. Built to try and let correct trades run as far as possible and flip the trade when indicated. The indicator looks at historical daily trading ranges to lay out levels at which it takes long and short positions based on the statistical levels. The indicator is built around index futures, mainly around S&P and the DOW but can be used an any futures contract mainly using AMP Futures to trade. The indicator is
1.7*24小时全时在线,安全,可靠,低延时ping; 2.按券商要求智能跟单,详见英文简介   3.本系统仅提供跟单软件服务,不提供交易策略,不代单操作; 4.不限交易手数,客户自行设置A仓手机app端即可,不额外收费 5.客户可按月,季,年付费方式,不同方式,不同优惠,先付费后使用; 6.因券商MT5服务器异常,导致断网后跟单异常,客户需自行风控处理,本系统不提供风控处理 7.券商下单规则改变,会自动更新最新跟单系统 8.详细购买流程,请咨询  wehcat  :zfflyer; 9.再次强调,本系统,仅保障以技术层面实现跟单功能,不参与客户的下单,交易策略,以及风控措施。 10.本系统已稳定运行9个月,经历各种复杂行情考验,稳定,可靠
Delta Profile Volume
Teresinha Moraes Correia
指标技术说明 – Delta Profile for MetaTrader 5 Delta Profile 是为 MetaTrader 5 开发的一款指标,用于在指定的 K 线区间内对成交量流进行详细分析。它能够在不同的价格水平上对正向成交量(与上涨相关)和负向成交量(与下跌相关)的不平衡进行结构化和可视化展示。最终,用户可以清晰地识别图表中成交最为集中的区域,以及真实的市场不平衡形成的位置。 以下是该指标的主要技术特征与参数说明。 核心概念 指标会识别 价格水平 ,并将其分类为正向成交量、负向成交量,以及净 Delta(正负成交量的差值)。 每个价格水平会在图表中以 水平条形 显示,帮助用户直观观察市场活跃区和不平衡区域。 用户可自由控制 分析的 K 线数量 、 价格精度(小数位数) 、 显示的最大水平数量 以及 可视化样式 。 主要功能 价格水平映射 :根据设定的精度对价格进行四舍五入,并累计对应 K 线的成交量。 净 Delta 计算 :显示正负成交量的差值,提供每个价格区间的客观数值。 最强 Delta 水平突出显示 :自动识别 Delta 绝对值最大的价格水平,并用特殊颜色标
Sonic R Pro Enhanced
Huu Thuong Nguyen
Sonic R Pro Enhanced EA - 2025 版本 $249 仅限前5名购买者! 实时信号 查看 Sonic R Pro Enhanced 的实时表现: 交易策略 Sonic R Pro Enhanced 是经典 Sonic R 策略的升级版,通过 Dragon Band(EMA 34 和 EMA 89)进行自动化交易,并结合先进算法以提高盈利能力。 时间周期:M15, M30 支持货币对:XAUUSD, BTCUSD, AUDJPY, USDJPY 交易风格:回调交易 & 反趋势交易 最低资金要求:500 USD 杠杆比例:1:200 起 用户指南 设置:只需配置一个参数 - RiskAmount 如果 RiskAmount < 0:按账户余额的百分比计算风险 如果 RiskAmount > 0:每笔交易的固定风险金额 (USD) 示例: RiskAmount = -1 : 风险为账户余额的 1% RiskAmount = -2.5 : 风险为账户余额的 2.5% RiskAmount = 50 : 每笔交易固定风险 50 USD RiskAmou
Gioteen Volatility Index (GVI) - your ultimate solution to overcoming market unpredictability and maximizing trading opportunities. This revolutionary indicator helps you in lowering your losing trades due to choppy market movements. The GVI is designed to measure market volatility, providing you with valuable insights to identify the most favorable trading prospects. Its intuitive interface consists of a dynamic red line representing the volatility index, accompanied by blue line that indicate
MercariaPattern1-2-3 відстежує рух ціни, знаходить трьоххвильові структури 1-2-3 та підсвічує момент, коли сценарій підтверджується пробоєм ключового рівня. MercariaPattern1-2-3 tracks price movement, detects three-leg 1-2-3 structures and highlights the moment when the scenario is confirmed by a key level breakout. Індикатор збирає локальні свінги в компактну фігуру 0–1–2–3 , чекає підтвердженого пробою та будує стрілку входу з готовими рівнями SL/TP. The indicator combines local swings into a
Gold Crazy EA MT5
Nguyen Nghiem Duy
Gold Crazy EA   is an Expert Advisor designed specifically for trading Gold H1/ EU M15. It use some indicators to find the good Entry. And you can set SL or you can DCA if you want. It can be an Scalping or an Grid/ Martingale depend yours setting. This EA can Auto lot by Balance, set risk per trade. You also can set TP/ SL for earch trade or for basket of trade. - RSI_PERIOD - if = -1, then the default strategy works, if >0, then the RSI strategy works - MAX_ORDERS - to trade with only 1 order,
Gann Time–Price Square Cycles (MT5) This indicator applies the concept of time–price balance introduced by W.D. Gann. It detects price swings on the chart and projects Quarter, Half, and Full cycle time intervals forward, marking them with vertical lines. The tool is designed to help traders study the relationship between swing size and elapsed time directly on MT5 charts. Functions Detects swing highs and lows based on pivot depth and minimum swing size. Projects Quarter, Half, and Full harmon
TPO Profile MT5
Kyra Nickaline Watson-gordon
Definition : TPO is a Time Price Opportunity. Instead of using bars or candles with an Open, High, Low, and Close price, each "bar" in a Market Profile is represented by horizontal bars against the price It is called Market Profile terminology. In other words time-price-opportunity (TPO) profiles are histograms of how much time was spent at each price within the span of the profile. By using a TPO chart, you are able to analyze the amount of trading activity, based on time, for each price level
This indicator uses a mathematical calculation algorithm . This algorithm calculates the remainder between the updated model and the actual values and produces the possible progress of the graph on the graph. It is not a super prophet in trading, but it is very good for the trader when entering the market and to analyze it before entering. Applicable for all currencies. Данный индикатор использует алгоритм математических вычислений . Данный алгоритм вычисляет остаток между обновленной моделью и
Blahtech Market Profile MT5
Blahtech Limited
5 (10)
Was: $249  Now: $99   Market Profile defines a number of day types that can help the trader to determine market behaviour. A key feature is the Value Area, representing the range of price action where 70% of trading took place. Understanding the Value Area can give traders valuable insight into market direction and establish the higher odds trade. It is an excellent addition to any system you may be using. Inspired by Jim Dalton’s book “Mind Over Markets”, this indicator is designed to suit the
Manus Pro
Itumeleng Mohlouwa Kgotso Tladi
MANUS PRO EA The Trading Revolution You've Been Waiting For Are you TIRED of watching other traders make consistent profits while your account bleeds red?   The financial markets don't wait for anyone – and neither should you. MANUS PRO isn't just another Expert Advisor... it's your   TICKET TO FINANCIAL FREEDOM . Why MANUS PRO is Different (And Why Everyone's Talking About It) FOR BEGINNERS: Your Trading Mentor That Never Sleeps Zero Learning Curve   – Install, activate, and watch it wo
Before installing the HeatMap indicator make sure you are using a broker that gives you access to the Depth of market (DOM) !! This indicator creates a heatmap on your chart allowing you to see the buy or sell limit orders easily and in real time. You have the possibility to change the setting and the colors of the HeatMap in order to adapt to all markets and all charts. Here is an example of a setting you can use with the NASDAQ100 on the AMPGlobal broker :  https://www.youtube.com/watch?v=x0Y
Introduction to the Manual Backtesting Indicator on MQL5 The MetaTrader platform provides an excellent backtesting tool for evaluating Expert Advisors (EAs). However, when it comes to manually backtesting a strategy to assess its effectiveness, this tool has some limitations: You cannot manually draw zones or trend lines while in backtesting mode. You cannot switch timeframes to check time alignment. For example, if my strategy requires additional confirmation from a higher timeframe (HTF), this
FootprintOrderflow
Jingfeng Luo
5 (1)
Pro Footprint TPO  零门槛订单流足迹图分析系统, 重点还适配不提供市场深度(DOM)数据的普通经济商。 微观足迹图 (Footprint) :透视 K 线内部结构,通过热力图直观展示每一跳(Tick)的主动买卖量分布,精准定位筹码密集区。 失衡自动捕捉 (Imbalance) :自动识别并高亮显示**买卖失衡(Imbalance)**区域(如 300% 悬殊比率),这是机构扫单留下的最显著痕迹。 背离反转信号 :基于 Delta(净买卖差)与价格的背离逻辑,自动发出箭头信号,辅助捕捉精准的反转点 。 【适用场景】 裸K交易者寻找精准入场位。在外汇/CFD 市场进行剥头皮或短线交易。识别假突破与真反转。 最新更新支持加载直接绘制历史K线足迹图,可自由调节时间周期,调整加载参数。
Overview Heiken Ashi CE Filtered MT5 is a technical indicator for the MetaTrader 5 platform. It integrates smoothed candlestick charting with a dynamic exit strategy and a customizable trend filter to deliver clear buy and sell signals. The indicator is designed to improve trend detection and signal reliability by reducing market noise. If you want to see more high-quality products or order the development/conversion of your own products, visit my partners' website: 4xDev Get 10% OFF on manual
首先,值得强调的是,这个交易工具是非重绘、非重画和非滞后的指标,非常适合专业交易。 在线课程,用户手册和演示。 智能价格行动概念指标是一个非常强大的工具,既适用于新手,也适用于经验丰富的交易者。它将超过20个有用的指标合并到一个指标中,结合了高级交易思想,如内圈交易员分析和智能资金概念交易策略。该指标侧重于智能资金概念,提供有关大型机构交易方式的见解,帮助预测它们的动向。 它在流动性分析方面尤其擅长,有助于理解机构的交易方式。它擅长预测市场趋势,并仔细分析价格波动。通过将您的交易与机构策略对齐,您可以更准确地预测市场走向。该指标多才多艺,擅长分析市场结构,识别重要的订单区块,并识别各种模式。 它擅长识别BOS和CHoCH等模式,理解动量的转变,并突出显示供需强劲的关键区域。它还擅长发现强大的不平衡,并分析价格创造更高高点或更低低点的模式。如果您使用斐波那契回撤工具,该指标可以满足您的需求。它还可以识别相等的高点和低点,分析不同的时间框架,并通过仪表板显示数据。 对于使用更高级策略的交易者,该指标提供了工具,如公平价值差指标和优惠和折扣区域的识别。它特别关注高时间框架订单区块,并
Ultimate Boom and Crash 指标 Ultimate Boom and Crash 指标由 Coetsee Digital 开发,是一款先进工具,旨在识别市场中的潜在暴涨机会。该指标专为关注 Deriv 和 Weltrade 合成市场的交易者设计,仅在 3 分钟 (M3)、5 分钟 (M5)、15 分钟 (M15)、30 分钟 (M30) 和 1 小时 (H1) 时间周期上运行,并仅支持以下交易对:PainX 1200、PainX 999、PainX 800、PainX 600、PainX 400、GainX 1200、GainX 999、GainX 800、GainX 600、GainX 400、BreakX 600、BreakX 1200、BreakX 1800、SwitchX 600、SwitchX 1200、SwitchX 1800、Crash 1000 Index、Crash 900 Index、Crash 600 Index、Crash 500 Index、Crash 300 Index、Boom 1000 Index、Boom 900 Index、Bo
Maximum Trend Arrows OT MT5
Mulweli Valdaz Makulana
STRICTLY FOR BOOM INDEX ONLY!!!!! Here I bring the Maximum Trend Arrows OT1.0 MT5 indicator. This indicator is made up of a combination of different trend indicators for entries and exits, for entries an orange arrow will paint on the chart below the current market and a red flag for closing of trades and it produces buy arrows only. When the orange arrow appears, it will appear along with it's sound to notify you. The 1H timeframe is recommended, don't use it anywhere else than on the 1H timefr
Stormer RSI 2
Ricardo Rodrigues Lucca
This strategy was learned from Stormer to be used on B3. Basically, 15 minutes before closing the market, it will check RSI and decided if it will open an position. This strategy do not define a stop loss. If the take profit reach the entry price it will close at market the position. The same happens if the maximal number of days is reached. It is created to brazilian people, so all configuration are in portuguese. Sorry Activations allowed have been set to 50.
Antique Trend
Nadiya Mirosh
The Antique Trend Indicator is a revolutionary trend trading and filtering solution with all the important features of a trend tool built into one tool! The Antique Trend indicator is good for any trader, suitable for any trader both for Forex and binary options. There is no need to configure anything, everything has been perfected by time and experience, it works great during flats and trends. The Antique Trend indicator is a tool for technical analysis of financial markets, reflecting curren
CvdDeltaVolumes
Parasbhai N Patel
Delta + CVD & CVD Candles Order-flow indicator combining Delta (Ask–Bid), Cumulative Volume Delta (CVD), and a unique CVD-based synthetic candle system. Shows buy/sell pressure, volume aggressiveness, and momentum shifts with optional Delta histogram, CVD line, and CVD+Delta combined candles. Useful for scalping, intraday trading, divergence detection, and understanding buyer/seller dominance. Overview The Delta + CVD & CVD Candles Indicator combines multiple order-flow tools into one clean
##   ONLY GOLD ##   Тiльки Золото ## **Mercaria Professional Trading Zones - Complete Guide** ## **Mercaria Professional Trading Zones - Повний посібник** ### **How Mercaria Zones Work / Як працюють зони Mercaria** **English:** Mercaria Zones is an advanced trading indicator that identifies high-probability support and resistance areas using ZigZag extremes combined with mathematical zone calculations. The indicator works on multiple timeframes simultaneously, providing a comprehensive view
PZ Trend Trading MT5
PZ TRADING SLU
3.8 (5)
许多盈利交易者不仅知道如何识别市场趋势,而且也能把握趋势建立后的交易机会。 Pz 趋势交易 指标设计用来在趋势行情中尽可能的赚取利润。 已建立的趋势提供了一揽子交易机会,但大多数趋势交易指标完全忽视了它们,让交易者在趋势行情时完全不知道该如何做!一般趋势指标只通知有关的趋势变化,但根本不足以得到卓越的回报. Pz 趋势交易 指标比一般趋势指标显示多达 20 倍的交易 , 因为它注重所谓的市场时机。它不仅显示当前的市场趋势,也有回调,内柱线的突破和调整。它令您在趋势回调之后介入,安全的柱线内突破金字塔加仓,以及发现潜在的反转,和已知的调整。 趋势改变 一个趋势改变在市场方向变化时发生。趋势变化在图表上用带数字的彩色圆圈显示。蓝色 (1) 信号为上涨开始, 而红色 (1) 信号为下跌开始。趋势变化并非评估当前价格动作的结果, 它意味着交易设置是不定时地。如果您正确使用本指标, 在趋势变化时, 您将将已经入场 (参看下面的调整)。 回调 但凡趋势在运动中,行情上下抖动,盈利者收割利润,且其它参与者入场。趋势回调代表好的买入机会,通常是由主力获利离场导致。如果行情在回调后回归上行, 指标将
Noize Absorption Index
Ekaterina Saltykova
Noize Absorption Index - is the manual trading system that measures the difference of pressure between bears forces and bulls forces. Green line - is a noize free index that showing curent situation. Zero value of index shows totally choppy/flat market.Values above zero level shows how powerfull bullish wave is and values below zero measures bearish forces.Up arrow appears on bearish market when it's ready to reverse, dn arrow appears on weak bullish market, as a result of reverse expectation.
Introduction to Chart Pattern MT Chart Pattern MT is a chart pattern scanner to detect the triangle pattern, falling wedge pattern, rising wedge pattern, channel pattern and so on. Chart Pattern MT uses highly sophisticated chart pattern detection algorithm. However, we have designed it in the easy to use with intuitive user interface. Chart Pattern MT will show all the patterns in your chart in the most efficient format for your trading. You do not have to do tedious manual pattern detection an
该产品的买家也购买
AriX
Temirlan Kdyrkhan
1 (4)
AriX Indicator for MT5 A powerful trend-following and signal-evaluation tool AriX is a custom MT5 indicator that combines Moving Averages and ATR-based risk/reward logic to generate clear buy/sell signals. It visualizes dynamic SL/TP levels, evaluates past trade outcomes, and displays win/loss statistics in a clean on-chart panel. Key features include: Buy/Sell signals based on MA crossovers ATR-based SL/TP1/TP2/TP3 levels with visual lines and labels Signal outcome tracking with real-time stat
ARICoins
Temirlan Kdyrkhan
ARICoin is a powerful trading companion designed to generate high-probability entry signals with dynamic TP/SL/DP levels based on volatility. Built-in performance tracking shows win/loss stats, PP1/PP2 hits, and success rates all updated live. Key Features: Buy/Sell signals with adaptive volatility bands Real-time TP/SL/DP levels based on ATR Built-in MA Filter with optional ATR/StdDev volatility Performance stats panel (Success, Profit/Loss, PP1/PP2) Alerts via popup, sound, push, or email Cust
TrendMaestro5
Stefano Frisetti
note: this indicator is for METATRADER4, if you want the version for METATRADER5 this is the link:  https://www.mql5.com/it/market/product/108106 TRENDMAESTRO ver 2.5 TRENDMAESTRO recognizes a new TREND from the start, he never makes mistakes. The certainty of identifying a new TREND is priceless. DESCRIPTION TRENDMAESTRO identifies a new TREND in the bud, this indicator examines the volatility, volumes and momentum to identify the moment in which there is an explosion of one or more of these da
“ Dynamic Scalper System MT5 ”指标专为在趋势波内进行剥头皮交易而设计。 已在主要货币对和黄金上进行测试,并可与其他交易工具兼容。 提供顺势短线建仓信号,并提供额外的价格变动支持。 指标原理: 大箭头决定趋势方向。 在趋势波内,我们采用一种生成小箭头形式的剥头皮交易信号的算法。 红色箭头代表看涨方向,蓝色箭头代表看跌方向。 敏感的价格变动线会沿着趋势方向绘制,并与小箭头信号协同作用。 信号运作方式如下:当线在适当时刻出现时,将形成入场信号;在出现线时,持仓;线完成后,平仓。 建议的操作时间范围为M1 - H4。 箭头在当前K线上方形成,如果下一根K线已开仓,则不会重新绘制上一根K线上方的箭头。 输入参数 Trend Wave Period - 趋势方向(大箭头)的周期,改变趋势波的时间间隔。值 1 表示趋势方向的最长持续时间,参数值越大,持续时间越短。 Scalper Arrows Period - 信号箭头(小箭头)的计算周期,改变入场信号的生成频率。值 3 表示最频繁的生成频率,参数值越大,箭头频率越低,准确度越高。 这些参数可以根据不同
获取 免费 AUX 指标和 EA 支持   直接下载 — 点击这里 [ D.I.C.E ] The DICE Indicator   Divergence in Chaos Environment 是一款专为使用艾略特波浪理论并结合混沌交易技术的交易者设计的 MT5 专用工具。它识别价格行为中的隐藏和常规背离,并与比尔·威廉姆斯所描述的混沌市场环境同步。 主要特征 艾略特波浪背离检测:检测符合波浪结构的看涨和看跌背离,以提高波浪计数精度。 混沌技术集成:与混沌交易策略相结合,确保信号与 AO 指标和市场结构一致。 多时间框架扫描:跨不同时间框架分析背离以确认动能变化和趋势耗尽。 可视化警报和对象:图表中清晰的箭头、线条和标记,便于快速识别。 自适应市场读取:自动适应混沌市场条件,过滤噪音并保留有效信号。 突破回调入场技术:使用简单的斐波那契回撤和枢轴点的常见交易方法。 优势 结合背离信号与波浪进程,提高入场精度。 利用 AO 混沌背离逻辑确认可能的第 3–5 波完成。 提前识别反转或延续区域,降低风险。 实时自动发现修正区,低风险高回报。 通过清晰的视觉确认增强交易信心。
+++++++++++++++++++++++++++++++++++++++++++++++++++++++++++++++++++++++++++++++++++++++++++++++++ +++ Link to EURUSD Only Free Version -->  https://www.mql5.com/en/market/product/156904?source=Unknown +++++++++++++++++++++++++++++++++++++++++++++++++++++++++++++++++++++++++++++++++++++++++++++++++ Hallo Trader, This is a traditional GANN & FIBONACCI strategy based on detection of an impulsive move in the opposite direction. This is called a Breakout. At the moment of Breakout, the indicator draw
Frontier Pivots
Nestor Jose Mendez Boza
FRONTIER PIVOTS - Geometric Levels Indicator This indicator plots support and resistance levels/ranges on the chart using mathematical calculations. It helps traders identify potential price reaction zones based on geometric patterns. Main Features: Automatically calculates and displays key price levels Plots both support and resistance lines Uses daily price data for level calculation Clean visual presentation with different colors for different level types No repainting - levels remain static
Pantera Indicator
Temirlan Kdyrkhan
5 (1)
A tool for on-chart strategy backtesting and performance analysis. A utility for developing, debugging, and testing custom trading ideas and indicator functions. An indicator designed to quickly test trading concepts and visualize the effectiveness of different input parameters. An all-in-one sandbox for testing everything from simple crossovers to complex, multi-condition trading systems.
Weis Wave with Alert MT5
Trade The Volume Waves Single Member P.C.
4.94 (17)
Rental/Lifetime Package Options and Privileges  Rent Monthly Six Months   Yearly/Lifetime Weis Wave with Speed with Alert+Speed Index x x x Manual  x x x Quick Set up Video x x x Blog x x x Lifetime Updates x x x Setup and Training Material x x Discord Access Channel "The SI traders"          x Rectangle Break Alert Tool      x How to trade with it:    http://www.tradethevolumewaves.com   ** If you purchase please contact me to setup your  : Training Room and  complete manual access.  Wei
Hello I Want to introduce The Forex Buy Sell Arrow Premium MT5 i recently release this premium indicator! its 1000% Non Repaint Indicator, It Work Perfectly Well,, i tested it day by day, Just mind blowing Result,  Including Powerful trend Algorithm! How It Work? well, it work market trend formula, when trend Bullish Or when trend Bearish,  Recommend Timeframe M30, H1 it work all timeframe, and all currency pair, 100% non repaint, How to take signal From Forex Buy Sell Arrow Premium Ind
Big Player Range
Thalles Nascimento De Carvalho
5 (3)
BigPlayerRange — 适用于沪深300和美元人民币的最佳MT5指标 探索 BigPlayerRange 的强大功能,它被认为是用于 沪深300、上证指数、USD/CNH 等资产的 MetaTrader 5 最佳指标 。该工具能精准识别机构主力的关键区域,帮助交易者进行高精度的技术分析。 指标工作原理: BigPlayerRange 绘制两个水平区域,通过成交量分析反映市场能量: 绿色区域 :买方防守位置,支撑价格。 红色区域 :卖方压制位置,形成阻力。 使用策略: 收盘价突破绿色区域上方 :可能开启上涨趋势,目标为上方区间。 收盘价跌破红色区域下方 :暗示下跌压力增强,目标为下方支撑。 价格停留在区间内 :行情震荡,等待突破信号。 核心优势: 机构活动区域识别 :提前发现主力进出场信号。 自动计算的目标价格 :提供两个明确的止盈位置。 回调概率分析 :优化风险控制,提升稳定性。 参数个性化设置: 自定义交易时间与成交量类型(Tick或真实成交量)。 使用机构逻辑提升日内交易效率。 推荐搭配
Enigma 112
issam rahhal sabour
Enigma 112 Indicator - User Manual Enigma 112 Indicator Complete User Manual - Ultimate Trading Solution Introduction The Enigma 112 is a comprehensive multi-timeframe trading indicator that combines advanced technical analysis concepts including Tesla 3-6-9 Gates, Huddleston Theory, PO3 Dealing Ranges, and sophisticated risk management systems. Tesla 3-6-9 Gates Based on Nikola Tesla's vortex mathematics for precise support and resistance levels Huddleston Theory Volume-based market
VTrende Pro
Andrii Diachenko
5 (1)
VTrende Pro - MTF indicator for trend trading with a display panel for MT5 *** Videos can be translated into any language using subtitles (video language - Russian) Although the signals of the VTrende Pro indicator can be used as signals of a full-fledged trading system, it is recommended to use them in conjunction with the Bill Williams TS. VTrende Pro is an extended version of the VTrende indicator. Difference between Pro version and VTrende: - Time zones - Signal V - signal 1-2 waves -    S
Meravith MT5
Ivan Stefanov
该指标可从任意点分析成交量,并计算该成交量的市场衰竭水平。 Meravith 主线: 多头成交量衰竭线 – 用作目标。 空头成交量衰竭线 – 用作目标。 趋势线 – 指示市场趋势。颜色会根据市场是多头还是空头而变化,并作为趋势支撑。 使用方法: 双击紫色竖线,将其移动到所需位置。 您可以分析任何内容——趋势或修正。将指标移动到市场顶部、底部或您认为重要的任意位置。一个好的方法是将 Meravith 设置在市场位于衰竭线之间的位置;这样您将拥有明确的目标可追踪。 如果初始衰竭线被突破,将会出现新的衰竭线,形成额外的可交易通道。 当达到衰竭时,您可以重新定位指标或切换到不同的时间框架,以寻找新的衰竭水平。 趋势线与某一条成交量衰竭线之间的距离越大,该方向上的成交量就越高。趋势线可作为开仓位置,而衰竭线可用于获利了结。 Meravith 包含图表按钮,使操作更加简单快捷——所有核心功能都可以直接从图表中切换。每个按钮的功能如下: DEV – 显示相对于支撑线的双倍偏差,如果趋势内部成交量较高,它可以作为额外的支撑位。 95% – 绘制覆盖最近 20 根K线 95% 区间的曲线。如果价格突破该
Heikin Ashi with Pivot
Anna Russel Abanes
好的,这里是您的产品描述的中文翻译版本: 通过 ChartMaster Heikin Ashi with Pivot Indicator(图表大师平均K线枢轴指标) ,让您的交易迈上新台阶。这款强大的工具将 平均K线的清晰度 与 高级枢轴点分析 相结合,专为希望精准识别市场趋势、反转以及关键支撑/阻力区的交易者而设计。 主要功能: 平均K线可视化 – 平滑市场噪音,更清晰地识别趋势。 自动枢轴检测 – 在图表上用箭头标注潜在反转点。 买卖信号 – 绿色箭头提示潜在看涨枢轴,红色箭头提示看跌枢轴。 趋势确认 – 平均K线帮助过滤虚假信号,聚焦高概率交易。 多周期兼容 – 适用于所有周期(M1 至 MN1)。 用户友好界面 – 界面简洁、清晰,适合专业交易者和初学者。 无重绘信号 – 枢轴信号在K线收盘后保持不变,可靠可信。 帮助您的交易方式: 提前发现趋势延续或衰竭。 找到高概率的进场和出场点。 将趋势方向(平均K线)与枢轴反转信号结合,提升精准度。 适用于剥头皮、日内交易、波段交易和长期投资。 ️ 参数与自定义: 可调节的枢轴灵敏度。 可自定义
秒级Tick蜡烛图生成器 是一款专为高频交易和短线炒单设计的专业级MT5指标工具。它能够将原始Tick数据实时转换为高度可定制的秒级K线图,帮助交易者精准捕捉市场微观波动,优化入场和出场时机。该工具能为您提供清晰的图表展示,让您更直观地识别价格行为模式,提升交易决策效率。 核心功能亮点: 灵活的时间间隔设置:支持自定义秒级K线生成周期(如1秒、5秒、10秒等),适应不同交易策略需求,尤其适合超短线交易者。 真实的Tick数据还原:基于原始报价数据生成蜡烛图,确保数据准确性,避免因数据合成导致的信号失真。 实时买卖价显示:直接在图表上标注当前买价(Ask)和卖价(Bid),便于快速观察市场流动性及点差变化。 直观的视觉设计:采用清晰的蜡烛图配色(涨跌颜色区分)和专业的技术指标叠加,提升图表可读性。 适用场景: 高频交易(HFT):捕捉毫秒级价格变动,优化算法交易策略。 短线炒单(Scalping):快速进出场,利用微小波动获利。 为什么选择本产品? 传统分钟级或小时级图表无法满足超短线交易需求,而本工具填补了这一空白,让您能够像专业做市商一样,基于最精细的市场结构制定策略。无论是手动交易
XCalper TFO
Aecio de Feo Flora Neto
This oscillator was developed exclusively by xCalper in 2015 based on moving averages calculations to indicate and try predicting oversold and overbought levels. The fast line (white, by default) oscillates basically between values -0.5 (oversold) and +0.5 (overbought). Whenever this line crosses upward value -0.5, it means an oversold price level. When it crosses downward value +0.5, it means an overbought price level. When fast line crosses value 0.0 and returns, it is a strong pull-back indic
Pan PrizMA CD Phase
Aleksey Panfilov
The Expert Advisor and the video are attached in the Discussion tab . The robot applies only one order and strictly follows the signals to evaluate the indicator efficiency. Pan PrizMA CD Phase is an option based on the Pan PrizMA indicator. Details (in Russian). Averaging by a quadric-quartic polynomial increases the smoothness of lines, adds momentum and rhythm. Extrapolation by the sinusoid function near a constant allows adjusting the delay or lead of signals. The value of the phase - wave s
Классификатор силы тренда. Показания на истории не меняет. Изменяется классификация только незакрытого бара. По идее подобен полной системе ASCTrend, сигнальный модуль которой, точнее его аппроксимация в несколько "урезанном" виде, есть в свободном доступе, а также в терминале как сигнальный индикатор SilverTrend . Точной копией системы ASCTrend не является. Работает на всех инструментах и всех временных диапазонах. Индикатор использует несколько некоррелируемых между собой алгоритмов для класси
FFx Universal Strength Meter PRO is more than a basic strength meter. Instead of limiting the calculation to price, it can be based on any of the 19 integrated strength modes + 9 timeframes. With the FFx USM, you are able to define any period for any combination of timeframes. For example, you can set the dashboard for the last 10 candles for M15-H1-H4… Full flexibility! Very easy to interpret... It gives a great idea about which currency is weak and which is strong, so you can find the best pai
The FFx Universal MTF alerter shows on a single chart all the timeframes (M1 to Monthly) with their own status for the chosen indicator. 9 indicators mode (MACD-RSI-Stochastic-MA-ADX-Ichimoku-Candles-CCI-PSAR). Each can be applied multiple times on the same chart with different settings. Very easy to interpret. Confirm your BUY entries when most of the timeframes are showing green color. And confirm your SELL entries when most of the timeframes are showing red color. 2 Alert Options : input to s
FFx Watcher Pro MT5
Eric Venturi-Bloxs
The FFx Watcher PRO is a dashboard displaying on a single chart the current direction of up to 15 standard indicators and up to 21 timeframes. It has 2 different modes: Watcher mode: Multi Indicators User is able to select up to 15 indicators to be displayed User is able to select up to 21 timeframes to be displayed Watcher mode: Multi Pairs User is able to select any number of pairs/symbols User is able to select up to 21 timeframes to be displayed This mode uses one of the standard indicators
FFx Patterns Alerter gives trade suggestions with Entry, Target 1, Target 2 and StopLoss .... for any of the selected patterns (PinBar, Engulfing, InsideBar, OutsideBar) Below are the different options available: Multiple instances can be applied on the same chart to monitor different patterns Entry suggestion - pips to be added over the break for the entry 3 different options to calculate the SL - by pips, by ATR multiplier or at the pattern High/Low 3 different options to calculate the 2 TPs -
FFx Basket Scanner MT5
Eric Venturi-Bloxs
MetaTrader 4 version available here : https://www.mql5.com/en/market/product/24881 FFx Basket Scanner is a global tool scanning all pairs and all timeframes over up to five indicators among the 16 available. You will clearly see which currencies to avoid trading and which ones to focus on. Once a currency goes into an extreme zone (e.g. 20/80%), you can trade the whole basket with great confidence. Another way to use it is to look at two currencies (weak vs strong) to find the best single pairs
Currency Index Watcher is a simple and user-friendly tool for whoever wish to trade Forex using currencies indexes. Currency Index Watcher is configurable and usable directly from the panel. Indexes of 8 custom currencies EUR, USD, GBP, JPY, CHF, AUD, CAD, NZD (default) Any 3-chars symbol from your market watch could be used (BTC = bitcoin, RUB = ruble, CNH = yuan etc ...) : double click the symbol label  Ability to select which currencies and made-of pairs will be analyzed : check/uncheck wante
MetaTrader 4 version available here: https://www.mql5.com/en/market/product/25793 FFx Pivot SR Suite PRO is a complete suite for support and resistance levels. Support and Resistance are the most used levels in all kinds of trading. Can be used to find reversal trend, to set targets and stop, etc. The indicator is fully flexible directly from the chart 4 periods to choose for the calculation: 4Hours, Daily, Weekly and Monthly 4 formulas to choose for the calculation: Classic, Camarilla, Fibonac
Forex Relative Performance indicator This indicator calculates the relative strength of major currencies against the US dollar. The basic idea behind this indicator is "to buy strong currency and to sell weak currency". This indicator allows you to quickly identify the best forex pair to trade according to your trading style (Intraday, Scalping, Swing, or Long Term)
Pendiente de Precio
Cesar Juan Flores Navarro
Indicador en base a la pendiente de la linea de precio, dibuja una línea de color cuando sube a base de los precios que previamente has sido procesados o linealizados, y cuando baja la pendiente la linea linealizada toma otro color. En este caso se a considerado 6 lineas de diferentes procesos desde pendientes largas hacia las cortas, observándose que cuando coincidan las pendientes se produce un máximo o mínimo, lo que a simple vista nos permitirá hacer una COMPRA O VENTA.
WanaScalper
Isaac Wanasolo
1 (1)
A scalping indicator based on mathematical patterns, which on average gives signals with relatively small SL, and also occasionally helps to catch big moves in the markets (more information in the video) This indicator has three main types of notifications: The first type warns of a possible/upcoming signal on the next bar The second type indicates the presence of a ready signal to enter the market/open a position The third type is for SL and TP levels - you will be notified every time price re
Индикатор Coefficient Of Determination (COD) представляет собой значение коэффициента детерминации или квадрат коэффициента корреляции между зависимой переменной — ценой и объясняющей переменной — тиковым объемом. Что это дает нам на практике? COD отлично распознает кульминацию трендовых движений, что позволяет подбирать оптимальные точки и ловить развороты рынка. Как использовать индикатор: Наиболее популярная торговая стратегия строится совместно с трендовым индикатором Moving Average (MA), пе
作者的更多信息
Canal H Pro
N'da Lemissa Kouame
NuageTrend Pro
N'da Lemissa Kouame
Nuage Trend Pro – 趋势跟踪与Kijun信号 Nuage Trend Pro 是一款针对 MetaTrader 5 的高级指标,能够快速识别 强势市场趋势 ,并通过 Kijun 交叉点找到 最佳入场点 。将您的图表转化为 清晰直观的视觉地图 ,让交易更加 精准且自信 。 主要功能 自动Kijun交叉检测 :即时标出价格穿越基准线的关键时刻。 动态趋势云 :图表颜色随市场方向变化——上涨为绿色,下跌为红色。 清晰的买卖信号 :快速捕捉买入和卖出机会。 可自定义设置 :调整 Kijun 周期、趋势云颜色及显示样式,满足您的策略需求。 为什么选择 Nuage Trend Pro? 简单直观的趋势可视化 ,一目了然。 多功能适用 :适用于所有时间周期及交易品种(外汇、指数、商品)。 适合 初学者 和 资深交易者 优化入场和出场策略。 易于与其他指标或交易策略结合 使用。
Weekly Levels Pro
N'da Lemissa Kouame
中文 (Chinois) – Weekly Levels Pro Weekly Levels Pro – 每周关键水平 是一个简单而强大的 MetaTrader 5 指标,专为自动显示每周最重要的四个交易水平而设计: 本周最高价 (Weekly High) → 自然阻力位 本周最低价 (Weekly Low) → 自然支撑位 本周开盘价 (Weekly Open) → 趋势参考点 本周收盘价 (Weekly Close) → 多空强弱指标 主要特点: 每周自动更新,无需手动操作 图表上清晰可见,直观易读 快速识别主要支撑位和阻力位 适用于外汇、指数、大宗商品和加密货币 简单参数,无复杂设置 为什么选择 Weekly Levels Pro? 周线水平被专业和机构交易者广泛使用,用于识别: 突破与反转区域 战略性的进场和出场点位 趋势延续或修正的信号
Pin Bar Pro v1
N'da Lemissa Kouame
Pin Bar Pro v1.0 – MQL5 指标 描述: Pin Bar Pro 是一个专业的 MetaTrader 5 指标,可自动识别 Pin Bar(针形线) ,帮助预测市场反转。信号直接显示在图表上: 蓝色箭头 → 买入信号(看涨 Pin Bar) 红色箭头 → 卖出信号(看跌 Pin Bar) 功能: 自动识别 Pin Bar 可自定义箭头 ( Arrow_Up_Code , Arrow_Down_Code ) 可调节垂直偏移 ( Arrow_Offset_Pts ) 支持所有品种和时间周期 参数: 参数 描述 默认值 Arrow_Up_Code 买入箭头 Wingdings 代码 233 Arrow_Down_Code 卖出箭头 Wingdings 代码 234 Arrow_Offset_Pts 垂直偏移(点数) 10 作者: KOUAME N’DA LEMISSA 版本: 1.0 – 可用于 MQL5
1. 中文 (Chinois simplifié) 指标 Monthly Levels + Pin Bar Pro 描述 Monthly Levels + Pin Bar Pro 指标结合了 月度关键水平 (高点、低点、开盘、收盘) 与 价格行为反转形态 (Pin Bar) 的自动检测。 它专为技术交易者和机构交易者设计,帮助预判市场反应区,并在图表上生成清晰直观的交易信号。 主要功能 自动绘制月度水平 :高点、低点、开盘、收盘。 实时 Pin Bar 检测 (看涨 & 看跌)。 直观的可视化显示 :水平线 (月度) + 箭头 (信号)。 ️ 可自定义参数 :时间周期、箭头样式、大小、偏移。 高效优化 :低资源消耗,适合剥头皮和波段交易。 ️ 兼容 EA :可集成到自动化交易策略中。 ️ 使用方法 将指标添加到任意时间周期的图表。 系统会自动显示 月度高点、低点、开盘价、收盘价 。 观察信号: 蓝色箭头 → 看涨 Pin Bar (接近月度支撑)。 红色箭头 → 看跌 Pin Bar (接近月度阻力)。 结合趋势、成交量等过滤条件提高准
Quarterly Levels Pro
N'da Lemissa Kouame
Chinese Version (中文) Quarterly Levels Pro v1.0 – 商业通知 产品名称: Quarterly Levels Pro v1.0 开发者: KOUAME N'DA LEMISSA 版本: 1.0 描述: Quarterly Levels Pro 由 KOUAME N'DA LEMISSA 开发,是 MetaTrader 5 的专业指标,可自动显示季度的 High, Low, Open 和 Close 水平。它可以帮助交易者清晰地在图表上查看关键支撑和阻力区,便于中期交易决策。 主要功能: 自动显示季度 High, Low, Open 和 Close 水平。 每个水平的可自定义颜色: High: 红色 Low: 蓝色 Open: 绿色 Close: 橙色 可调线宽以便视觉区分。 可通过 Quarter_Shift 参数显示 当前、上一个或更早季度 的水平。 兼容 MT5 上的所有货币对和金融工具。 参数: 参数 描述 默认值 Quarter_Shift 显示到上一个季度:0 = 当前季度, 1 = 上一季度, 等等 0 交易者优势: 快速
中文 (Chinois simplifié) 描述 Multi-Timeframe Levels Pro v1.0 自动在图表上绘制关键的 日线、月线、季度线和年线 高低开收水平。 这些水平对于识别重要的支撑位、阻力位和突破区域非常有用。 主要功能 自动显示 Daily / Monthly / Quarterly / Yearly 水平 不同颜色标记 High、Low、Open、Close 可自定义 Shift 分析历史周期 适用于所有市场: 外汇、指数、大宗商品、股票、加密货币 轻量快速,适合 Price Action、波段交易、剥头皮 参数 DailyShift → 当前或前一天 MonthlyShift → 当前或前一个月 QuarterlyShift → 当前或前一个季度 YearlyShift → 当前或前一年 使用建议 高时间框架(季度、年度)用于关键区域;低时间框架(日线、月线)适合短线交易。
Marubozu Pro MT5
N'da Lemissa Kouame
Commercial Description – Marubozu Pro (MT5) Description Marubozu Pro is a professional indicator for MetaTrader 5 that automatically detects Marubozu candles (bullish and bearish) directly on your chart. It helps traders identify strong market momentum where buyers or sellers take full control, by displaying clear visual arrows for buy and sell signals. This tool is designed to be simple, effective, and fast , perfect for manual trading or as a filter in automated strategies. Key Features
2️⃣ Version Chinois ETE Detector – 头肩形指标 (Head & Shoulders Indicator) 将图表转化为清晰可操作的交易机会! 指标介绍 ETE Detector 自动识别 头肩顶 (H&S) 和 倒置头肩 (IH&S) 图形——经典趋势反转形态。 无需手动寻找图形,您的分析将变得 快速、精准、可视化 。 功能亮点 自动检测 趋势反转图形 彩色箭头 :绿色 表示买入(倒置头肩),红色 表示卖出(头肩顶) 自动绘制 颈线 ,显示突破区域 “”标签 标记肩部和头部,直观显示图形 图表上直接显示 文字说明 : "H&S – 卖出" 或 "倒置H&S – 买入" 交易者优势 节省时间 :无需手动寻找图形 决策更可靠 :提前发现趋势反转 清晰可视化 :完整图形一目了然 适用于 所有市场和时间周期 易于自定义 ,适应个人交易风格 ️ 可调参数 参数 描述 默认值 LookBack 分析的蜡烛数量 300 MinDistance 肩与头之间的最小距离 5 Tolerance 肩部对称公差 (%) 2% BuyColor
Fusion Monthly Levels + PinBar + Marubozu 说明 这个独特的指标将三种强大的技术分析工具融合为一体: 月度关键水平 (高点, 低点, 开盘价, 收盘价) —— 用于识别关键支撑与阻力区域。 PinBar 识别 —— 一种可靠的反转形态,提示价格的强力拒绝。 Marubozu 识别 —— 强烈的趋势型K线,显示出明显的方向性动能。 通过这种融合,您将获得一个 直观、全面且高效 的市场预测工具。 优势 融合机构级别水平 + 价格行为 (Price Action)。 清晰的视觉信号:蓝/红箭头表示 PinBar,蓝/红方块表示 Marubozu。 适用于所有交易品种(外汇、指数、加密货币、大宗商品、股票)。 可自定义参数(参考周期、影线大小、箭头样式)。 代码优化,无延迟,即使在多个图表中使用。 完全兼容 MetaTrader 5。 信号说明 看涨 PinBar → 蓝色箭头在K线下方。 看跌 PinBar → 红色箭头在K线上方。 看涨 Marubozu → 蓝色方块在K线下方。 看跌 Marubozu → 红色方块在K线上方。
ABCD Lemissa + 月线水平 + PinBar + Marubozu 指标 描述 该指标 整合了多种强大工具 ,为市场提供完整的概览: ABCD Lemissa – 自动识别 ABCD 结构 ,标记 A、B、C、D 点、支撑/阻力区域,并显示买入/卖出箭头。 Monthly Levels(月线水平) – 显示月线蜡烛的 High、Low、Open、Close 水平,用于识别关键区域。 PinBar & Marubozu – 自动识别 PinBar 蜡烛 (反转信号)和 Marubozu 蜡烛 (强趋势蜡烛),支持自定义箭头和符号显示。 该指标完全 可视化 ,结合了线条、箭头和矩形,便于分析市场和做出交易决策。 主要功能 ABCD Lemissa 自动识别 A、B、C、D 点 显示 BUY 和 SELL 信号箭头 使用 X1 / X2 矩形高亮支撑和阻力区域 Monthly Levels(月线水平) 显示月线蜡烛的 High、Low、Open 和 Close 每根新蜡烛动态更新 PinBar & Marubozu 自动识别反转蜡烛和强趋势蜡烛 可自定义箭头显示交易信
Order Block Pro MT5
N'da Lemissa Kouame
Order Block Pro (MQL5) – 版本 1.0 作者: KOUAME N'DA LEMISSA 平台: MetaTrader 5 描述: Order Block Pro 是一个高级指标,可自动识别图表上的 多头和空头订单块 (Order Blocks) 。通过分析盘整蜡烛及随后强势的冲击蜡烛,该指标帮助交易者识别价格可能加速的关键区域。 适合希望以下目标的交易者: 精准确定进出场点。 发现动态支撑和阻力区域。 提升风险管理和交易策略。 主要功能: 多头订单块检测: 在盘整蜡烛之后的强势上涨蜡烛处显示绿色箭头。 空头订单块检测: 在盘整蜡烛之后的强势下跌蜡烛处显示红色箭头。 完全可自定义: 最大蜡烛实体比例 ( BodyMaxRatio ) 下一根蜡烛最小比例以确认走势 ( NextCandleMinPct ) 箭头偏移量 ( Arrow_Offset_Pts ) Marketplace 准备就绪: 优化且干净的代码,符合 MQL5 Marketplace 标准。 输入参数: 参数 描述 Arrow_Up_Code Wingdings 上箭头代码 (默认: 233
ETE Detector v4.0 (Head & Shoulders) Author: KOUAME N’DA LEMISSA Version: 4.0 Platform: MetaTrader 5 Indicator Type: Chart / Visual Trading Signals Overview The ETE Detector v4.0 is a technical indicator designed to automatically detect classic and inverse Head & Shoulders patterns (H&S) on MT5 charts. These patterns are widely used to anticipate trend reversals. With this tool, traders can: Detect sell signals (classic H&S) and buy signals (inverse H&S) with accuracy. Easily visualize patterns
ETE Detector puissant
N'da Lemissa Kouame
中文 – 商业说明 Logiciel – ETE DETECTOR POWER v5.0 自动识别“头肩形态” PUISSANCE DU DÉTECTEUR ETE v5.0 是专业交易工具,帮助交易者 提前捕捉市场重要反转 ,利用最强大的图表形态之一: 头肩形态(H&S)及其反转形态 。 Fonctionnalités MaxObjects ,即使在繁忙图表或多时间框架下,指标仍然保持流畅和清晰。 主要功能 实时自动识别 经典 H&S (卖出) et H &S (买入) 清晰显示 肩部、头部和颈线 自动绘制 反转区域 (红色 = 卖出,绿色 = 买入) ACHETER/VENDRE 箭头 即时显示交易机会 智能循环对象管理,避免图表拥堵 完全可自定义参数:分析蜡烛数量、肩头最小距离、对称容差、最大图形数量、矩形样式、标记大小和颜色 交易者优势 节省时间:自动分析市场 高精度:可调容差确保仅识别可靠形态 可视性最佳:彩色区域、箭头、标签和颈线 兼容所有策略:波段、日内、剥头皮 Version :不会拖慢 MT5
Dynamique mensuelle des plages hautes et basses v1.0 Auteur : KOUAME N'DA LEMISSA Description : L' indicateur dynamique mensuel de fourchette haute et basse affiche les niveaux mensuels clés sur votre graphique grâce à des fonctionnalités avancées de suivi dynamique. Il permet aux traders de visualiser facilement les zones de support et de résistance mensuelles, ainsi que les zones où le prix tend à dépasser ou à tester ces niveaux, offrant ainsi des opportunités de trading précises. P
每月高低动态范围 + 流动性区域 v1.2 作者: KOUAME N'DA LEMISSA 描述: 使用此强大的指标提升您的市场分析能力,它结合了: 关键月度水平: 高点(High)、低点(Low)、开盘(Open)和收盘(Close),用于识别最重要的支撑和阻力区域。 动态高低范围: 自动追踪极端价格波动,检测重要市场变动。 流动性区域: 可视化矩形显示流动性集中区(买/卖)。这些区域的厚度和颜色可完全自定义,以确保图表上最佳可见性。 适用于所有交易品种和经纪商: 可在外汇、股票、指数和加密货币中完美运行。 主要功能: 自动检测月度 High、Low、Open 和 Close 水平。 显示动态高低范围以追踪极端波动。 可视化流动性区域,可自定义边框厚度和颜色。 支持所有时间周期。 完全可配置的参数,可根据您的交易风格进行调整。 指标设置: Ref_Timeframe: 用于计算水平的参考时间周期(默认:Monthly)。 Ref_Shift: 参考K线(0 = 最新已完成的K线)。 LiquidityBuyColor / LiquiditySellColor: 买入/卖出流动性区
Booster Trading Pro V
N'da Lemissa Kouame
Chinois (Chinois / 中文) Booster Trading Pro pour KOUAME N'DA LEMISSA : MetaTrader 5 描述 Le produit Booster Trading Pro est le suivant : 月度关键水平: 高点、低点、开盘和收盘,快速识别支撑和阻力区域。 动态高低范围: 跟踪价格在月度水平上下的极端波动。 动态开盘范围: 相对于月开盘检测关键价格水平。 自动流动性区域: 使用动态彩色矩形可视化潜在买卖区域。 主要特点 兼容所有交易品种和时间周期。 实时更新动态水平。 可自定义颜色和厚度,灵活调整区域显示。 清晰显示月度水平和动态范围,便于快速阅读图表。 Il s'agit d'une application MetaTrader 5. 交易者优势 快速决策: 快速识别关键区域,无需浪费时间。 清晰可视化: 流动性区域和动态范围简化图表分析。 多功能性: 适用于剥头皮、日内交易或波段交易。 节省时间: 所有关键工具集中在一个指标中。 可自定义参数 Ref_Timeframe: 用于计算月度水平的参考周期
Structure de fusionBlocsAuto + MensuelOU 结构力量与月度精度结合 产品说明 Fusion StructureBlocksAuto + MonthlyOR 是一个集成的高级指标,将 市场结构分析 (自动检测 swing 高点/低点 与结构区块)与 月度开盘区间 (Plage ouverte mensuelle, MOR ) 键的月度水平,帮助你实时识别高概率交易区和市场动力的变化。 使用此工具你可以 : 自动识别 支撑/阻力结构区块 balançoire 通过自动连接 swing 显示月度的:开盘价、高点、低点和收盘价水平 检测 Monthly Open Range 的突破水平 将 市场结构 + 月度背景 结合起来以获取更强的确认 主要功能 支持与阻力结构区块的自动检测 动态绘制月度开盘、最高、最低、收盘水平 在主要 swing点间绘制趋势线 提供 Open Range 高点与低点视图以追踪初始动能 区块半透明显示,图形渲染平滑 优化设计,实现最小滞后与重算 适用于所有时间周期与交易品种 (外汇、
Channel Ultima
N'da Lemissa Kouame
Channel Ultima – 动态多级通道指标 简短描述 Canal Ultima s'en charge . ​晰显示 支撑位、阻力位及平衡区 ,非常适合技术型和结构化交易者。 详细介绍 Channel Ultima s'appelle Channel Ultima . ​ 短期通道 :快速市场波动 中期通道 :中等趋势 长期通道 :整体市场结构 算法自动识别 重要高低点 ,计算 上/中/下线 ,并 动态延伸 以实时跟踪市场走势。 目的与优势 可视化 多层次市场结构 识别 流动性区和反转区 指导 突破或反弹的入场和出场 可与其他指标配合确认信号(Kijun, Donchian, FZG) Channel Ultima 提供 市场视觉指南针 ,对结构化交易策略至关重要。 主要特点 三个独立通道(短期、中期、长期) 自动识别 枢轴高低点 动态 上/中/下线 自动延伸至最新蜡烛 颜色区分明显, 一目了然 适用于 所有资产和时间框架 轻量快速,实时计算 ️ 可自定义参数 参数 描述 LookbackBars 用于枢轴检测的蜡烛数量 Swi
nstitutional Liquidity Map Pro — votre compas pour tous les aspects institutionnels de votre économie ! Institutional Liquidity Map Pro — 专业流动性地图指标 Carte de liquidité institutionnelle Pro 是一款为专业交易者打造的强大工具,帮助您实时识别市场中的 流动性区域 与 机构资金行为 。 主要功能 : 自动识别 流动性区域 (高点/低点、假突破、吸流动作) 支持所有周期(M1 et MN1) Blocs de commande ) ​ ​ 提供 流动性突破提醒 和 价格反应提示 与任何指标或策略兼容 ️ 优势: 直观展示市场结构,揭示"聪明资金"位置 适用于外汇、指数、加密货币、黄金等多种市场 图形化展示清晰易懂,新手也能快速上手 专为 Smart Money Concepts (SMC) 与 ICT交易理念 设计 Institutional Liquidity Map Pro ——
筛选:
无评论
回复评论