Booster Trading Pro V

Chinois (Chinois / 中文)

Booster Trading Pro
pour KOUAME N'DA LEMISSA
: MetaTrader
5

描述

Le produit Booster Trading Pro est le suivant :

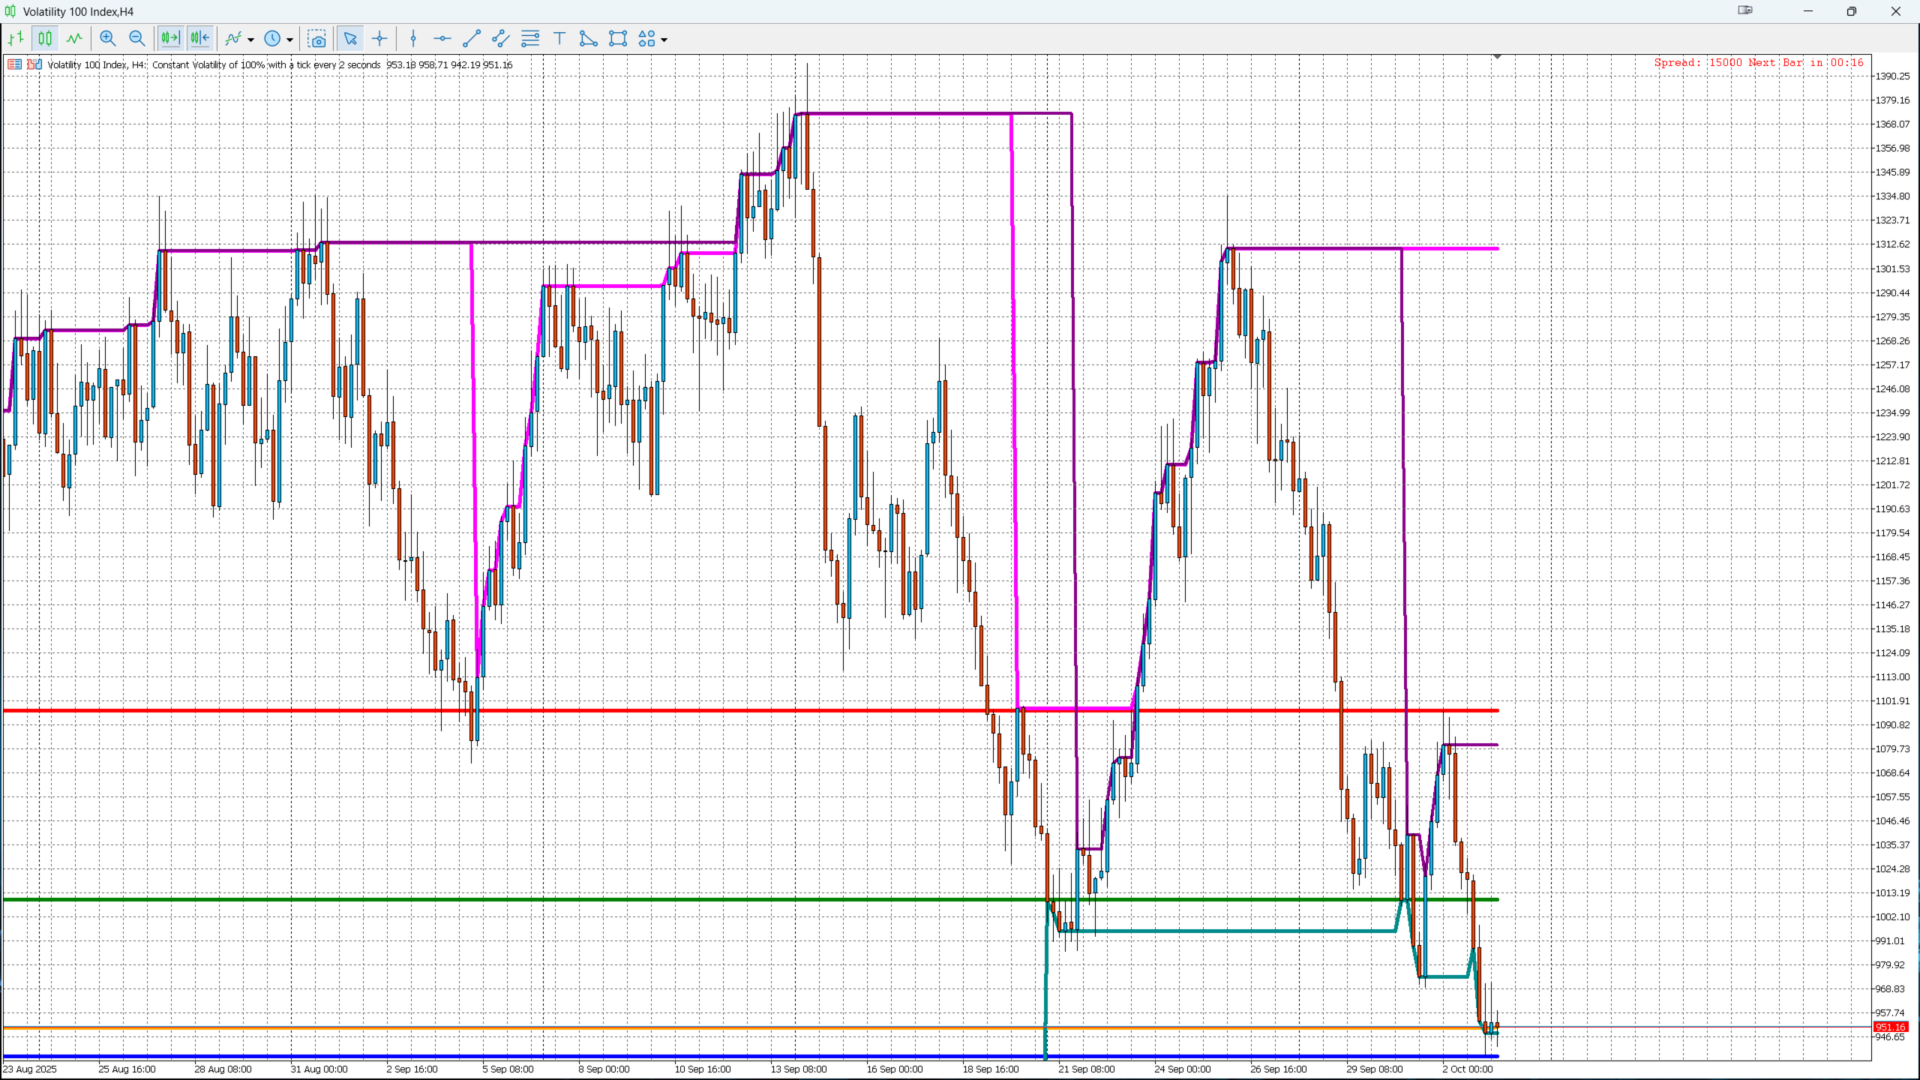
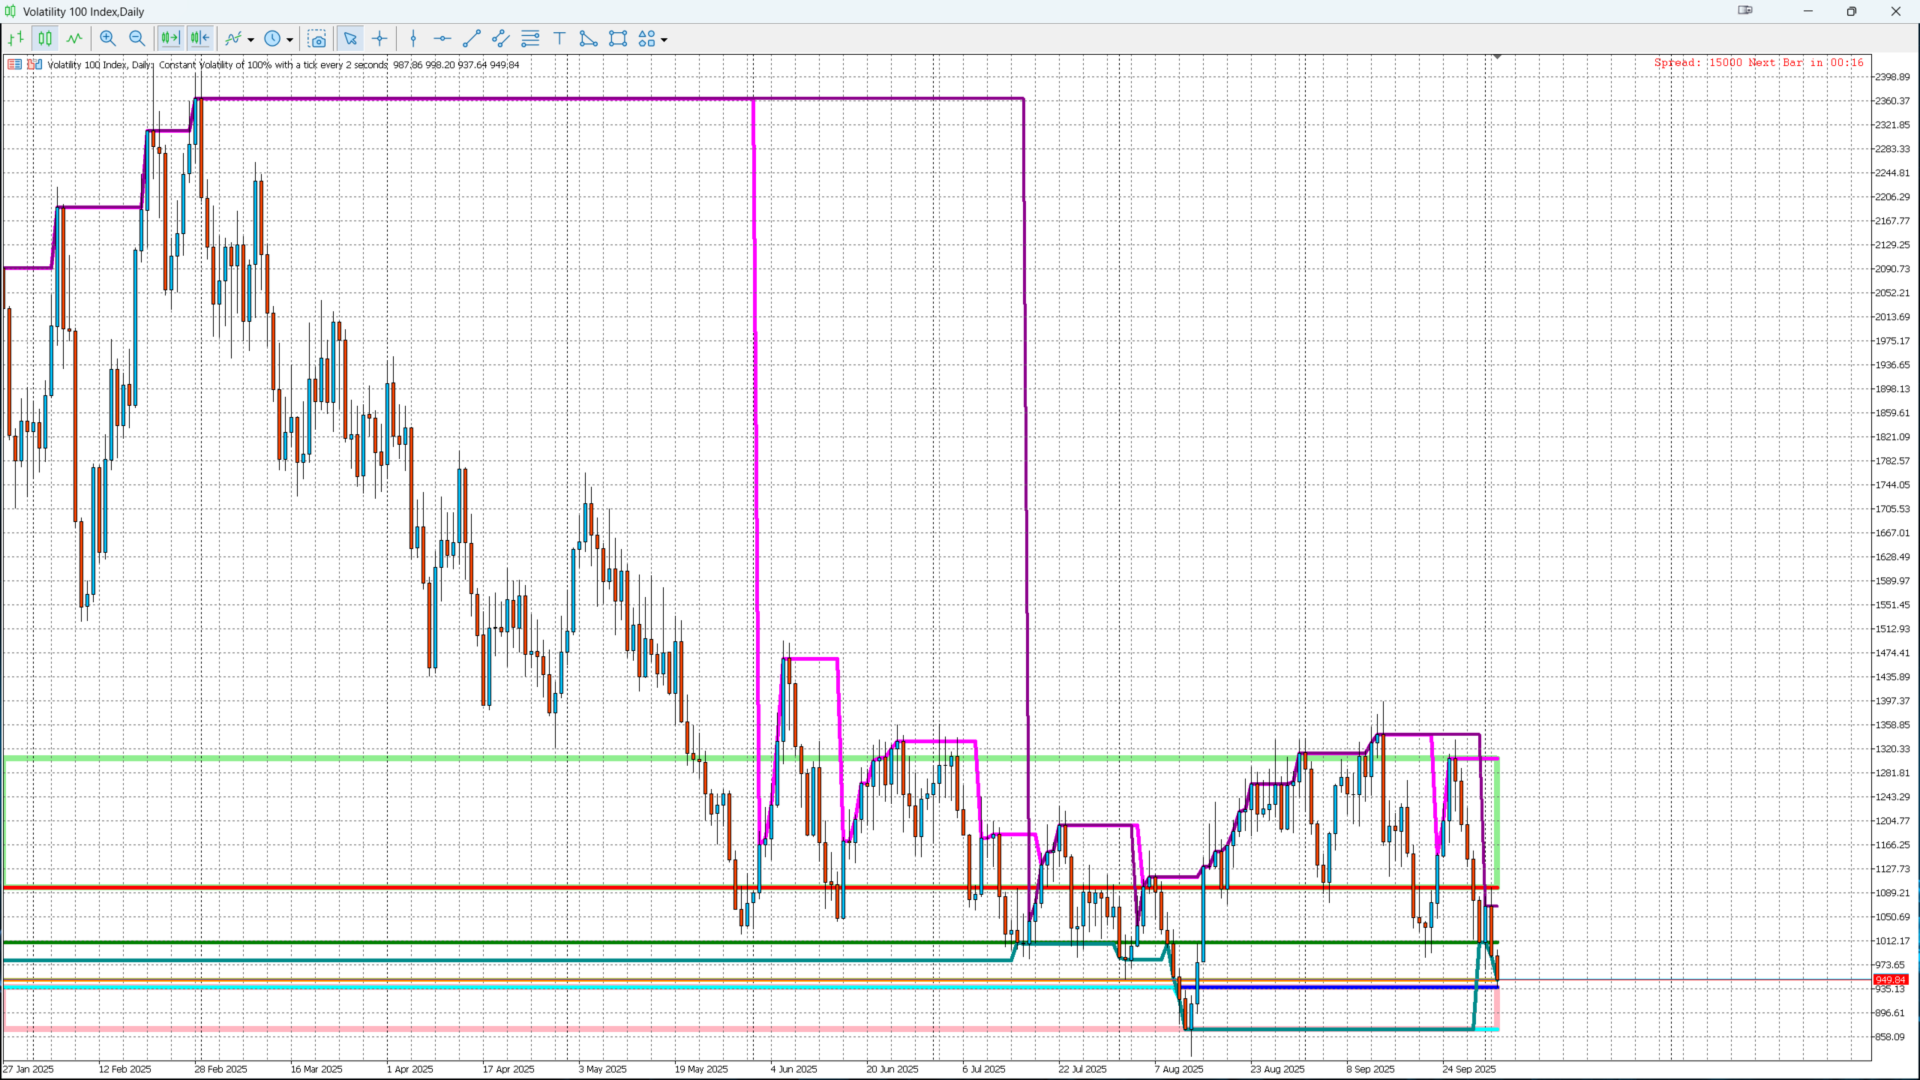
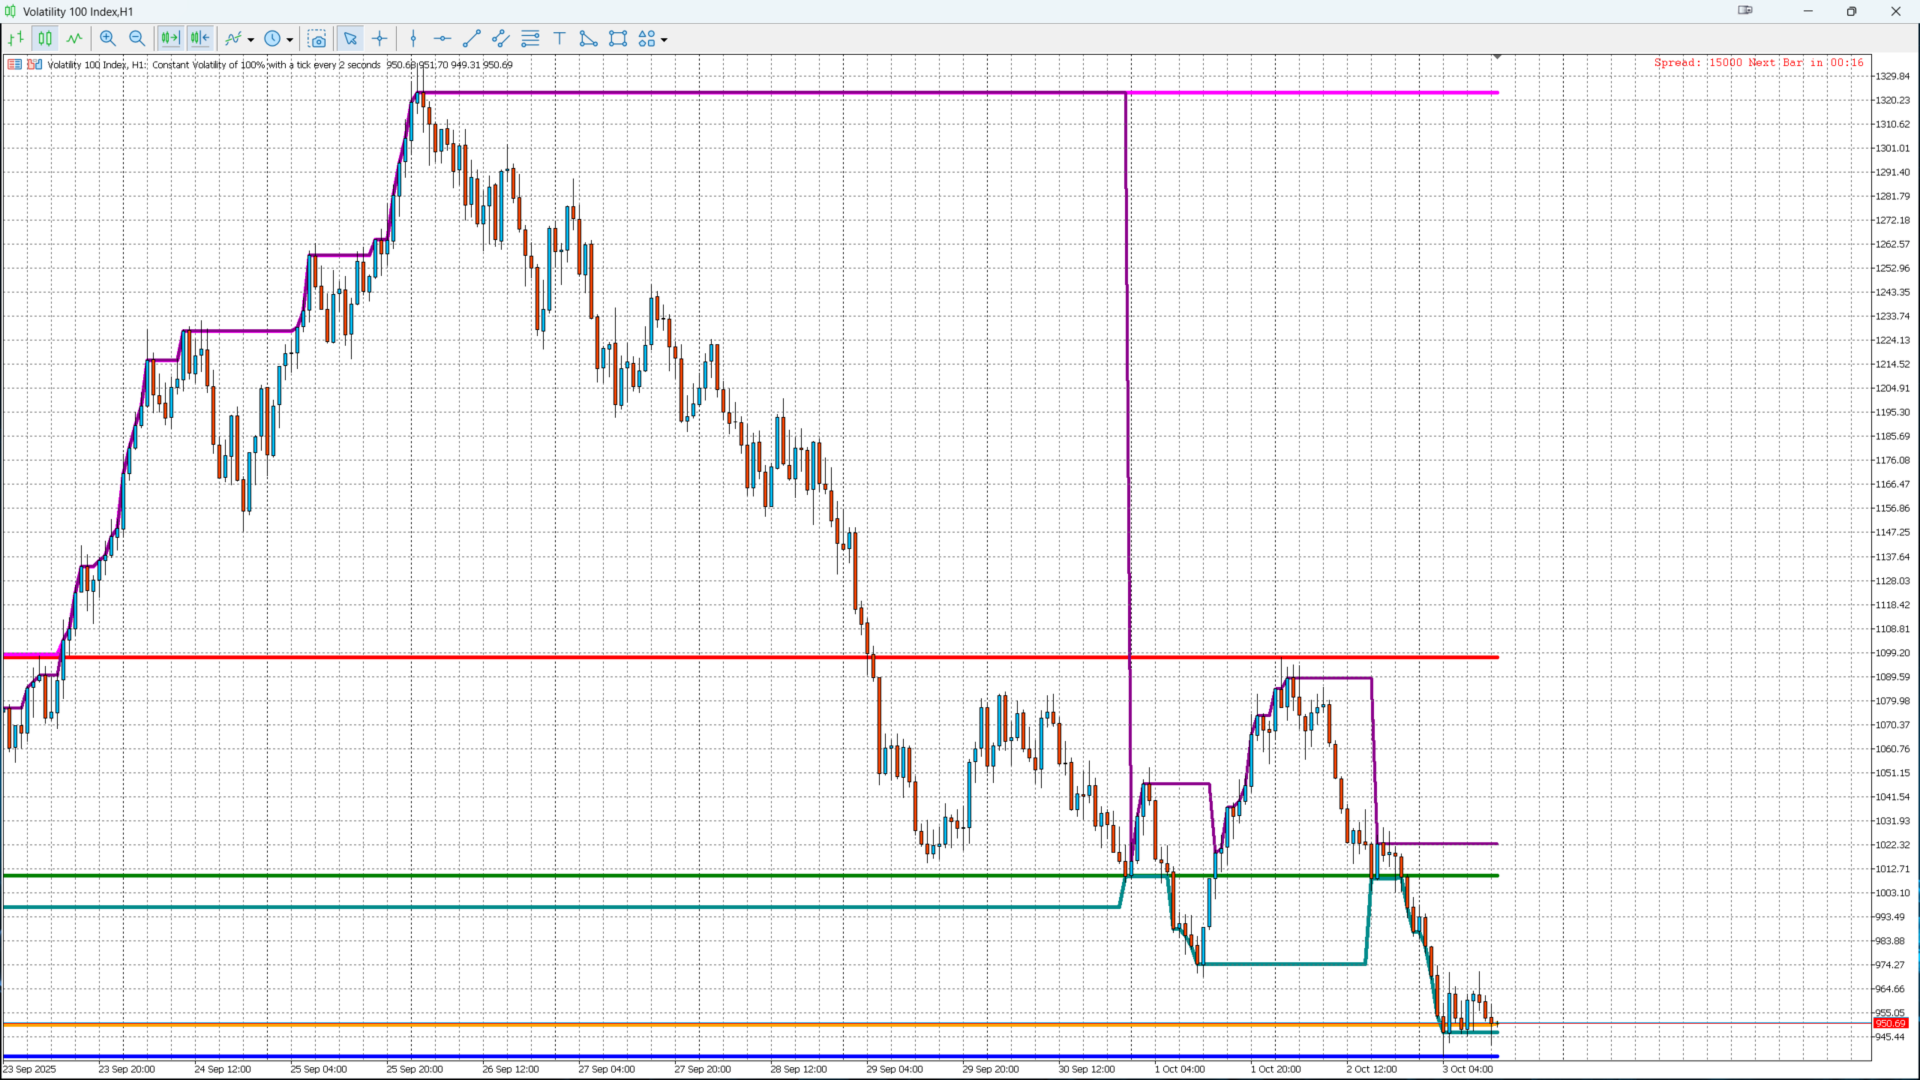
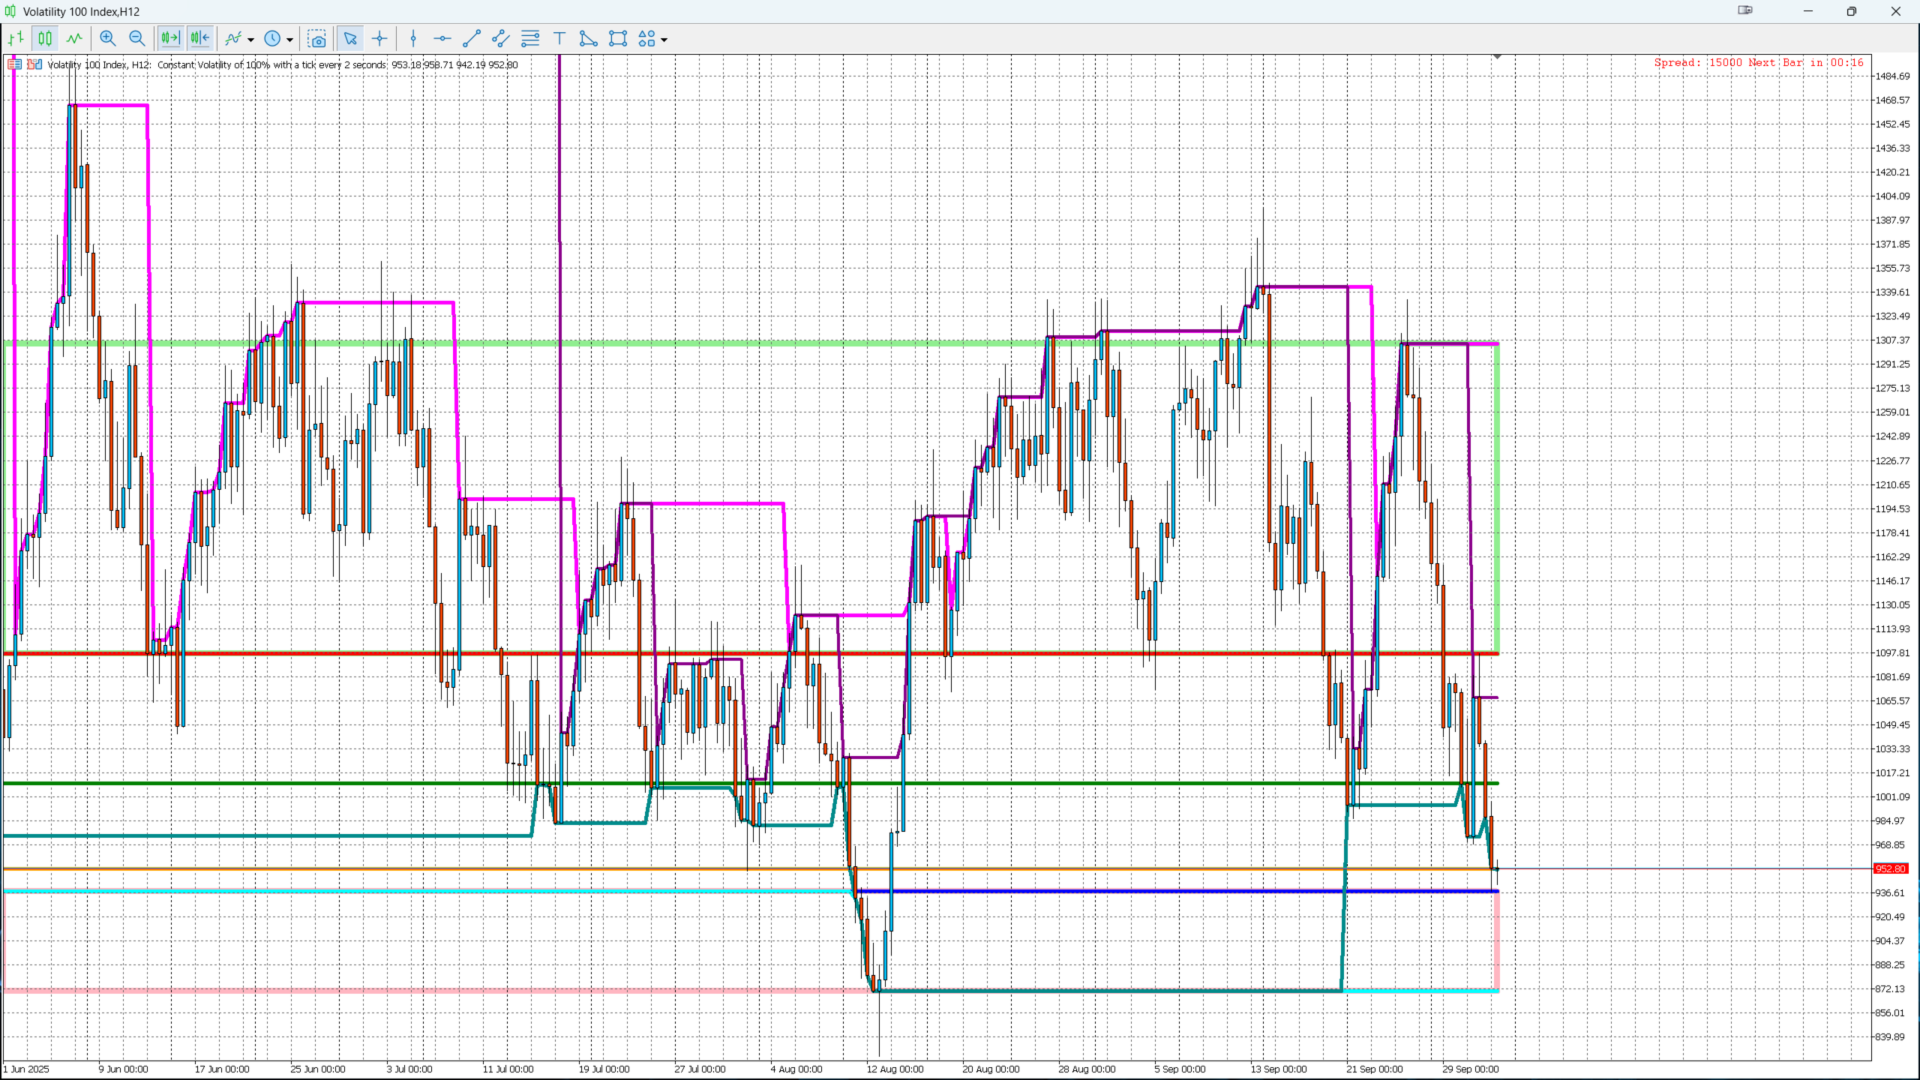
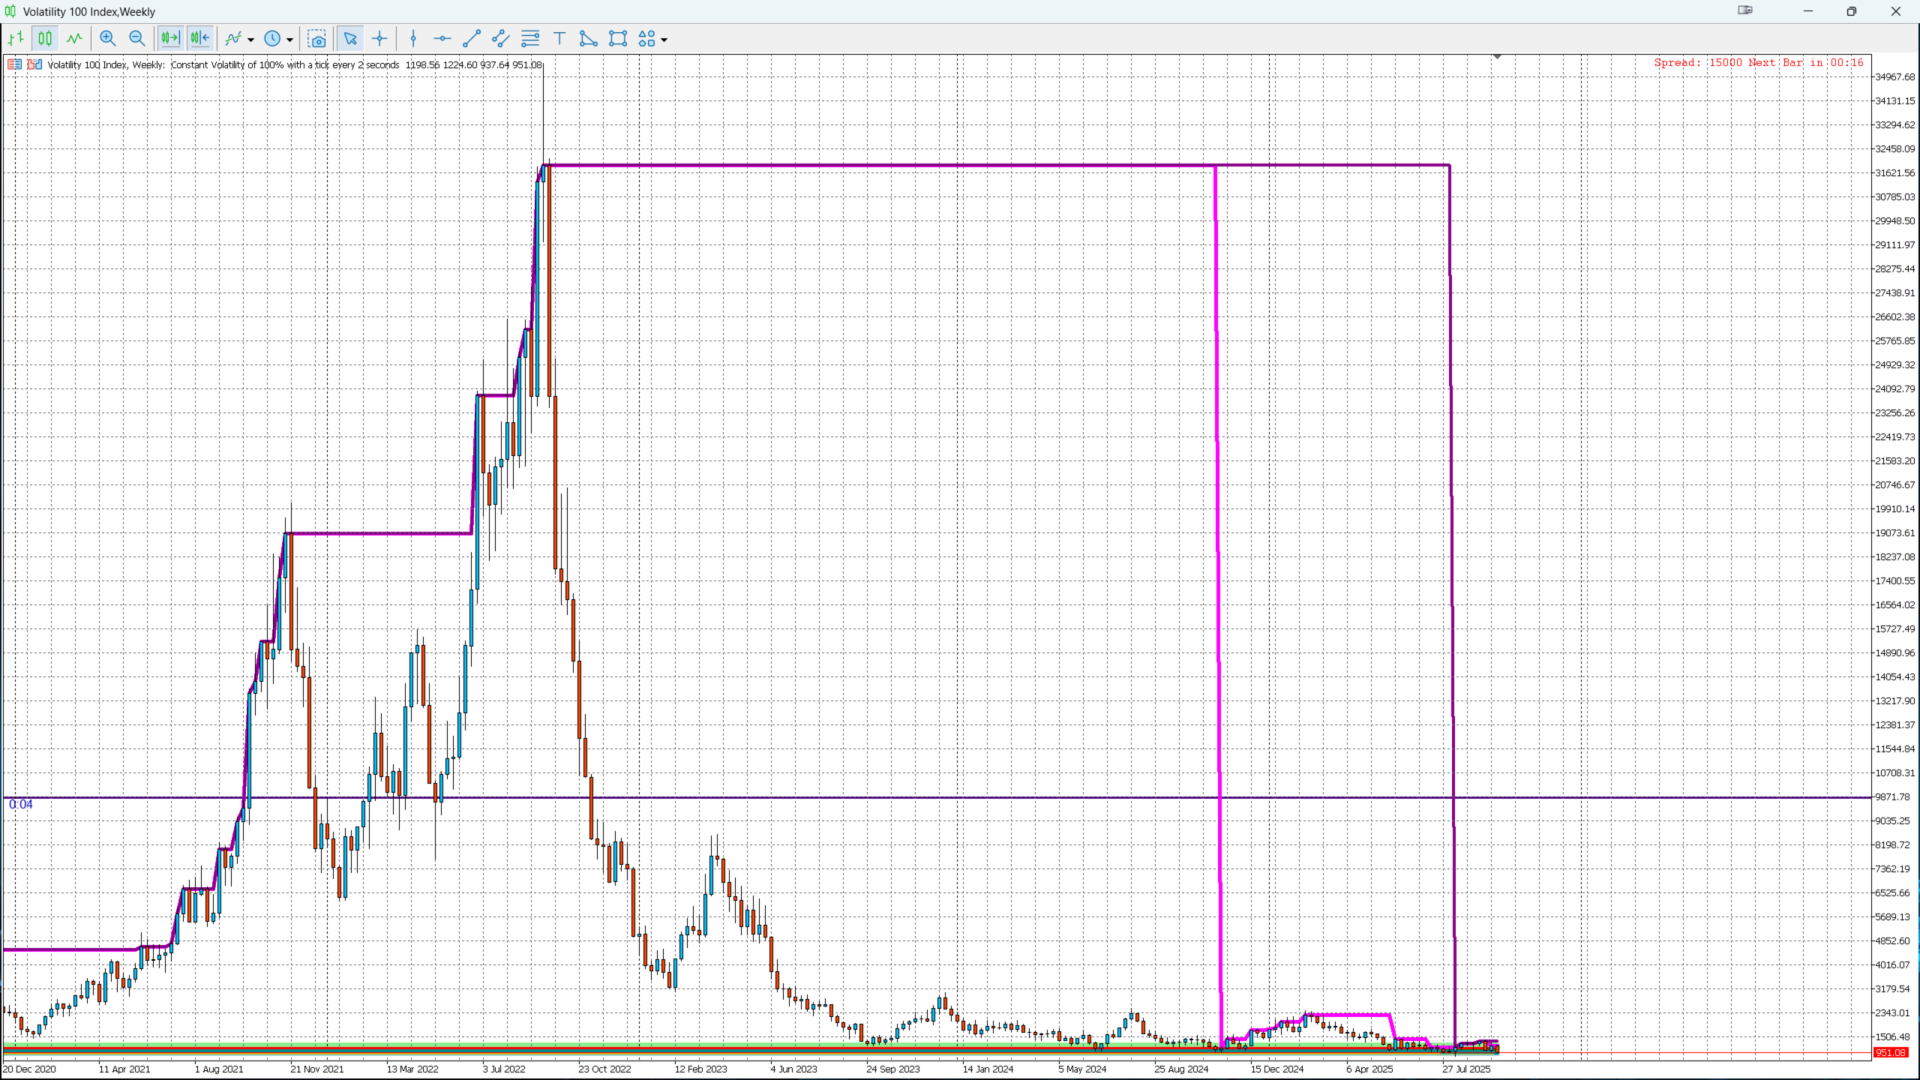
  • 月度关键水平: 高点、低点、开盘和收盘,快速识别支撑和阻力区域。

  • 动态高低范围: 跟踪价格在月度水平上下的极端波动。

  • 动态开盘范围: 相对于月开盘检测关键价格水平。

  • 自动流动性区域: 使用动态彩色矩形可视化潜在买卖区域。

主要特点

  • 兼容所有交易品种和时间周期。

  • 实时更新动态水平。

  • 可自定义颜色和厚度,灵活调整区域显示。

  • 清晰显示月度水平和动态范围,便于快速阅读图表。

  • Il s'agit d'une application MetaTrader 5.

交易者优势

  • 快速决策: 快速识别关键区域,无需浪费时间。

  • 清晰可视化: 流动性区域和动态范围简化图表分析。

  • 多功能性: 适用于剥头皮、日内交易或波段交易。

  • 节省时间: 所有关键工具集中在一个指标中。

可自定义参数

  • Ref_Timeframe: 用于计算月度水平的参考周期。

  • Ref_Shift: 参考蜡烛偏移量。

  • LiquidityBuyColor / LiquiditySellColor: 流动性区域颜色。

  • LiquidityZoneWidth: 流动性区域厚度。

使用方法

  1. La version Booster Trading Pro de MetaTrader 5 est disponible.

  2. 选择参考周期(默认:月线)。

  3. 观察月度水平、动态范围和流动性区域。

  4. 利用这些信息来 :

    • 确定入场和出场点。

    • Le Stop Loss et le Take Profit.

    • 验证现有交易策略。

注意事项

  • 动态水平和流动性区域会根据市场变化自动调整。

  • 指标对当前蜡烛做出响应,确保分析精准及时。


推荐产品
Blahtech Market Profile MT5
Blahtech Limited
5 (10)
Was: $249  Now: $99   Market Profile defines a number of day types that can help the trader to determine market behaviour. A key feature is the Value Area, representing the range of price action where 70% of trading took place. Understanding the Value Area can give traders valuable insight into market direction and establish the higher odds trade. It is an excellent addition to any system you may be using. Inspired by Jim Dalton’s book “Mind Over Markets”, this indicator is designed to suit the
Gioteen Volatility Index (GVI) - your ultimate solution to overcoming market unpredictability and maximizing trading opportunities. This revolutionary indicator helps you in lowering your losing trades due to choppy market movements. The GVI is designed to measure market volatility, providing you with valuable insights to identify the most favorable trading prospects. Its intuitive interface consists of a dynamic red line representing the volatility index, accompanied by blue line that indicate
Maximum Trend Arrows OT MT5
Mulweli Valdaz Makulana
STRICTLY FOR BOOM INDEX ONLY!!!!! Here I bring the Maximum Trend Arrows OT1.0 MT5 indicator. This indicator is made up of a combination of different trend indicators for entries and exits, for entries an orange arrow will paint on the chart below the current market and a red flag for closing of trades and it produces buy arrows only. When the orange arrow appears, it will appear along with it's sound to notify you. The 1H timeframe is recommended, don't use it anywhere else than on the 1H timefr
# 回撤指标 V4.0 - 掌控交易的必备工具 ## 通过完整的实时绩效概览改变您的交易 在要求严苛的外汇和差价合约交易世界中,**了解您的实时绩效**不是奢侈品,而是**绝对必需**的。**回撤指标 V4.0** 不仅仅是一个简单的指标:它是您的**专业仪表板**,为您提供清晰、精确和即时的交易账户状态视图。 --- ## 为什么这个指标将永远改变您的交易 ### 90% 交易者面临的问题 您是否曾经遇到过以下情况之一? **您不确切知道自己的状况** - 您的 MT5 平台显示数字,但您必须心算您的真实表现。 **您发现回撤为时已晚** - 当您意识到已经损失了 15% 的资金时,已经太晚了,无法有效应对。 **您缺乏历史可见性** - 无法快速知道本周、本月或今年是否盈利。 **您浪费时间分析交易** - 您必须打开多个窗口、进行计算,并失去对市场的关注。 **您没有概览** - 有多少持仓?我的全局盈亏是多少?我今天的表现如何? ### 解决方案:一体化专业仪表板 **回撤指标 V4.0** 通过提供一个**完整的控制面板*
MercariaPattern1-2-3 відстежує рух ціни, знаходить трьоххвильові структури 1-2-3 та підсвічує момент, коли сценарій підтверджується пробоєм ключового рівня. MercariaPattern1-2-3 tracks price movement, detects three-leg 1-2-3 structures and highlights the moment when the scenario is confirmed by a key level breakout. Індикатор збирає локальні свінги в компактну фігуру 0–1–2–3 , чекає підтвердженого пробою та будує стрілку входу з готовими рівнями SL/TP. The indicator combines local swings into a
Ultimate Boom and Crash 指标 Ultimate Boom and Crash 指标由 Coetsee Digital 开发,是一款先进工具,旨在识别市场中的潜在暴涨机会。该指标专为关注 Deriv 和 Weltrade 合成市场的交易者设计,仅在 3 分钟 (M3)、5 分钟 (M5)、15 分钟 (M15)、30 分钟 (M30) 和 1 小时 (H1) 时间周期上运行,并仅支持以下交易对:PainX 1200、PainX 999、PainX 800、PainX 600、PainX 400、GainX 1200、GainX 999、GainX 800、GainX 600、GainX 400、BreakX 600、BreakX 1200、BreakX 1800、SwitchX 600、SwitchX 1200、SwitchX 1800、Crash 1000 Index、Crash 900 Index、Crash 600 Index、Crash 500 Index、Crash 300 Index、Boom 1000 Index、Boom 900 Index、Bo
Manyal trading system, CovEchoTrend Robot, focuses on reliability and flexibility. By employing statistical analysis methods to study the relationships between the base indicator and market patterns, the system enables a deeper understanding of market processes. Intelligent pattern analysis: The application of statistical data processing helps identify key trend reversal points more accurately, signaling significant market shifts. Informed decision-making is based on the intersection of indicato
SMC Venom 模型 BPR 指標是針對在智慧貨幣 (SMC) 概念內工作的交易者的專業工具。它會自動辨識價格圖表上的兩種關鍵模式: FVG (公平價值缺口)是三根蠟燭的組合,其中第一根和第三根蠟燭之間存在缺口。它在水平之間形成一個沒有成交量支撐的區域,這通常會導致價格調整。 BPR (平衡價格區間)是兩種 FVG 模式的組合,形成一個「橋樑」 - 當價格以低成交量活動移動時,突破並返回到水平的區域,從而在蠟燭之間產生間隙。 這些模式可協助交易者透過分析圖表上的交易量和價格動態(大型市場參與者和普通參與者之間的互動)來識別關鍵的支撐/阻力位、突破區域和切入點。 此指標以矩形和箭頭的形式可視化模式,也支援靈活的警報設定。 主要特點: 模式顯示模式:選擇顯示 BPR 模式(看漲和看跌)或 FVG 模式(看漲和看跌)。 可以隱藏所有圖表分析模式。 以條數過濾:BPR 結構中 FVG 之間的最小/最大距離。 訊號的附加視覺化: 箭頭有 9 種類型可供選擇(標準、細、分形等)或手動輸入 Wingdings 代碼,其表格可以選擇性地顯示在圖表上。 設定顏色、尺寸及其縮放時相對於價格的動態
HMA Trend Professional MT5
Pavel Zamoshnikov
4.25 (4)
Improved version of the free HMA Trend indicator (for MetaTrader 4) with statistical analysis. HMA Trend is a trend indicator based on the Hull Moving Average (HMA) with two periods. HMA with a slow period identifies the trend, while HMA with a fast period determines the short-term movements and signals in the trend direction. The main differences from the free version: Ability to predict the probability of a trend reversal using analysis of history data. Plotting statistical charts for analyzi
Visual Range Directional Force Indicator
AL MOOSAWI ABDULLAH JAFFER BAQER
Range Directional Force Indicator – Designed for You to Optimize! The Range Directional Force Indicator is a cutting-edge tool designed to empower traders by visualizing market dynamics and directional strength. Built to offer insights into market trends and reversals, this indicator is an invaluable asset for traders seeking precision in their strategies. However, it is important to note that this indicator is not optimized, leaving room for you to tailor it to your unique trading preferences.
PZ Trend Trading MT5
PZ TRADING SLU
3.8 (5)
许多盈利交易者不仅知道如何识别市场趋势,而且也能把握趋势建立后的交易机会。 Pz 趋势交易 指标设计用来在趋势行情中尽可能的赚取利润。 已建立的趋势提供了一揽子交易机会,但大多数趋势交易指标完全忽视了它们,让交易者在趋势行情时完全不知道该如何做!一般趋势指标只通知有关的趋势变化,但根本不足以得到卓越的回报. Pz 趋势交易 指标比一般趋势指标显示多达 20 倍的交易 , 因为它注重所谓的市场时机。它不仅显示当前的市场趋势,也有回调,内柱线的突破和调整。它令您在趋势回调之后介入,安全的柱线内突破金字塔加仓,以及发现潜在的反转,和已知的调整。 趋势改变 一个趋势改变在市场方向变化时发生。趋势变化在图表上用带数字的彩色圆圈显示。蓝色 (1) 信号为上涨开始, 而红色 (1) 信号为下跌开始。趋势变化并非评估当前价格动作的结果, 它意味着交易设置是不定时地。如果您正确使用本指标, 在趋势变化时, 您将将已经入场 (参看下面的调整)。 回调 但凡趋势在运动中,行情上下抖动,盈利者收割利润,且其它参与者入场。趋势回调代表好的买入机会,通常是由主力获利离场导致。如果行情在回调后回归上行, 指标将
Owl Smart Levels MT5
Sergey Ermolov
4.03 (32)
MT4版本  |   FAQ Owl Smart Levels Indicator 是一個完整的交易系統,包含 Bill Williams 的高級分形、構建正確的市場波浪結構的 Valable ZigZag 以及標記準確入場水平的斐波那契水平等流行的市場分析工具 進入市場和地方獲利。 策略的详细说明 指示灯使用说明 顾问-贸易猫头鹰助手助理 私人用户聊天 ->购买后写信给我,我会将您添加到私人聊天中,您可以在那里下载所有奖金 力量在於簡單! Owl Smart Levels 交易系統非常易於使用,因此適合專業人士和剛開始研究市場並為自己選擇交易策略的人。 策略和指標中沒有隱藏的秘密公式和計算方法,所有策略指標都是公開的。 Owl Smart Levels 允許您快速查看進入交易的信號,突出顯示下訂單的水平並向您發送有關已出現信號的通知。 優點很明顯: 清楚地顯示主要和更高時間框架的趨勢方向。 指示儀器信號的出現。 標記開單、止損設置和固定利潤的水平。 沒有多餘的,只有必要的結構! ZigZag 表示全球趨勢的方向,因此也表示貿易方向。 市場反轉點的短線清楚地表明在什麼水平上構建斐波那
Manus Pro
Itumeleng Mohlouwa Kgotso Tladi
MANUS PRO EA The Trading Revolution You've Been Waiting For Are you TIRED of watching other traders make consistent profits while your account bleeds red?   The financial markets don't wait for anyone – and neither should you. MANUS PRO isn't just another Expert Advisor... it's your   TICKET TO FINANCIAL FREEDOM . Why MANUS PRO is Different (And Why Everyone's Talking About It) FOR BEGINNERS: Your Trading Mentor That Never Sleeps Zero Learning Curve   – Install, activate, and watch it wo
FX Order Flow MT5
Carl Gustav Johan Ekstrom
5 (1)
This powerful tool is engineered to transform the way traders analyze currency strength. Built for every experience level, it offers clear, actionable guidance on when to trade and in which direction. Its versatility extends across all currency-related symbols, including gold (XAU/USD) and bitcoin (BTC/USD). By delivering deep, data-driven insights, it empowers traders to make smarter, more confident decisions. Whether you're a beginner or a seasoned professional, this indicator equips you with
用於確定平面和趨勢的指標。 如果價格低於兩條直方圖和兩條線(紅色和藍色)中的任何一條,則這是一個賣出區域。 購買此版本的指標時,一個真實賬戶和一個模擬賬戶的 MT4 版本 - 作為禮物(收到,給我寫私信)! 如果價格高於兩條直方圖和兩條線(紅色和藍色)中的任何一條,則這是一個買入區域。 MT4 版本: https://www.mql5.com/en/market/product/3793 如果價格在兩條線之間或在任何直方圖的區域內,那麼市場就沒有明確的趨勢。簡單地說,市場是平的。 指標的工作在屏幕截圖中更清楚地顯示。 該指標可用作獨立的交易系統。該指標可用於獲取領先數據或確定當前趨勢的方向。對於任何級別的交易者來說,這都是一個很好的工具!
Introducing to your attention the unique trading system/indicator "Scaled Vidya Trends", designed for dynamic scalp trading on trend volatility pairs hour + timeframes. Main features of Scaled Vidya Trends: -Multi-level market analysis: it works on H1, H2, H3 timeframes; -Uses the most popular currency pairs: EURUSD, GBPUSD, USDCAD. Brokers usually set one of the lowest spreads for these pairs; -Applies a scalping method based on local targets for signals; -Signals appears at the new open of
Introduction to the Manual Backtesting Indicator on MQL5 The MetaTrader platform provides an excellent backtesting tool for evaluating Expert Advisors (EAs). However, when it comes to manually backtesting a strategy to assess its effectiveness, this tool has some limitations: You cannot manually draw zones or trend lines while in backtesting mode. You cannot switch timeframes to check time alignment. For example, if my strategy requires additional confirmation from a higher timeframe (HTF), this
The new update makes this indicator a complete tool for studying, analyzing and operating probabilistic patterns. It includes: On-chart Multi-asset percentage monitor. Configurable martingales. Twenty-one pre-configured patterns, including Mhi patterns and C3. An advanced pattern editor to store up to 5 custom patterns. Backtest mode to test results with loss reports. Trend filter. Hit operational filter. Martingale Cycles option. Various types of strategies and alerts. Confluence between patter
Noize Absorption Index
Ekaterina Saltykova
Noize Absorption Index - is the manual trading system that measures the difference of pressure between bears forces and bulls forces. Green line - is a noize free index that showing curent situation. Zero value of index shows totally choppy/flat market.Values above zero level shows how powerfull bullish wave is and values below zero measures bearish forces.Up arrow appears on bearish market when it's ready to reverse, dn arrow appears on weak bullish market, as a result of reverse expectation.
Gold Trend 5
Sergei Linskii
4 (3)
黄金趋势 - 这是一个很好的股票技术指标。该指标算法分析资产的价格走势,并反映波动性和潜在进入区。 最佳指标信号: - 卖出 = 红色柱状图 + 红色短指针 + 同方向黄色信号箭头 + 紅色趨勢方向箭頭 。 - 买入 = 蓝色柱状图 + 蓝色多头指针 + 同方向水蓝色信号箭头 + 藍色趨勢方向箭頭 。 该指标的优点 1. 该指标生成的信号准确度高。 2. 只有当趋势发生变化时,才能重新绘制已确认的箭头信号。 3. 您可以在任何经纪商的 MetaTrader 5 交易平台上进行交易。 4. 您可以交易任何资产(货币、金属、加密货币、股票、指数等)。 5. 最好在 M15-H1 时间框架(中期交易)上进行交易。 6. 在指标设置中可更改个别参数(TF、颜色等),以便每位交易者都能轻松定制适合自己的指标。 7. 该指标既可作为交易系统的主要补充,也可作为独立的交易系统使用。   注意:交易的入場準確性和盈利能力僅取決於交易者的技能。 任何指標都只是交易者的助手,而不是行動指南。黃金法則 - 根據趨勢開單,獲利並等待下一個最佳訊號。 MetaTrader 4 黄金趋势指标版
Inguz
Maxim Kuznetsov
Ing (inguz,ingwar) - the 23rd rune of the elder Futhark ᛝ, Unicode+16DD. Add some runic magic to your trading strategies. The correct marking of the daily chart will indicate to you the successful moments for counter-trend trading. Simple to use, has high efficiency in volatile areas. Be careful in lateral movements. Signals ᛝ are generated when the main lines of construction intersect. Red arrow down - recommended sales Blue up arrow - recommended purchases rare purple arrows indicate exce
Max Min Delta Indicator - Market Volume Imbalance Analysis Gain Deeper Insights into Market Volume Imbalance with Delta Analysis What is the Max Min Delta Indicator? The Max Min Delta Indicator is a powerful market volume analysis tool that visually represents maximum and minimum delta values using a histogram. It helps traders identify market strength, weakness, absorption, and aggressive buying/selling activity with precision. Key Features Histogram Visualization: Displays Max Delta (Green) an
PREngulfing
Slobodan Manovski
PR EA - 吞没形态交易系统 自动识别吞没形态,均线确认信号 PR EA是一款MetaTrader 5专家顾问,专门用于识别并交易看涨/看跌吞没形态,并通过移动平均线过滤确认信号。优化适用于30分钟图表,同时兼容M15和H1时间框架。 核心功能: 形态识别 - 精准检测有效的吞没K线形态 趋势确认 - 238周期SMA过滤器(参数可调) 风险管理 - 自定义止损、止盈 + 可选追踪止损 时间框架优化 - 专为M30图表设计(兼容M15/H1) 仓位控制 - 同一时间仅持有一个仓位 推荐设置: 最佳表现:M30时间框架 不建议使用:高于H1的时间框架 自定义选项: 可调整交易手数 灵活设置止损/止盈值 追踪止损功能 均线周期调节 点差过滤,避免低效执行 适合以下交易者: 偏好自动K线形态交易 需要均线确认的反转策略 波段交易(30分钟-1小时图表) 规则明确的交易系统 "通过均线确认的吞没形态交易信号" MT5专用 • 需MetaTrader 5平台 • 兼容所有经纪商
Trade Extender
Loncey Duwarkah
5 (1)
Autonomously executes trades, overseeing the entire process from initiation to completion.  Free support via chat, email and remote assistance Originally built for XAUUSD (Gold). Settings changes for other symbols Powerful rules management Enhanced positioning features Risk Management / Dynamic lot sizing Quick Setup Symbols : XAUUSD Investment for all: Our trading bot is crafted to serve traders of all investment levels, ensuring accessibility to the forex market even for those with limited fu
Riko Trend mt5
Nadiya Mirosh
The Riko Trend indicator is a revolutionary trend trading and filtering solution with all the important features of a trend tool built into one tool! The Riko Trend indicator is good for any trader, suitable for any trader for both forex and binary options. You don’t need to configure anything, everything is perfected by time and experience, it works great during a flat and in a trend. The Riko Trend indicator is a technical analysis tool for financial markets that reflects the current price f
Your Trend Friend
Luigi Nunes Labigalini
5 (1)
The trend is your friend! Look at the color of the indicator and trade on that direction. It does not  repaint. After each candle is closed, that's the color of the trend. You can focus on shorter faster trends or major trends, just test what's most suitable for the symbol and timeframe you trade. Simply change the "Length" parameter and the indicator will automatically adapt. You can also change the color, thickness and style of the lines. Download and give it a try! There are big movements w
Volume Profile V6
Andrey Kolesnik
4.67 (3)
市场的成交量曲线指标+一个智能振荡器. 它适用于几乎所有工具-货币对,股票,期货,加密货币,实际交易量和报价。 您可以设置配置文件范围的自动定义,例如,一周或一个月等。,并通过移动边界(两条垂直线红色和蓝色)手动设置范围。 示为直方图。 此级别直方图的宽度有条件地意味着在其上进行的交易数量。 使用"模式水平线颜色"参数,您可以设置自动显示价格可能会击退的最重要交易量水平,而最大颜色参数则分别显示整个设定范围内最大交易量的水平。     智能振荡器显示超买和超卖区域,它分析来自多个指标的信息,并根据处理的数据,以适当的颜色为超买和超卖区域着色。     在Volume every day中,您可以使用Range period参数设置构建配置文件的时间范围,并使用Range count参数设置这些范围的配置文件数量。 例如,Range period=1day,Range count=10表示配置文件将基于一天的周期,即最后十天。 重要的是,切换图表的时间框架不会影响配置文件的构建,这也是该指标的一个额外优势。      该指标非常简单易用,同时尽可能提供信息。 有了这个指标,做市商将
Visual Bronze Path Indicator
AL MOOSAWI ABDULLAH JAFFER BAQER
Bronze Path Indicator The Bronze Path Indicator is a powerful yet customizable trading tool designed to help traders identify potential market opportunities using advanced technical analysis. This indicator provides a clear visual representation of buy and sell signals, ensuring traders can make informed decisions based on market conditions. Please note that this indicator is not optimized; it is created for you to fine-tune and optimize it according to your trading strategy and preferences. Ho
该指标建立当前报价,可以与历史报价进行比较,并在此基础上进行价格走势预测。指示器有一个文本字段,用于快速导航到所需日期。 选项: 符号 - 选择指标将显示的符号; SymbolPeriod - 选择指标从中获取数据的时段; IndicatorColor - 指示器颜色; HorisontalShift - 由指标绘制的报价移动指定的柱数; Inverse - true 反转引号,false - 原始视图; ChartVerticalShiftStep - 图表垂直移动(键盘上的向上/向下箭头); 接下来是文本字段的设置,您可以在其中输入日期,您可以通过按“回车”立即跳转到该日期。 接下来是文本字段的设置,您可以在其中输入日期,您可以通过按“回车”立即跳转到该日期。
该产品的买家也购买
AriX
Temirlan Kdyrkhan
1 (4)
AriX Indicator for MT5 A powerful trend-following and signal-evaluation tool AriX is a custom MT5 indicator that combines Moving Averages and ATR-based risk/reward logic to generate clear buy/sell signals. It visualizes dynamic SL/TP levels, evaluates past trade outcomes, and displays win/loss statistics in a clean on-chart panel. Key features include: Buy/Sell signals based on MA crossovers ATR-based SL/TP1/TP2/TP3 levels with visual lines and labels Signal outcome tracking with real-time stat
ARICoins
Temirlan Kdyrkhan
ARICoin is a powerful trading companion designed to generate high-probability entry signals with dynamic TP/SL/DP levels based on volatility. Built-in performance tracking shows win/loss stats, PP1/PP2 hits, and success rates all updated live. Key Features: Buy/Sell signals with adaptive volatility bands Real-time TP/SL/DP levels based on ATR Built-in MA Filter with optional ATR/StdDev volatility Performance stats panel (Success, Profit/Loss, PP1/PP2) Alerts via popup, sound, push, or email Cust
TrendMaestro5
Stefano Frisetti
note: this indicator is for METATRADER4, if you want the version for METATRADER5 this is the link:  https://www.mql5.com/it/market/product/108106 TRENDMAESTRO ver 2.5 TRENDMAESTRO recognizes a new TREND from the start, he never makes mistakes. The certainty of identifying a new TREND is priceless. DESCRIPTION TRENDMAESTRO identifies a new TREND in the bud, this indicator examines the volatility, volumes and momentum to identify the moment in which there is an explosion of one or more of these da
##   ONLY GOLD ##   Тiльки Золото ## **Mercaria Professional Trading Zones - Complete Guide** ## **Mercaria Professional Trading Zones - Повний посібник** ### **How Mercaria Zones Work / Як працюють зони Mercaria** **English:** Mercaria Zones is an advanced trading indicator that identifies high-probability support and resistance areas using ZigZag extremes combined with mathematical zone calculations. The indicator works on multiple timeframes simultaneously, providing a comprehensive view
获取 免费 AUX 指标和 EA 支持   直接下载 — 点击这里 [ D.I.C.E ] The DICE Indicator   Divergence in Chaos Environment 是一款专为使用艾略特波浪理论并结合混沌交易技术的交易者设计的 MT5 专用工具。它识别价格行为中的隐藏和常规背离,并与比尔·威廉姆斯所描述的混沌市场环境同步。 主要特征 艾略特波浪背离检测:检测符合波浪结构的看涨和看跌背离,以提高波浪计数精度。 混沌技术集成:与混沌交易策略相结合,确保信号与 AO 指标和市场结构一致。 多时间框架扫描:跨不同时间框架分析背离以确认动能变化和趋势耗尽。 可视化警报和对象:图表中清晰的箭头、线条和标记,便于快速识别。 自适应市场读取:自动适应混沌市场条件,过滤噪音并保留有效信号。 突破回调入场技术:使用简单的斐波那契回撤和枢轴点的常见交易方法。 优势 结合背离信号与波浪进程,提高入场精度。 利用 AO 混沌背离逻辑确认可能的第 3–5 波完成。 提前识别反转或延续区域,降低风险。 实时自动发现修正区,低风险高回报。 通过清晰的视觉确认增强交易信心。
Pantera Indicator
Temirlan Kdyrkhan
5 (1)
A tool for on-chart strategy backtesting and performance analysis. A utility for developing, debugging, and testing custom trading ideas and indicator functions. An indicator designed to quickly test trading concepts and visualize the effectiveness of different input parameters. An all-in-one sandbox for testing everything from simple crossovers to complex, multi-condition trading systems.
Hello I Want to introduce The Forex Buy Sell Arrow Premium MT5 i recently release this premium indicator! its 1000% Non Repaint Indicator, It Work Perfectly Well,, i tested it day by day, Just mind blowing Result,  Including Powerful trend Algorithm! How It Work? well, it work market trend formula, when trend Bullish Or when trend Bearish,  Recommend Timeframe M30, H1 it work all timeframe, and all currency pair, 100% non repaint, How to take signal From Forex Buy Sell Arrow Premium Ind
Enigma 112
issam rahhal sabour
Enigma 112 Indicator - User Manual Enigma 112 Indicator Complete User Manual - Ultimate Trading Solution Introduction The Enigma 112 is a comprehensive multi-timeframe trading indicator that combines advanced technical analysis concepts including Tesla 3-6-9 Gates, Huddleston Theory, PO3 Dealing Ranges, and sophisticated risk management systems. Tesla 3-6-9 Gates Based on Nikola Tesla's vortex mathematics for precise support and resistance levels Huddleston Theory Volume-based market
VTrende Pro
Andrii Diachenko
5 (1)
VTrende Pro - MTF indicator for trend trading with a display panel for MT5 *** Videos can be translated into any language using subtitles (video language - Russian) Although the signals of the VTrende Pro indicator can be used as signals of a full-fledged trading system, it is recommended to use them in conjunction with the Bill Williams TS. VTrende Pro is an extended version of the VTrende indicator. Difference between Pro version and VTrende: - Time zones - Signal V - signal 1-2 waves -    S
秒级Tick蜡烛图生成器 是一款专为高频交易和短线炒单设计的专业级MT5指标工具。它能够将原始Tick数据实时转换为高度可定制的秒级K线图,帮助交易者精准捕捉市场微观波动,优化入场和出场时机。该工具能为您提供清晰的图表展示,让您更直观地识别价格行为模式,提升交易决策效率。 核心功能亮点: 灵活的时间间隔设置:支持自定义秒级K线生成周期(如1秒、5秒、10秒等),适应不同交易策略需求,尤其适合超短线交易者。 真实的Tick数据还原:基于原始报价数据生成蜡烛图,确保数据准确性,避免因数据合成导致的信号失真。 实时买卖价显示:直接在图表上标注当前买价(Ask)和卖价(Bid),便于快速观察市场流动性及点差变化。 直观的视觉设计:采用清晰的蜡烛图配色(涨跌颜色区分)和专业的技术指标叠加,提升图表可读性。 适用场景: 高频交易(HFT):捕捉毫秒级价格变动,优化算法交易策略。 短线炒单(Scalping):快速进出场,利用微小波动获利。 为什么选择本产品? 传统分钟级或小时级图表无法满足超短线交易需求,而本工具填补了这一空白,让您能够像专业做市商一样,基于最精细的市场结构制定策略。无论是手动交易
Pan PrizMA CD Phase
Aleksey Panfilov
The Expert Advisor and the video are attached in the Discussion tab . The robot applies only one order and strictly follows the signals to evaluate the indicator efficiency. Pan PrizMA CD Phase is an option based on the Pan PrizMA indicator. Details (in Russian). Averaging by a quadric-quartic polynomial increases the smoothness of lines, adds momentum and rhythm. Extrapolation by the sinusoid function near a constant allows adjusting the delay or lead of signals. The value of the phase - wave s
Классификатор силы тренда. Показания на истории не меняет. Изменяется классификация только незакрытого бара. По идее подобен полной системе ASCTrend, сигнальный модуль которой, точнее его аппроксимация в несколько "урезанном" виде, есть в свободном доступе, а также в терминале как сигнальный индикатор SilverTrend . Точной копией системы ASCTrend не является. Работает на всех инструментах и всех временных диапазонах. Индикатор использует несколько некоррелируемых между собой алгоритмов для класси
FFx Universal Strength Meter PRO is more than a basic strength meter. Instead of limiting the calculation to price, it can be based on any of the 19 integrated strength modes + 9 timeframes. With the FFx USM, you are able to define any period for any combination of timeframes. For example, you can set the dashboard for the last 10 candles for M15-H1-H4… Full flexibility! Very easy to interpret... It gives a great idea about which currency is weak and which is strong, so you can find the best pai
The FFx Universal MTF alerter shows on a single chart all the timeframes (M1 to Monthly) with their own status for the chosen indicator. 9 indicators mode (MACD-RSI-Stochastic-MA-ADX-Ichimoku-Candles-CCI-PSAR). Each can be applied multiple times on the same chart with different settings. Very easy to interpret. Confirm your BUY entries when most of the timeframes are showing green color. And confirm your SELL entries when most of the timeframes are showing red color. 2 Alert Options : input to s
FFx Watcher Pro MT5
Eric Venturi-Bloxs
The FFx Watcher PRO is a dashboard displaying on a single chart the current direction of up to 15 standard indicators and up to 21 timeframes. It has 2 different modes: Watcher mode: Multi Indicators User is able to select up to 15 indicators to be displayed User is able to select up to 21 timeframes to be displayed Watcher mode: Multi Pairs User is able to select any number of pairs/symbols User is able to select up to 21 timeframes to be displayed This mode uses one of the standard indicators
FFx Patterns Alerter gives trade suggestions with Entry, Target 1, Target 2 and StopLoss .... for any of the selected patterns (PinBar, Engulfing, InsideBar, OutsideBar) Below are the different options available: Multiple instances can be applied on the same chart to monitor different patterns Entry suggestion - pips to be added over the break for the entry 3 different options to calculate the SL - by pips, by ATR multiplier or at the pattern High/Low 3 different options to calculate the 2 TPs -
FFx Basket Scanner MT5
Eric Venturi-Bloxs
MetaTrader 4 version available here : https://www.mql5.com/en/market/product/24881 FFx Basket Scanner is a global tool scanning all pairs and all timeframes over up to five indicators among the 16 available. You will clearly see which currencies to avoid trading and which ones to focus on. Once a currency goes into an extreme zone (e.g. 20/80%), you can trade the whole basket with great confidence. Another way to use it is to look at two currencies (weak vs strong) to find the best single pairs
MetaTrader 4 version available here: https://www.mql5.com/en/market/product/25793 FFx Pivot SR Suite PRO is a complete suite for support and resistance levels. Support and Resistance are the most used levels in all kinds of trading. Can be used to find reversal trend, to set targets and stop, etc. The indicator is fully flexible directly from the chart 4 periods to choose for the calculation: 4Hours, Daily, Weekly and Monthly 4 formulas to choose for the calculation: Classic, Camarilla, Fibonac
Pendiente de Precio
Cesar Juan Flores Navarro
Indicador en base a la pendiente de la linea de precio, dibuja una línea de color cuando sube a base de los precios que previamente has sido procesados o linealizados, y cuando baja la pendiente la linea linealizada toma otro color. En este caso se a considerado 6 lineas de diferentes procesos desde pendientes largas hacia las cortas, observándose que cuando coincidan las pendientes se produce un máximo o mínimo, lo que a simple vista nos permitirá hacer una COMPRA O VENTA.
WanaScalper
Isaac Wanasolo
1 (1)
A scalping indicator based on mathematical patterns, which on average gives signals with relatively small SL, and also occasionally helps to catch big moves in the markets (more information in the video) This indicator has three main types of notifications: The first type warns of a possible/upcoming signal on the next bar The second type indicates the presence of a ready signal to enter the market/open a position The third type is for SL and TP levels - you will be notified every time price re
Индикатор Coefficient Of Determination (COD) представляет собой значение коэффициента детерминации или квадрат коэффициента корреляции между зависимой переменной — ценой и объясняющей переменной — тиковым объемом. Что это дает нам на практике? COD отлично распознает кульминацию трендовых движений, что позволяет подбирать оптимальные точки и ловить развороты рынка. Как использовать индикатор: Наиболее популярная торговая стратегия строится совместно с трендовым индикатором Moving Average (MA), пе
Fibonacci Multiple 12
Cesar Juan Flores Navarro
Fibonacci Múltiple 12, utiliza la serie fibonacci plasmado en el indicador fibonacci, aumentadolo 12 veces según su secuencia. El indicador fibonacci normalmente muestra una vez, el presente indicador se mostrara 12 veces empezando el numero que le indique siguiendo la secuencia. Se puede utilizar para ver la tendencia en periodos cortos y largos, de minutos a meses, solo aumentado el numero MULTIPLICA.
Recommended TimeFrame >= H1. 100% Non Repainted at any moment.  Use it carefully, only with Trend Direction. Trading Usage: 2 Variants: as Range System or as BreakOut System (Both Only With Trend Direction)::: (Always use StopLoss for minimise Risk); [1] as Range System: (Recommended) in UP TREND:  - BUY in Blue Line , then if price goes down by 50 points (on H1) open Second BUY.   Close in any Profit you wish: TrailingStop(45 points) or Close when Price touches upper Gold Line. in DOWN TREND
Linea Horizontal Inteligente
Cesar Juan Flores Navarro
En base a cálculos matemáticos de determino una linea Horizontal que cruza a todas las señales de trading, mostrando los máximos y mínimos. La linea horizontal parte en dos las subidas y bajadas de las señales de trading, de tan manera que es fácil identificar los máximos y mínimos, y es inteligente por que es sensible a las subidas y bajadas, afín de no quedarse en un solo lado por siempre, trabaja excelentemente con otros indicadores suavizadores ya que les garantiza que en un intervalo de tie
Spike Detector
Tete Adate Adjete
this indicator is a Spike detector indicator, it is specially designed to trade Boom 1000, Boom 500, Crash 1000 and Crash 500 We recommend using it on Deriv Boom and Crash indices only Its setting is intuitive, familiar, easy to use it has notification functions; audible notifications and push notifications. this tool is simple to use, easy to handle This update is based on different strategies for spikes
AutoSignals Trend Panel
Danilo Maia Siqueira
指標基於每個圖表時間的6個信號,跟踪同一資產的5個不同圖表時間的趨勢。 該指標的主要目的是向我們展示放置該金融資產的多數趨勢。 系統在數個圖形時間中傳輸趨勢信息,這樣用戶可以廣泛查看資產的移動,這種工具通過幫助操作員執行訂單使用戶具有較高的命中率 支持趨勢。 指标基于每个图表时间的6个信号,跟踪同一资产的5个不同图表时间的趋势。 该指标的主要目的是向我们展示放置该金融资产的多数趋势。 系统在数个图形时间中传输趋势信息,这样用户可以广泛查看资产的移动,这种工具通过帮助操作员执行订单使用户具有较高的命中率 支持趋势。 Zhǐbiāo jīyú měi gè túbiǎo shíjiān de 6 gè xìnhào, gēnzōng tóngyī zīchǎn de 5 gè bùtóng túbiǎo shíjiān de qūshì.
Limitless MT5
Dmitriy Kashevich
Limitless MT5 is a universal indicator suitable for every beginner and experienced trader. works on all currency pairs, cryptocurrencies, raw stocks Limitless MT5 - already configured and does not require additional configuration And now the main thing Why Limitless MT5? 1 complete lack of redrawing 2 two years of testing by the best specialists in trading 3 the accuracy of correct signals exceeds 80% 4 performed well in trading during news releases Trading rules 1 buy signal - the ap
Panel Visao axetrend
Danilo Maia Siqueira
trend view panel; AutoSignals Trend The indicator tracks the trend in 5 different chart times for the same asset, based on 6 signals for each chart time. The main objective of the indicator is to show us the majority trend of the financial asset in which it was placed. The system transmits the information of the trends in different graphic times, in this way the user is able to have a wide view of the movement of the asset, this type of tool makes the user have a higher hit rate by helping
Escalera Inteligente
Cesar Juan Flores Navarro
Indicador en MQL5, recibe la información del precio SUAVIZADO, lo procesa anulando los picos inteligentemente, y el resultado lo envía al desarrollo de la escalera que iniciara y subirá o bajara según el peldaño o INTERVALO ingresado Ingreso PERIODO = 50 (variar segun uso) Ingreso MULTIPLICA AL PERIODO = 1 (variar segun uso) Segun la configuración la escalera puede pegarse o separarse de los precios,, Se aplica toda la linea de tiempo, y a todas las divisas, etc.  
Fibonacci Suavizado
Cesar Juan Flores Navarro
Indicador en MQL5, que obtiene el promedio de 10 EMAS, que son alineadas según Fibonacci, obteniendo un promedio, que sera suavizado.  Se puede ingresar un numero desde 2 a N, que multiplica a los EMA-Fibonacci. Funciona en cualquier criptomoneda, etc. etc... pudiendo calcular el futuro segun la tendencia de las EMAS. Funciona excelentemente en tramos largos, determinando exactamente el mejor inicio/salida. El precio inicial por apertura sera por un periodo de tiempo, luego aumentará.
作者的更多信息
Canal H Pro
N'da Lemissa Kouame
NuageTrend Pro
N'da Lemissa Kouame
Nuage Trend Pro – 趋势跟踪与Kijun信号 Nuage Trend Pro 是一款针对 MetaTrader 5 的高级指标,能够快速识别 强势市场趋势 ,并通过 Kijun 交叉点找到 最佳入场点 。将您的图表转化为 清晰直观的视觉地图 ,让交易更加 精准且自信 。 主要功能 自动Kijun交叉检测 :即时标出价格穿越基准线的关键时刻。 动态趋势云 :图表颜色随市场方向变化——上涨为绿色,下跌为红色。 清晰的买卖信号 :快速捕捉买入和卖出机会。 可自定义设置 :调整 Kijun 周期、趋势云颜色及显示样式,满足您的策略需求。 为什么选择 Nuage Trend Pro? 简单直观的趋势可视化 ,一目了然。 多功能适用 :适用于所有时间周期及交易品种(外汇、指数、商品)。 适合 初学者 和 资深交易者 优化入场和出场策略。 易于与其他指标或交易策略结合 使用。
Weekly Levels Pro
N'da Lemissa Kouame
中文 (Chinois) – Weekly Levels Pro Weekly Levels Pro – 每周关键水平 是一个简单而强大的 MetaTrader 5 指标,专为自动显示每周最重要的四个交易水平而设计: 本周最高价 (Weekly High) → 自然阻力位 本周最低价 (Weekly Low) → 自然支撑位 本周开盘价 (Weekly Open) → 趋势参考点 本周收盘价 (Weekly Close) → 多空强弱指标 主要特点: 每周自动更新,无需手动操作 图表上清晰可见,直观易读 快速识别主要支撑位和阻力位 适用于外汇、指数、大宗商品和加密货币 简单参数,无复杂设置 为什么选择 Weekly Levels Pro? 周线水平被专业和机构交易者广泛使用,用于识别: 突破与反转区域 战略性的进场和出场点位 趋势延续或修正的信号
Pin Bar Pro v1
N'da Lemissa Kouame
Pin Bar Pro v1.0 – MQL5 指标 描述: Pin Bar Pro 是一个专业的 MetaTrader 5 指标,可自动识别 Pin Bar(针形线) ,帮助预测市场反转。信号直接显示在图表上: 蓝色箭头 → 买入信号(看涨 Pin Bar) 红色箭头 → 卖出信号(看跌 Pin Bar) 功能: 自动识别 Pin Bar 可自定义箭头 ( Arrow_Up_Code , Arrow_Down_Code ) 可调节垂直偏移 ( Arrow_Offset_Pts ) 支持所有品种和时间周期 参数: 参数 描述 默认值 Arrow_Up_Code 买入箭头 Wingdings 代码 233 Arrow_Down_Code 卖出箭头 Wingdings 代码 234 Arrow_Offset_Pts 垂直偏移(点数) 10 作者: KOUAME N’DA LEMISSA 版本: 1.0 – 可用于 MQL5
1. 中文 (Chinois simplifié) 指标 Monthly Levels + Pin Bar Pro 描述 Monthly Levels + Pin Bar Pro 指标结合了 月度关键水平 (高点、低点、开盘、收盘) 与 价格行为反转形态 (Pin Bar) 的自动检测。 它专为技术交易者和机构交易者设计,帮助预判市场反应区,并在图表上生成清晰直观的交易信号。 主要功能 自动绘制月度水平 :高点、低点、开盘、收盘。 实时 Pin Bar 检测 (看涨 & 看跌)。 直观的可视化显示 :水平线 (月度) + 箭头 (信号)。 ️ 可自定义参数 :时间周期、箭头样式、大小、偏移。 高效优化 :低资源消耗,适合剥头皮和波段交易。 ️ 兼容 EA :可集成到自动化交易策略中。 ️ 使用方法 将指标添加到任意时间周期的图表。 系统会自动显示 月度高点、低点、开盘价、收盘价 。 观察信号: 蓝色箭头 → 看涨 Pin Bar (接近月度支撑)。 红色箭头 → 看跌 Pin Bar (接近月度阻力)。 结合趋势、成交量等过滤条件提高准
Yearly Levels Pro
N'da Lemissa Kouame
3️⃣ 中文 (Chinese) 版本: 1.0 开发者: KOUAME N'DA LEMISSA 平台: MetaTrader 5 (MT5) 类型: 技术指标 / 年度价格水平 描述: Yearly Levels Pro v1.0,由KOUAME N'DA LEMISSA开发,是一款强大的指标,可快速识别年度关键价格水平。它自动计算指定年份的 开盘价、最高价、最低价和收盘价 ,并在图表上以彩色水平线显示。 主要功能: High(红色)、Low(蓝色)、Open(绿色)、Close(橙色) 通过 Year_Shift 选择年份 支持所有交易品种和时间周期 实时自动更新 参数: Year_Shift : 0 = 当前年,1 = 上一年,依此类推 亮点: 简单直观 帮助识别年度支撑/阻力 适合长期交易分析 使用建议: 使用High/Low线识别支撑和阻力区域 将当前价格与Open/Close比较,分析趋势 可结合K线形态或其他指标确认信号
Quarterly Levels Pro
N'da Lemissa Kouame
Chinese Version (中文) Quarterly Levels Pro v1.0 – 商业通知 产品名称: Quarterly Levels Pro v1.0 开发者: KOUAME N'DA LEMISSA 版本: 1.0 描述: Quarterly Levels Pro 由 KOUAME N'DA LEMISSA 开发,是 MetaTrader 5 的专业指标,可自动显示季度的 High, Low, Open 和 Close 水平。它可以帮助交易者清晰地在图表上查看关键支撑和阻力区,便于中期交易决策。 主要功能: 自动显示季度 High, Low, Open 和 Close 水平。 每个水平的可自定义颜色: High: 红色 Low: 蓝色 Open: 绿色 Close: 橙色 可调线宽以便视觉区分。 可通过 Quarter_Shift 参数显示 当前、上一个或更早季度 的水平。 兼容 MT5 上的所有货币对和金融工具。 参数: 参数 描述 默认值 Quarter_Shift 显示到上一个季度:0 = 当前季度, 1 = 上一季度, 等等 0 交易者优势: 快速
中文 (Chinois simplifié) 描述 Multi-Timeframe Levels Pro v1.0 自动在图表上绘制关键的 日线、月线、季度线和年线 高低开收水平。 这些水平对于识别重要的支撑位、阻力位和突破区域非常有用。 主要功能 自动显示 Daily / Monthly / Quarterly / Yearly 水平 不同颜色标记 High、Low、Open、Close 可自定义 Shift 分析历史周期 适用于所有市场: 外汇、指数、大宗商品、股票、加密货币 轻量快速,适合 Price Action、波段交易、剥头皮 参数 DailyShift → 当前或前一天 MonthlyShift → 当前或前一个月 QuarterlyShift → 当前或前一个季度 YearlyShift → 当前或前一年 使用建议 高时间框架(季度、年度)用于关键区域;低时间框架(日线、月线)适合短线交易。
Marubozu Pro MT5
N'da Lemissa Kouame
Commercial Description – Marubozu Pro (MT5) Description Marubozu Pro is a professional indicator for MetaTrader 5 that automatically detects Marubozu candles (bullish and bearish) directly on your chart. It helps traders identify strong market momentum where buyers or sellers take full control, by displaying clear visual arrows for buy and sell signals. This tool is designed to be simple, effective, and fast , perfect for manual trading or as a filter in automated strategies. Key Features
2️⃣ Version Chinois ETE Detector – 头肩形指标 (Head & Shoulders Indicator) 将图表转化为清晰可操作的交易机会! 指标介绍 ETE Detector 自动识别 头肩顶 (H&S) 和 倒置头肩 (IH&S) 图形——经典趋势反转形态。 无需手动寻找图形,您的分析将变得 快速、精准、可视化 。 功能亮点 自动检测 趋势反转图形 彩色箭头 :绿色 表示买入(倒置头肩),红色 表示卖出(头肩顶) 自动绘制 颈线 ,显示突破区域 “”标签 标记肩部和头部,直观显示图形 图表上直接显示 文字说明 : "H&S – 卖出" 或 "倒置H&S – 买入" 交易者优势 节省时间 :无需手动寻找图形 决策更可靠 :提前发现趋势反转 清晰可视化 :完整图形一目了然 适用于 所有市场和时间周期 易于自定义 ,适应个人交易风格 ️ 可调参数 参数 描述 默认值 LookBack 分析的蜡烛数量 300 MinDistance 肩与头之间的最小距离 5 Tolerance 肩部对称公差 (%) 2% BuyColor
Fusion Monthly Levels + PinBar + Marubozu 说明 这个独特的指标将三种强大的技术分析工具融合为一体: 月度关键水平 (高点, 低点, 开盘价, 收盘价) —— 用于识别关键支撑与阻力区域。 PinBar 识别 —— 一种可靠的反转形态,提示价格的强力拒绝。 Marubozu 识别 —— 强烈的趋势型K线,显示出明显的方向性动能。 通过这种融合,您将获得一个 直观、全面且高效 的市场预测工具。 优势 融合机构级别水平 + 价格行为 (Price Action)。 清晰的视觉信号:蓝/红箭头表示 PinBar,蓝/红方块表示 Marubozu。 适用于所有交易品种(外汇、指数、加密货币、大宗商品、股票)。 可自定义参数(参考周期、影线大小、箭头样式)。 代码优化,无延迟,即使在多个图表中使用。 完全兼容 MetaTrader 5。 信号说明 看涨 PinBar → 蓝色箭头在K线下方。 看跌 PinBar → 红色箭头在K线上方。 看涨 Marubozu → 蓝色方块在K线下方。 看跌 Marubozu → 红色方块在K线上方。
ABCD Lemissa + 月线水平 + PinBar + Marubozu 指标 描述 该指标 整合了多种强大工具 ,为市场提供完整的概览: ABCD Lemissa – 自动识别 ABCD 结构 ,标记 A、B、C、D 点、支撑/阻力区域,并显示买入/卖出箭头。 Monthly Levels(月线水平) – 显示月线蜡烛的 High、Low、Open、Close 水平,用于识别关键区域。 PinBar & Marubozu – 自动识别 PinBar 蜡烛 (反转信号)和 Marubozu 蜡烛 (强趋势蜡烛),支持自定义箭头和符号显示。 该指标完全 可视化 ,结合了线条、箭头和矩形,便于分析市场和做出交易决策。 主要功能 ABCD Lemissa 自动识别 A、B、C、D 点 显示 BUY 和 SELL 信号箭头 使用 X1 / X2 矩形高亮支撑和阻力区域 Monthly Levels(月线水平) 显示月线蜡烛的 High、Low、Open 和 Close 每根新蜡烛动态更新 PinBar & Marubozu 自动识别反转蜡烛和强趋势蜡烛 可自定义箭头显示交易信
Order Block Pro MT5
N'da Lemissa Kouame
Order Block Pro (MQL5) – 版本 1.0 作者: KOUAME N'DA LEMISSA 平台: MetaTrader 5 描述: Order Block Pro 是一个高级指标,可自动识别图表上的 多头和空头订单块 (Order Blocks) 。通过分析盘整蜡烛及随后强势的冲击蜡烛,该指标帮助交易者识别价格可能加速的关键区域。 适合希望以下目标的交易者: 精准确定进出场点。 发现动态支撑和阻力区域。 提升风险管理和交易策略。 主要功能: 多头订单块检测: 在盘整蜡烛之后的强势上涨蜡烛处显示绿色箭头。 空头订单块检测: 在盘整蜡烛之后的强势下跌蜡烛处显示红色箭头。 完全可自定义: 最大蜡烛实体比例 ( BodyMaxRatio ) 下一根蜡烛最小比例以确认走势 ( NextCandleMinPct ) 箭头偏移量 ( Arrow_Offset_Pts ) Marketplace 准备就绪: 优化且干净的代码,符合 MQL5 Marketplace 标准。 输入参数: 参数 描述 Arrow_Up_Code Wingdings 上箭头代码 (默认: 233
ETE Detector v4.0 (Head & Shoulders) Author: KOUAME N’DA LEMISSA Version: 4.0 Platform: MetaTrader 5 Indicator Type: Chart / Visual Trading Signals Overview The ETE Detector v4.0 is a technical indicator designed to automatically detect classic and inverse Head & Shoulders patterns (H&S) on MT5 charts. These patterns are widely used to anticipate trend reversals. With this tool, traders can: Detect sell signals (classic H&S) and buy signals (inverse H&S) with accuracy. Easily visualize patterns
ETE Detector puissant
N'da Lemissa Kouame
中文 – 商业说明 Logiciel – ETE DETECTOR POWER v5.0 自动识别“头肩形态” PUISSANCE DU DÉTECTEUR ETE v5.0 是专业交易工具,帮助交易者 提前捕捉市场重要反转 ,利用最强大的图表形态之一: 头肩形态(H&S)及其反转形态 。 Fonctionnalités MaxObjects ,即使在繁忙图表或多时间框架下,指标仍然保持流畅和清晰。 主要功能 实时自动识别 经典 H&S (卖出) et H &S (买入) 清晰显示 肩部、头部和颈线 自动绘制 反转区域 (红色 = 卖出,绿色 = 买入) ACHETER/VENDRE 箭头 即时显示交易机会 智能循环对象管理,避免图表拥堵 完全可自定义参数:分析蜡烛数量、肩头最小距离、对称容差、最大图形数量、矩形样式、标记大小和颜色 交易者优势 节省时间:自动分析市场 高精度:可调容差确保仅识别可靠形态 可视性最佳:彩色区域、箭头、标签和颈线 兼容所有策略:波段、日内、剥头皮 Version :不会拖慢 MT5
Dynamique mensuelle des plages hautes et basses v1.0 Auteur : KOUAME N'DA LEMISSA Description : L' indicateur dynamique mensuel de fourchette haute et basse affiche les niveaux mensuels clés sur votre graphique grâce à des fonctionnalités avancées de suivi dynamique. Il permet aux traders de visualiser facilement les zones de support et de résistance mensuelles, ainsi que les zones où le prix tend à dépasser ou à tester ces niveaux, offrant ainsi des opportunités de trading précises. P
每月高低动态范围 + 流动性区域 v1.2 作者: KOUAME N'DA LEMISSA 描述: 使用此强大的指标提升您的市场分析能力,它结合了: 关键月度水平: 高点(High)、低点(Low)、开盘(Open)和收盘(Close),用于识别最重要的支撑和阻力区域。 动态高低范围: 自动追踪极端价格波动,检测重要市场变动。 流动性区域: 可视化矩形显示流动性集中区(买/卖)。这些区域的厚度和颜色可完全自定义,以确保图表上最佳可见性。 适用于所有交易品种和经纪商: 可在外汇、股票、指数和加密货币中完美运行。 主要功能: 自动检测月度 High、Low、Open 和 Close 水平。 显示动态高低范围以追踪极端波动。 可视化流动性区域,可自定义边框厚度和颜色。 支持所有时间周期。 完全可配置的参数,可根据您的交易风格进行调整。 指标设置: Ref_Timeframe: 用于计算水平的参考时间周期(默认:Monthly)。 Ref_Shift: 参考K线(0 = 最新已完成的K线)。 LiquidityBuyColor / LiquiditySellColor: 买入/卖出流动性区
Structure de fusionBlocsAuto + MensuelOU 结构力量与月度精度结合 产品说明 Fusion StructureBlocksAuto + MonthlyOR 是一个集成的高级指标,将 市场结构分析 (自动检测 swing 高点/低点 与结构区块)与 月度开盘区间 (Plage ouverte mensuelle, MOR ) 键的月度水平,帮助你实时识别高概率交易区和市场动力的变化。 使用此工具你可以 : 自动识别 支撑/阻力结构区块 balançoire 通过自动连接 swing 显示月度的:开盘价、高点、低点和收盘价水平 检测 Monthly Open Range 的突破水平 将 市场结构 + 月度背景 结合起来以获取更强的确认 主要功能 支持与阻力结构区块的自动检测 动态绘制月度开盘、最高、最低、收盘水平 在主要 swing点间绘制趋势线 提供 Open Range 高点与低点视图以追踪初始动能 区块半透明显示,图形渲染平滑 优化设计,实现最小滞后与重算 适用于所有时间周期与交易品种 (外汇、
Channel Ultima
N'da Lemissa Kouame
Channel Ultima – 动态多级通道指标 简短描述 Canal Ultima s'en charge . ​晰显示 支撑位、阻力位及平衡区 ,非常适合技术型和结构化交易者。 详细介绍 Channel Ultima s'appelle Channel Ultima . ​ 短期通道 :快速市场波动 中期通道 :中等趋势 长期通道 :整体市场结构 算法自动识别 重要高低点 ,计算 上/中/下线 ,并 动态延伸 以实时跟踪市场走势。 目的与优势 可视化 多层次市场结构 识别 流动性区和反转区 指导 突破或反弹的入场和出场 可与其他指标配合确认信号(Kijun, Donchian, FZG) Channel Ultima 提供 市场视觉指南针 ,对结构化交易策略至关重要。 主要特点 三个独立通道(短期、中期、长期) 自动识别 枢轴高低点 动态 上/中/下线 自动延伸至最新蜡烛 颜色区分明显, 一目了然 适用于 所有资产和时间框架 轻量快速,实时计算 ️ 可自定义参数 参数 描述 LookbackBars 用于枢轴检测的蜡烛数量 Swi
nstitutional Liquidity Map Pro — votre compas pour tous les aspects institutionnels de votre économie ! Institutional Liquidity Map Pro — 专业流动性地图指标 Carte de liquidité institutionnelle Pro 是一款为专业交易者打造的强大工具,帮助您实时识别市场中的 流动性区域 与 机构资金行为 。 主要功能 : 自动识别 流动性区域 (高点/低点、假突破、吸流动作) 支持所有周期(M1 et MN1) Blocs de commande ) ​ ​ 提供 流动性突破提醒 和 价格反应提示 与任何指标或策略兼容 ️ 优势: 直观展示市场结构,揭示"聪明资金"位置 适用于外汇、指数、加密货币、黄金等多种市场 图形化展示清晰易懂,新手也能快速上手 专为 Smart Money Concepts (SMC) 与 ICT交易理念 设计 Institutional Liquidity Map Pro ——
筛选:
无评论
回复评论