TrendHarmony MTF Trend Phase Level Visualizer MT5

TREND HARMONY MT5 – Multi Timeframe Trend and Phase and Pullback Level Visualizer indicator for Metatrader5

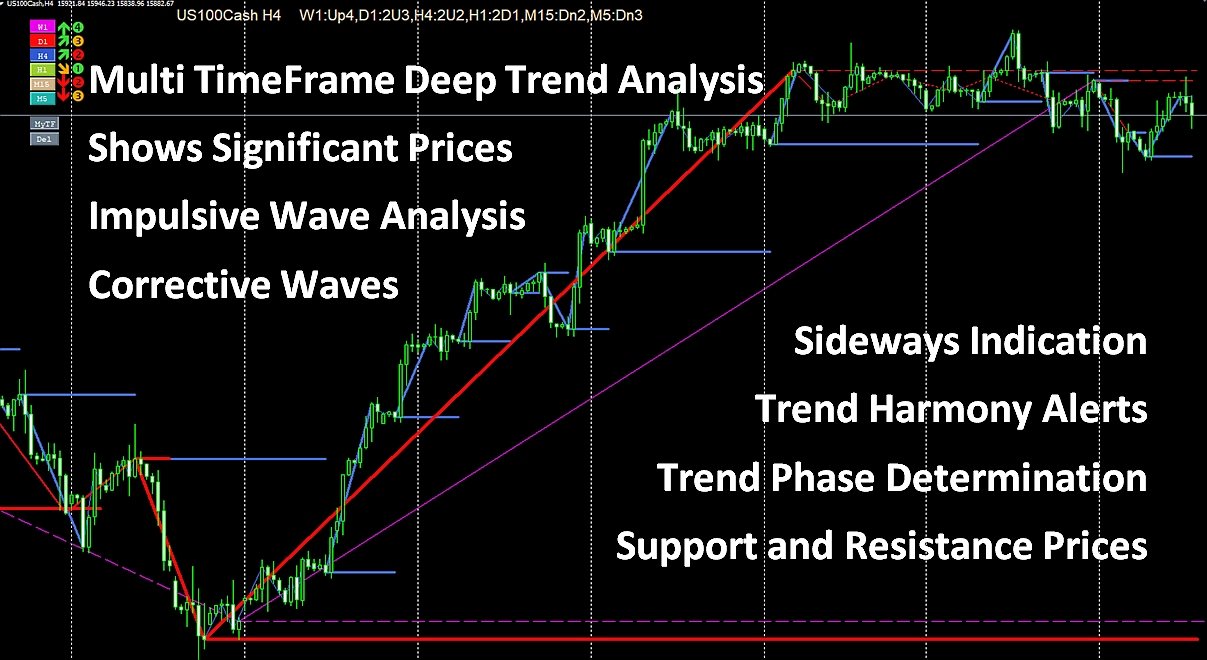
The TREND HARMONY indicator automates deep trend analysis and generates visualizations for you. Take control of your trades by eliminating uncertainty! Revolutionize your trading experience with precision and insight through the TREND HARMONY Multi Timeframe indicator – your ultimate MT5 trend visualization indicator.

[ Features and Manual | MT4 version | All Products ]


Are you tired of missing trading opportunities or consistently entering the market at the wrong time, resulting in missed profits or feeling overwhelmed by market complexities? Look no further – the TREND HARMONY MTF Trend & Phase Visualizer indicator is here to enhance your trading experience!

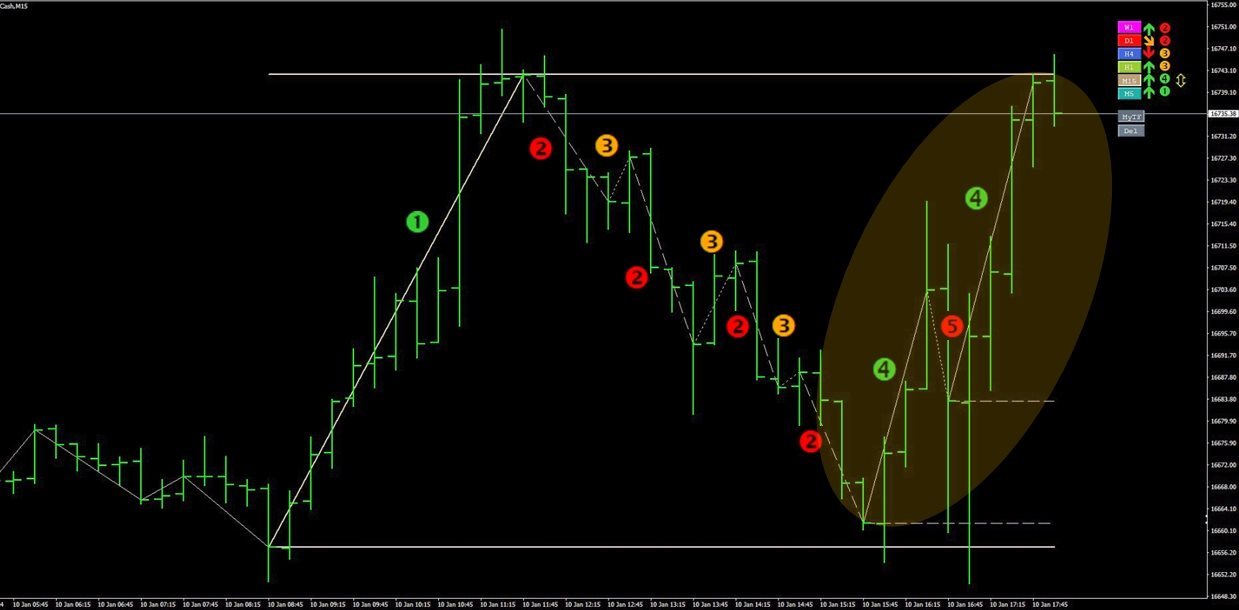
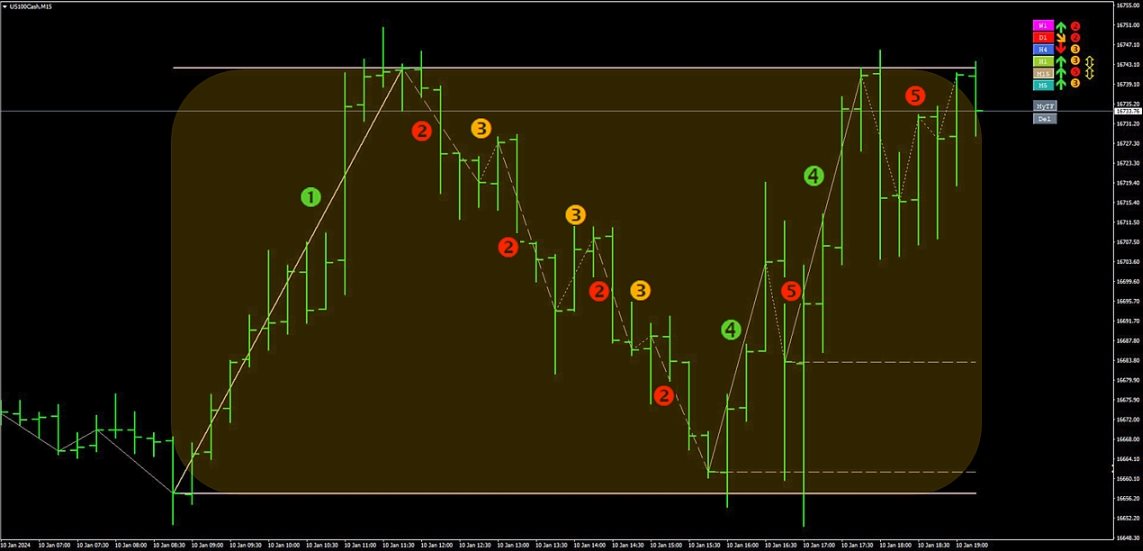
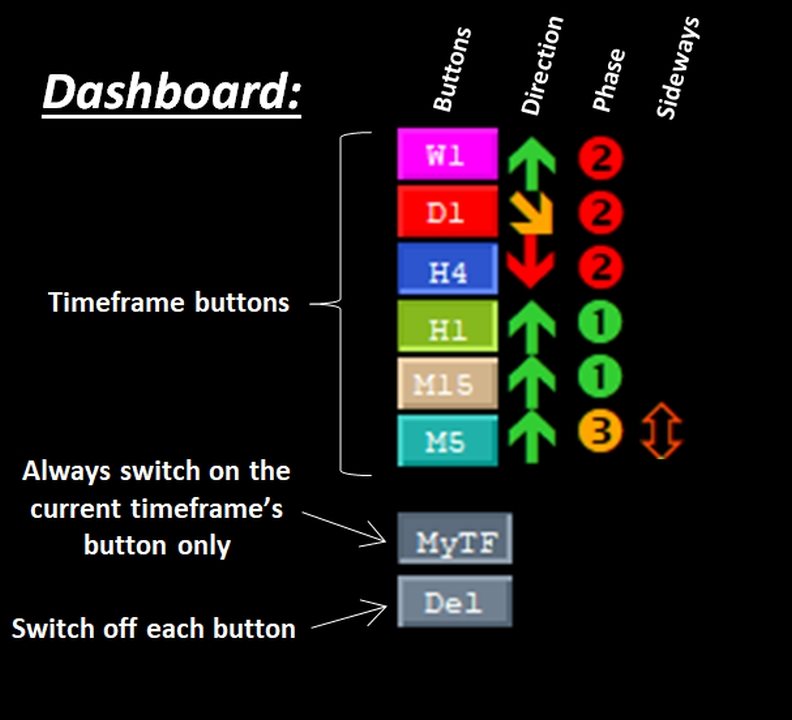
Unlock the potential of your trading journey with the TREND HARMONY MTF Trend & Phase Visualizer indicator, a tool designed to support both novice and seasoned traders. By simultaneously analyzing 6 different timeframes, this indicator helps navigate various trend phases of a given instrument.

Key features:

·         Multi-Timeframe Analysis:

Analyze your chosen instrument effortlessly across 6 different timeframes simultaneously. Gain a holistic view of market trends, empowering well-informed decision-making and optimizing trading focus.

·         Trend Identification:

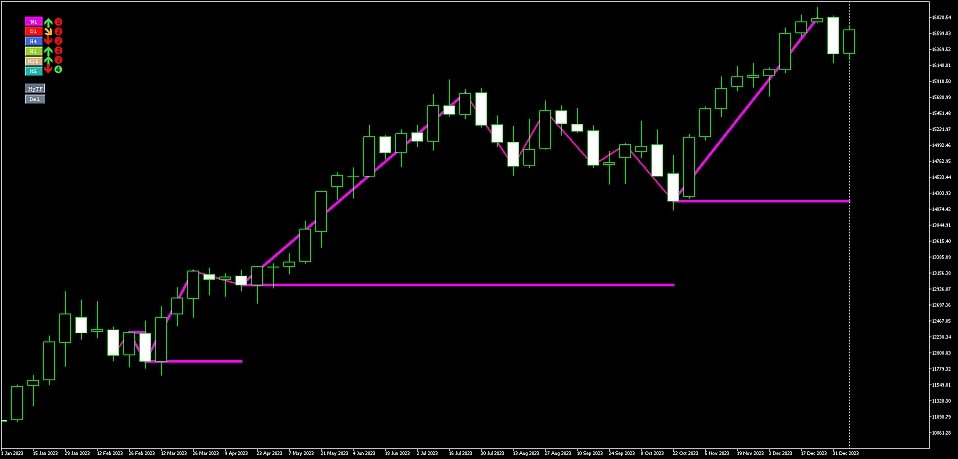
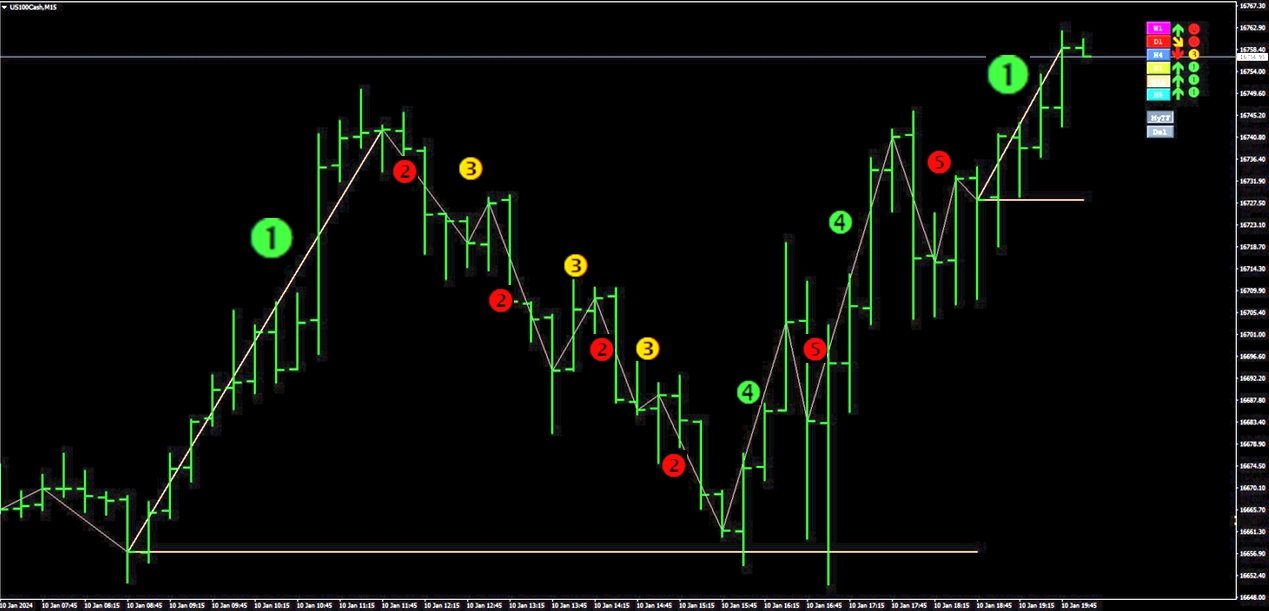
Our advanced algorithm accurately identifies and illustrates trend waves. Visualize market trends in unprecedented detail, enabling you to ride the waves of success.

·         Trend Phase Determination:

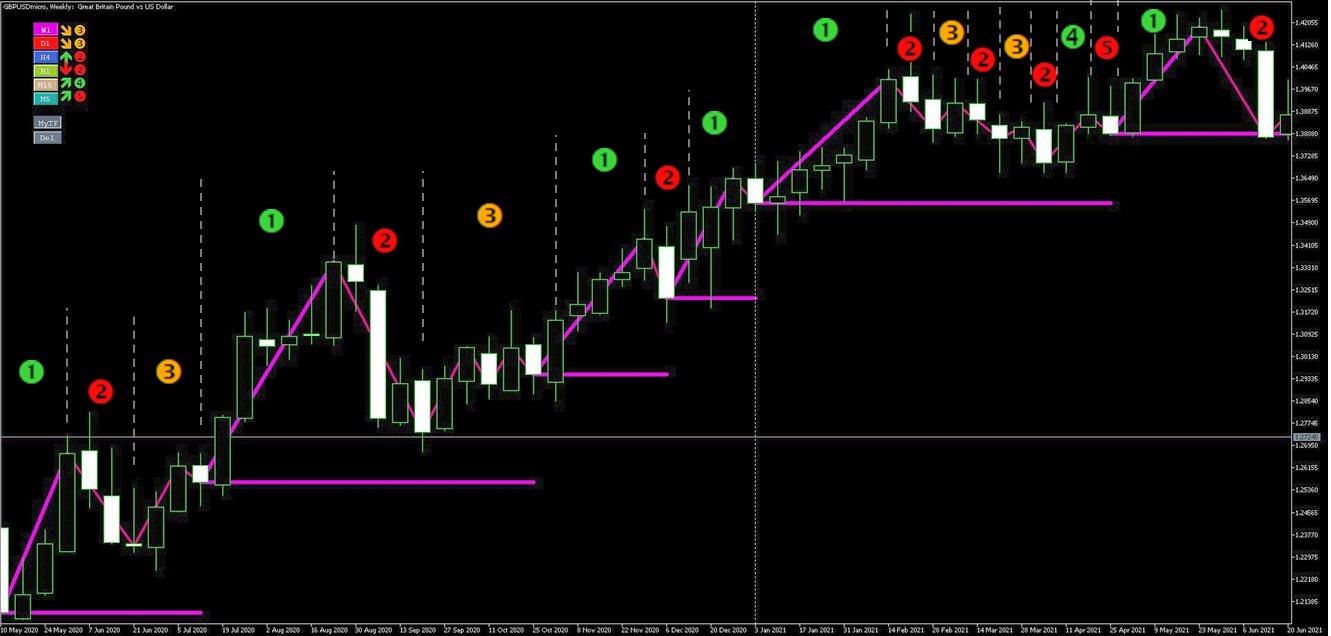
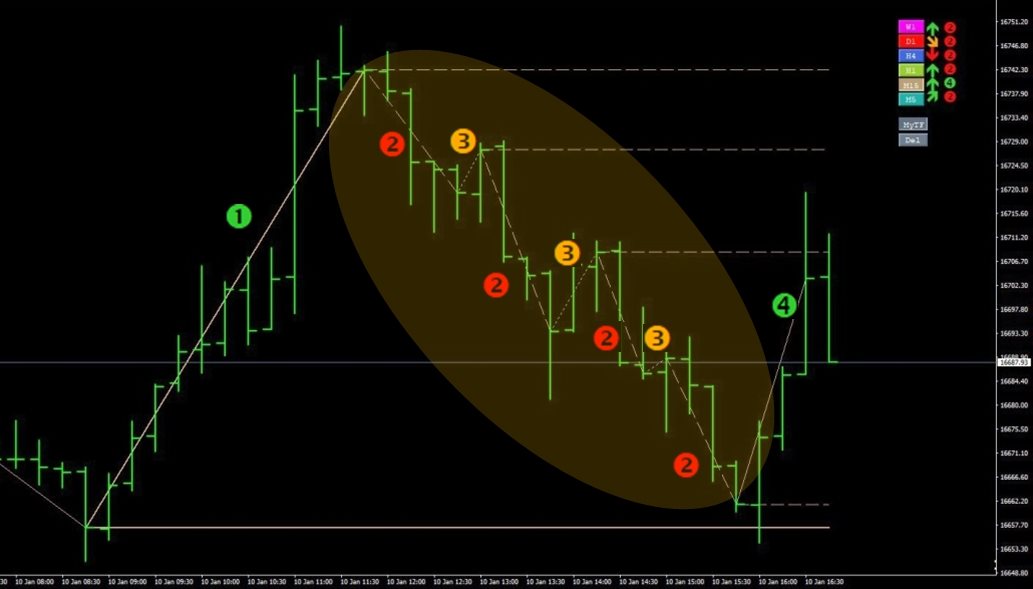
Easily determine the trend phases of a specific instrument by analyzing 6 timeframes simultaneously, allowing strategic adaptation. Clearly differentiate between impulsive, corrective and reversing phases enhancing understanding of market dynamics.

·         Sideways Signalization:

The indicator signals when the market enters Sideways phase, preventing you from entering trades when it's best to stay on the sidelines.

·         Filtering of False breakout and fake trend changes:

You can set flexible threshold for filtering out false breakouts and fake trend changes, By cleaning out such "noises" you can see and trust well established trends better.

·         Signals if TrendHarmony is formed or ended:

The indicator displays arrows and sends notifications when all timeframes are in the same direction and in expansive or trend continuation phase.

·         Indication of retarcement levels while waves forming:

You can efforlessly identify retracement (support/resistance) levels in corrective waves, in trend reversal phases and in case of trend changes.


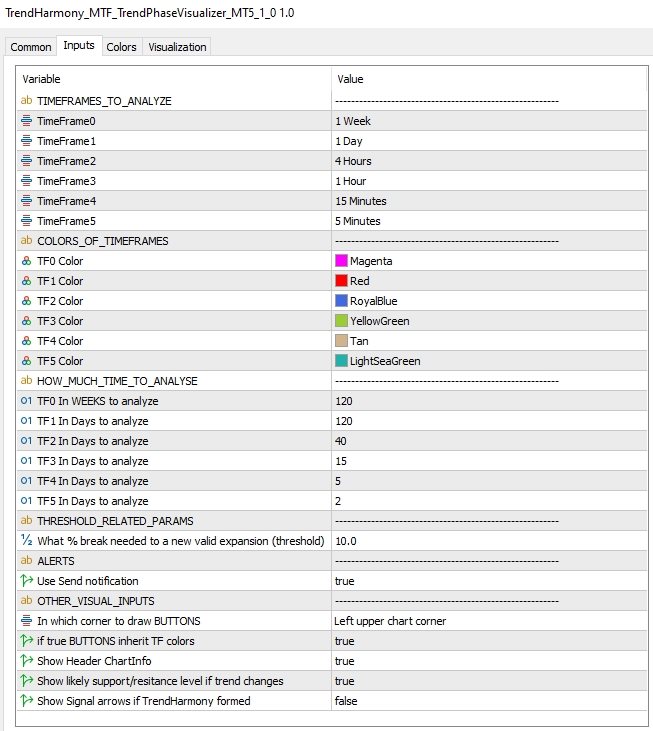
**For proper operation please make sure historical data is downloaded for every timeframe or reduce analyzed period (at  HOW_MUCH_TIME_TO_ANALYSE inputs)!**


NOTE: TREND HARMONY - MTF Trend & Phase Visualizer is compatible with MetaTrader 4 and is designed to enhance, not replace, your trading strategy. Trade responsibly!


For MT4 Version: Click here.

For more detail please Click here.


Thank you!

推荐产品
Aurum mid quant pro
N'da Lemissa Kouame
AURUM MID-QUANT PRO v5.60 Quantitative Excellence for Gold (XAU/USD) & Volatility Trading Gain a professional edge over institutional markets with AURUM MID-QUANT PRO , an advanced Price Action Pattern Detection and Breakout Engine designed exclusively for MetaTrader 5 . Built specifically to capture the unique volatility of Gold (XAU/USD) and other major financial instruments, this powerful indicator combines high-precision algorithmic pattern recognition with real-time dynamic accumulation z
KEYPAD SUPPORT RESISTANCE LOGIC MT5 Advanced Cluster-Based Support & Resistance • Multi-Timeframe Confirmation • Smart Market Analysis Stop relying on ordinary horizontal lines and isolated support/resistance levels. KEYPAD SUPPORT RESISTANCE LOGIC MT5 is an advanced technical-analysis indicator designed to help traders identify important support clusters, resistance clusters, market structure, trend direction, momentum and multi-timeframe confluence from one organized MT5 dashboard. Instead of
Introduction to Fractal Pattern Scanner Fractal Indicator refers to the technical indicator that makes use of the fractal geometry found in the financial market. Fractal Pattern Scanner is the advanced Fractal Indicator that brings the latest trading technology after the extensive research and development work in the fractal geometry in the financial market. The most important feature in Fractal Pattern Scanner is the ability to measure the turning point probability as well as the trend probabil
Please feel free to join this Telegram group where users can share their strategies and settings that work for them using this indicator --> t.me/MTFMACS ALSO AVAILABLE ON TRADINGVIEW The MTFMACS family is now available on TradingView for users who prefer charting on that platform. Contact me via the Telegram group for direct access. ————————————————————————————————— BEFORE YOU PURCHASE — PLEASE READ A free version of this indicator is available. Please purchase this paid version only if you
Bom Senso
Adier Antonio Pereira
BomSenso 是一款市场分析指标,专为希望做出更加系统化决策、减少单纯依赖“盘感”的交易者而开发。 它能够同时、综合地分析多个时间周期中的价格行为。系统不会孤立地观察单一时间周期,而是将短期价格动态与更广泛的市场环境以及波浪结构结合起来,从而形成对当前市场状态的综合分析。 每次分析时,系统都会识别与近期历史中已经出现过的行为模式相似的市场结构,并计算其历史上出现延续或反转的概率(买入、卖出或中性)。 除了概率之外,系统还提供: 分析置信度 相似历史案例的准确率 平均预期收益 Forward 验证准确率 当前趋势环境 与重要支撑位和阻力位的距离 波浪层信号,包括当前价格在摆动结构中的相对位置 所有信息都会清晰地显示在图表面板中,并自动更新。当置信度达到用户设定的阈值时,系统还会发出声音提醒。 核心价值 BomSenso 不是一个简单的箭头指标,也不是一个承诺“保证买入或卖出”的系统。 它更像是一个 概率与市场环境过滤器 ,帮助交易者回答这样一个问题: “这种结构,在当前的趋势和波浪环境下,过去是否曾经出现过?而在那之后,市场通常发生了什么?” 通过结合: 市场行为通道分析 同步多时间
The  OBV MTF  is an Enterprise-grade On-Balance Volume indicator that transforms standard OBV into a complete trading system. It combines gradient-aware momentum analysis, divergence detection, multi-timeframe alignment, and dynamic customisable midpoint-filtering in a single intuitive professional volume analysis tool. Core Features 1. 5-State Momentum Engine Aqua (Strong Bullish) : OBV slope rising with positive acceleration SteelBlue (Weak Bullish) : OBV rising but losing momentum Gray (Neutr
EventStraddle - 经济数据公布前后的双向突破策略 功能概述 在经济数据公布前数分钟,于价格上下同时挂出停损买入与停损卖出订单;市场向哪 一侧突破就保留哪一侧,撤销另一侧,然后用基于 ATR 的追踪止损持有。其余时间 不交易。 运作方式 1. 公布前 15 分钟读取 ATR(H1,14),在正负 1.0 ATR 处挂出双向停损订单。 2. 每个订单的止损距其入场价 2.0 ATR。 3. 一侧成交后立即撤销另一侧(OCO)。 4. 浮盈达到 1.0 ATR 后,止损跟随价格保持 0.5 ATR 距离。 5. 持仓最长 24 小时后强制平仓。 事件日程 公布日期已内置于 EA 中:无需外部文件、无需联网,也无需从卖方持续获取数据。 涵盖美联储、欧洲央行、英格兰银行、日本银行、澳洲联储、新西兰联储、加拿大央行 的利率决议,以及美国非农、美国 CPI、美国零售销售、初请失业金、EIA 原油库存、 美国长期国债拍卖、英国 CPI 与瑞士 CPI。 事件按图表品种的构成货币自动匹配,因此可用于任何品种。EventFilter 可缩小到 您需要的事件。启用 CalendarE
Pattern Builder Pro — MetaTrader 5 自定义摆动形态扫描器 Pattern Builder Pro 是一款 MetaTrader 5 指标和市场扫描工具,允许交易者手动绘制任意自定义摆动形态(swing pattern),并在市场观察窗口的所有品种、多个时间周期上实时扫描相似的价格形态。与仅支持头肩形、三角形、旗形等固定形态的传统图表形态指标不同,这款 MT5 形态识别工具让您自行定义价格行为形态——任意数量的摆动点、任意形状——并通过包含 11 项加权指标的相似度引擎(含动态时间规整 DTW 与普氏分析 Procrustes)实时查找匹配设置。 主要功能: 交互式形态绘图板,基于 XY 网格,可像素级精确放置摆动点 多指标相似度引擎:几何形状、角度序列、斜率、回撤比例、扩展比例、摆动数量比、宽高比、趋势方向、结构顺序与波段振幅顺序 可选启用动态时间规整(DTW)与普氏分析,实现与尺寸、方向无关的形态匹配 当日最高价/最低价(HOD/LOD)点验证,精确过滤交易设置 异步市场扫描——可在 M5 至 D1 多个周期扫描数百个品种而不卡顿终端 可排序、分页的
Informative Trend
Vitalii Zakharuk
the fundamental technical indicator Informative Trend, which allows you to assess the current market situation in order to enter the market of the selected currency pair in a trend and with minimal risk. It basically uses the process of identifying the rate of change in price growth and allows you to find entry and exit points from the market. The indicator was created on the basis of the original indicators for searching for extreme points and is well suited for determining a reversal or a la
Rejection Zone Predictor PRO – MT5 Indicator Identify where price is most likely to react before it gets there. Rejection Zone Predictor PRO is a price-action based MetaTrader 5 indicator designed to automatically locate and rank potential BUY rejection/support zones below the current market price and SELL rejection/resistance zones above price . Instead of relying on a single support or resistance calculation, the indicator analyzes multiple forms of price-action confluence to determine which h
Orderflow Super Candles - 简约足迹图指标 平台: MetaTrader 5 (MT5)  (最后一张截图是结合DOM工具配套使用的情况) 1. 产品简介 Orderflow Super Candles 是一款基于底层 Tick 数据分析的专业图表工具,旨在为交易者提供“市场X光”般的深度视角。 通过解析每一根 K 线内部的买卖成交量分布,该指标将隐蔽的市场微观结构可视化。它能帮助交易者透过价格表象,看清机构资金的真实博弈位置,精准识别支撑与阻力位的有效性,从而做出更具逻辑性的交易决策。 2. 核心功能 双重透视模式 买卖量分布 (Buy/Sell Volume): 经典足迹图模式。左侧显示主动卖单,右侧显示主动买单。直观对比每一价格档位的多空力量差异。 净买卖差模式 (Delta Profile): 显示每一价格档位的“买单减去卖单”的净值。绿色代表买方主导,红色代表卖方主导。 自适应缩放技术: 在 Delta 模式下,指标会自动计算当前视野范围内的 Delta 最大绝对值进行动态归一化,确保无论市场波动大小,色块显示都清晰可见。 关键价位自动标注 POC
HTFLiquidityDashboard
Andreas Kindlbacher
HTF Liquidity & Breakout Dashboard – The Ultimate Multi-Symbol Scanner Tired of scanning dozens of charts for crucial liquidity levels? The HTF Liquidity Dashboard is a professional, comprehensive multi-symbol panel for MetaTrader 5. It automatically monitors the most important Higher Timeframe (HTF) levels for up to 29 symbols simultaneously, showing you at a glance where liquidity lies, where breakouts occur, and where lucrative retests form. Originally developed from an Algo Trading conce
CV QuantMarketScreener Pro CV QuantMarketScreener Pro   is a professional multi-asset market screener for MetaTrader 5, developed for institutional-grade market analysis, rapid signal detection, and efficient multi-symbol trading. The screener combines modern market structure analysis, trend filters, volatility evaluation, and advanced visual signal technology in one powerful dashboard system. The integrated screener allows simultaneous monitoring of multiple markets such as: Forex Indices Metal
DYNAMIC TARGET AND SL MATRIX REAL-TIME FOREX DISTANCE ENGINE Stop guessing your SL and TP distance. Start measuring it. Dynamic Target and SL Matrix is a professional Forex analytical tool designed to calculate and display a dynamic distance framework for SL and TP planning directly from live market conditions. The engine continuously analyzes the current BID and converts the market state into a dynamic pip-distance reference, which is then expanded through a configurable multiplier matr
本指标是实践实战交易完善的波浪自动分析的指标 !  案例... 注: 波浪分级用西方叫法不习惯,因受到缠论(缠中说禅)命名方式习惯的影响,我是将基础波浪命名为 笔 ,将二级波段命名为 段 ,同时具有趋势方向的段命名为 主趋段 (以后笔记中都是这种命名方式,先告知大家),但是算法上和缠论关系不大切勿混淆.反映的是本人分析盘面总结的 千变万化纷繁复杂的运行规律 . 对波段进行了标准化定义,不再是不同人不同的浪  ,    对人为干扰的画法进行了排除,在严格分析进场起到了关键的作用 . 使用这个指标,等于将交易界面提升美感,抛弃最原始的K线交易带你进入新的交易层次.如果不是为了交易,在宣传上也将使客户观感提升层次. 指标内容: 1.   基础波浪 (笔) : 首先我们找出了价格波动过程中的基础波动拐点,当然他的有序性低,为下一步的计算提供基础. 2.   二级波段( 段 ) :在基础波浪的基础上,通过算法分析得到层级更明显的二级波段,二级波段为波浪提供了分析基础 3.   波浪( 浪 ): 有着更清晰的趋势,更清晰直观的方向.分析一个波浪是否延续,需要看二级波段的形态,分析二级的构成

NanoTrade Pro
Vadim Podoprigora
NanoTrade Pro NanoTrade Pro   is a state-of-the-art automated trading advisor designed to optimize your trading strategy in the fast-paced financial markets. Leveraging advanced algorithms and real-time data analysis, NanoTrade Pro automates the scalping process, enabling traders to capitalize on small price movements with remarkable precision and efficiency. Basically, the advisor does not use any risk systems with increasing volume or increasing the number of open orders. Before buying, be s
Manzano Squeeze Pro
Patricia Manzano Gomez
7-day free trial available with full functionality. Contact us at info@manzanotrading.com to request yours. Manzano Squeeze Pro is a professional squeeze momentum dashboard for MetaTrader 5. It is designed to identify periods of low volatility where the market is accumulating energy before a significant directional move, and to help traders position themselves in the direction of that move at the earliest possible moment. The core concept behind Manzano Squeeze Pro is volatility compression. Wh
ROC acceleration-deceleration is the manual system for medium-term scalping. Indicator based on custom ROC system which defines bullish/bearish market and especially  acceleration-deceleration of tendention in the market's main direction. Buy arrow is plotted during bearish market when current trend decelerates and sell  arrow is plotted during bullish market when current trend decelerates. Main Indicator's Features Signals are not repaint,non-late or disappear(exept cases when system recalculat
Institutional Fusion Levels(机构融合水平指标) Institutional Fusion Levels 是一款专业的多时间框架支撑与阻力指标,旨在通过前一日、前一周和前一月的市场结构水平,识别高概率的机构价格反应区域。 该指标会自动在图表上绘制基于流动性的关键支撑与阻力区域,并标记出多个高时间框架水平相互融合的强共振区域。这些融合区域通常是重要的机构反应区,价格在这些位置可能出现拒绝、反转或强势延续。 Institutional Fusion Levels 帮助交易者无需手动绘制水平线即可快速识别重要市场结构水平,非常适合日内交易者、波段交易者、聪明资金交易者以及机构风格交易策略使用。 功能特点 • 自动绘制以下关键水平: 前一日最高价(PDH) 前一日最低价(PDL) 前一周最高价(PWH) 前一周最低价(PWL) 前一月最高价(PMH) 前一月最低价(PML) • 识别强机构融合区域: PML + PWL = 最强支撑区域 PMH + PWH = 最强阻力区域 • 多时间框架机构共振分析 • 可自定义显示选项: 显示/隐藏日线水平 显示/隐藏周线水平 显
SunSignal ML — AI Gold Signals with Multi-Timeframe Confluence SunSignal ML is an advanced AI-powered signal indicator purpose-built for XAUUSD gold trading. It combines a proprietary adaptive trend algorithm with six machine learning models trained on confirmed price pivots to produce high-confidence entry signals with multi-timeframe validation. The indicator runs efficiently on M1, M5 and M15 timeframes and is designed for traders who want precision entries guided by data rather than guesswor
賺錢和研究的工具。 交易信號和策略的核心是基於作者的價格預測模式形成算法。適用於任何樂器!輔以基於 MA "九尾狐" 的控制系統,盡可能準確地更新和調整市場、儀器和工作期間的信號。 合格:所有市場中的所有工具(有例外)。 適用對象:對沖基金、基金和資產經理、投資經理、投機者、投資者和利益相關者。 ..................................................................................................................................................................................
Turtle Soup CRT Scanner Pro: A Professional MT5 Price-Action Scanner & Trade Management Dashboard Executive Summary The Turtle Soup CRT Scanner Pro represents a sophisticated convergence of two proven price-action methodologies—Candle Range Theory (CRT) and the Classic Turtle Soup pattern—unified within a single, professional-grade MetaTrader 5 indicator. This is not merely a signal generator; it is a comprehensive trade management ecosystem designed for traders who demand structural integrit
Virgil smc
Habeeb Babatunde Bello
Limited introductory offering Virgil SMC is listed at   $49 . After   30 further purchases , the price advances to   $150 . Early access will not remain at this level. VIRGIL SMART MONEY CONCEPT Institutional Structure. Clear Confluence. High-Impact News Protection. Decisions You Can Trust. Most traders are not losing because they lack effort. They lose because the chart is noisy, the rules are unclear, the signal arrives without context — and because a high-impact news candle can wipe a clean
Automated Supply and Demand Tracker MT5. The following videos demonstrate how we use the system for trade setups and analysis.US PPI, Fed Interest Rates, and FOMC Trade Setup Time Lapse: U.S. dollar(DXY) and Australian dollar vs U.S. dollar(AUD/USD)  https://youtu.be/XVJqdEWfv6s  The EUR/USD Trade Setup time lapse 8/6/23.  https://youtu.be/UDrBAbOqkMY . US 500 Cash Trade Setup time lapse 8/6/23  https://youtu.be/jpQ6h9qjVcU .  https://youtu.be/JJanqcNzLGM ,  https://youtu.be/MnuStQGjMyg,&nbsp ;
DRB Dynamic Range Breakout DRB Dynamic Range Breakout 是一款适用于 MT5 的无重绘指标,旨在识别结构化价格反应区域,并生成经过确认的买入和卖出信号。 信号仅在当前K线收盘后确认。确认后,信号不会重绘、消失或移动到其他K线上。 每个信号都可以显示参考入场价、止损位,以及最多十个可配置的盈利目标。 主要功能 K线收盘后确认的无重绘信号 适用于外汇、黄金、白银、美国指数和加密货币 默认选择外汇配置 可显示买入信号、卖出信号或两者同时显示 八种可选入场方式 八种可选止损方式 可设置 1 至 10 个盈利目标 可根据区域大小调整目标间距 可选 SMA、EMA 和 RSI 过滤器 每个过滤器可独立设置周期和时间周期 可调整每日最大信号数量 实心箭头直接显示在信号K线上 支持信号、目标和止损提醒 自动删除较早的信号,使图表更加整洁 灵活的信号确认 SMA、EMA 和 RSI 过滤器可以分别启用。 当多个过滤器同时启用时,只有在所有选定条件均得到确认后,信号才会出现。 所有过滤器默认关闭,用户可以先使用标准设置,并在需要时增加额外确认条件。 盈利
了解价格可能寻找流动性的位置 Liquidity Reaction Map MT5是一款基于图表的市场分析指标。它根据已确认的价格结构识别潜在的买方流动性区域和卖方流动性区域。 该指标将摆动高低点、等高点和等低点、前一日和前一周高低点、交易时段极值以及心理整数价格整合到一个清晰的流动性地图中。相互接近的价位可以合并,并根据强度、与当前价格的距离以及多个来源的一致程度进行排序。 该指标帮助交易者分析价格可能接近、扫过、拒绝或突破流动性区域的位置。它不会开仓或管理交易。 流动性来源 流动性地图可以从以下来源识别流动性: 已确认的摆动高点和低点 等高点和等低点 前一日高点和低点 前一周高点和低点 已完成交易时段的高点和低点 心理整数价格水平 多个可配置时间周期 买方流动性显示在相关高点上方,卖方流动性显示在相关低点下方。 这些区域是根据历史价格结构计算的估计值。该指标不会访问经纪商订单簿或真实的止损持仓数据。 排序后的流动性区域 检测到的价位会根据以下多个因素进行评估: 支持该价位的枢轴点数量 等高点或等低点的聚集程度 多个来源的一致性 时间周期的重要性 与当前价格的距离 价位的新鲜度 相互
Fibrillar
Vitalii Zakharuk
It is very easy to use the Fibrillar indicator, since the simplest is to look at the chart and act according to the indications of the colored arrows. The algorithm takes into account the measurement of prices, and this method also focuses on measuring each of the price drops (H / C, H / O, LC, LO) - which gives more detailed information, but also more averaged. When calculating this indicator, logarithmic gains are first calculated at the closing price, which allows you to filter out the tren
Break Out Explosion MT5
Hamed Dehgani
5 (2)
开发说明: Break Out Explosion 当前限时折扣中, 下一价格:100$ 符号: USDCHF、USDJPY、XAUUSD、GBPUSD、EURUSD、AUDUSD、GBPJPY(我最喜欢 USDCHF_H1) 时间周期: M15, H1, H4, D1 主要特点: 无重绘、无延迟、趋势信号、多重确认 安全性: 信号包含止损、止盈,并遵循风险回报规则 包含: 免费多周期扫描器(购买产品后,只需通过私信发送截图给我,我会亲自把扫描器文件发送给您。) 完整的交易系统概念: 阅读文章 (完整概念在本文中解释) 产品已升级到 1.5 版本 (我每天在真实账户手动交易,并持续改进这个指标) Break Out Explosion 的 MT4 版本现已上线: https://www.mql5.com/en/market/product/155132 加入讨论 在 MQL5 社区聊天中有一个支持小组。  加入 支持小组 ,与其他用户分享想法、提问或讨论交易策略。 关于 Break Out Explosion Break Out Explosion 是一套完整的交易系统,用于识别与主
Manyal trading system, CovEchoTrend Robot, focuses on reliability and flexibility. By employing statistical analysis methods to study the relationships between the base indicator and market patterns, the system enables a deeper understanding of market processes. Intelligent pattern analysis: The application of statistical data processing helps identify key trend reversal points more accurately, signaling significant market shifts. Informed decision-making is based on the intersection of indicato
Xtrade Trend Detector
Dago Elkana Samuel Dadie
Xtrade Trend Detector is an indicator capable of finding the best opportunities to take a position in any stock market. Indeed, it is a great tool for scalpers but also for Daytraders. You could therefore use it to identify areas to trade, it fits easily on a chart. I use it to detect trends on Big timeframes and take positions on Small timeframes. Don't hesitate to give me a feedback if you test it.
该产品的买家也购买
RelicusRoad Pro MT5
Relicus LLC
4.96 (25)
别再凭猜测做交易。 在同一张图表上看清何时入场、何时离场,以及市场的方向。 RelicusRoad Pro 将近二十种工具整合进一个指标,你可以只开启适合自己交易方式的那几项。 入场清晰。出场清晰。每张图表都有计划。 是不是很熟悉? 你刚买入,价格一分钟后就逆着你运行。 你出场太早,然后眼看着行情在你离场后继续走下去。 图表上有五个指标,给出五种不同的答案。 你的止损全凭猜测。 我们为何开发它 我们做外汇交易已有 18 年。RelicusRoad 背后的核心算法最初是在私下为我们自己的专业交易员圈子开发的。 初衷很个人。我们厌倦了一次次手工画同样的线,违反自己定下的规则,错过图表上真正重要的那一点。 对我们有效的是一致性:每天以同样的方式读图,直到它变成肌肉记忆。RelicusRoad Pro 把这种看盘方式带到你的图表上。 之后我们把它开放给更多交易员,因为一个小圈子能看到的东西有限。 每位交易员都会带来新的问题和想法,好的想法会进入下一次更新。今天其中很多工具之所以存在,是因为我们的交易员提出了需求。 这个社区保持私密且规模不大,同时活跃的交易员保持在 2,000 人以内。有些人使
您好,交易员! 大多数散户交易者依赖于滞后的网页脚本。真正具有交易优势需要机构化的架构。 Astro AI 指标并非标准的图表叠加层。它是一个编译后的神经网络,包含两个代理,直接运行在您的终端上。 以下是该系统背后的具体技术: 1. 代理 1:分析师(图神经网络 - GNN) 市场并非孤立的价格柱;它们是相互关联的数据网络。 功能:代理 1 使用图神经网络来映射这些复杂的非线性关系。 优势:标准指标仅考虑单一的历史移动平均线,而我们的 GNN 可以实时处理深层的市场结构关系,在散户交易量发挥作用之前揭示隐藏的相关性。 2. 代理 2:执行器(近端策略优化 - PPO) 模式识别只是成功的一半。基于当前市场波动做出正确的决策,才是预测模型与滞后模型之间的区别所在。 功能:代理 2 使用 PPO(一种先进的强化学习算法)来确定最佳入场点。 优势:它持续调整交易策略,而非使用静态的“超买”或“超卖”线。它会分析当前市场状况并计算最可能的成交点。 执行桥接:通过 ONNX 集成到交易终端 如果执行速度慢,模式识别就毫无用处。我们已通过 ONNX(开放神经网络交换平台)
Spike Fakeout Detector
Brighton Mufaro Mudzingwa
PainX 400 FAKEOUT DETECTOR MT5 Custom Indicator  ·  Sell-Side Bias  ·  Scalping  ·  RSI(6) Filtered   OVERVIEW   The Spike Fakeout Detector is a non repaint precision technical indicator built exclusively for Crash / PainX synthetic indices on the platform. It is engineered around one of the most consistent and exploitable patterns on this instrument — the false breakout above resistance followed by a sharp price drop. Crash/PainX is a growing index that produces a significant price drop app
Azimuth Pro
Ottaviano De Cicco
5 (7)
Azimuth Pro V2:MT5合成分形结构分析与确认入场 概述 Azimuth Pro 是 Merkava Labs 推出的多层级波段结构指标。四层嵌套波段层级、锚定波段的VWAP、ABC形态识别、三时间框架结构过滤以及收盘确认入场——一个图表,一个从微观波段到宏观周期的完整工作流程。 这不是盲目的信号产品。它是一个以结构为先的工作流程,专为重视位置、背景和时机的交易者打造。 ️ 夏季促销 — 庆祝夏至与 The Oracle Pro 上市:Azimuth Pro 七折优惠,现价 279 美元(原价 399 美元)。限时夏季优惠。 1. V2的变化 合成多时间框架引擎 高时间框架分析从零开始重建,采用与Meridian Pro相同的专有合成架构。更清晰的HTF背景、稳定的实时行为、无经典MTF同步问题。合成引擎还解锁了 固定比率时间框架级联 (x2、x3、x4、x6)——不再在经纪商的固定时间框架之间任意跳转,您可以按图表时间框架的固定倍数分析结构,在每个尺度上保持相同的分形关系。 确认入场箭头 作为稳定且可恢复的执行层而设计的收盘确认箭头。当ABC设置形成且自适应确认逻辑
UZFX {SSS} 超短线智能信号 v5.0 MT5 是一款无重绘的高性能交易指标,专为在快速波动的市场中需要精准、实时信号的超短线交易者、日内交易者和波段交易者设计。该指标由 (UZFX-LABS) 开发,融合了价格行为分析、趋势确认和智能过滤技术,可在所有货币对和时间周期内生成高概率的买卖信号、预警信号以及趋势延续机会。 别再对交易犹豫不决了,开始遵循这一专为追求清晰、精准和纪律性市场执行的交易者设计的结构化信号系统吧。 相信我,这是 MQL5 上最优秀的指标之一,所以千万不要错过!!“为睿智交易者打造的智能信号” 最新 5.0 版本现已发布,价格可能会在未事先通知的情况下上涨至 499.99 美元,所以请尽快入手,以免错失良机!! 最终购买前!如果您想获取免费试用版,请通过 WhatsApp 号码 +923030751987 联系我!! 如果您遇到任何问题“或”有任何不明白的地方,请在私聊中向我咨询!!! 主要功能更新 • 自动买入和卖出信号检测 • 先进的反转识别逻辑 • 潜在市场反转前的预警信号 • 趋势延续确认信号 • 内置风险管理功能,包含入场点、止损点、TP1、
Meravith Scanner
Ivan Stefanov
5 (3)
MERAVITH SCANNER 是一款适用于 MetaTrader 5 的专业金融市场指标,将多种分析工具整合为一个统一的系统。它基于专有的成交量加权平均价格(VWAP)方法自动完成所有计算,完全消除主观判断。 该指标适用于所有资产类别(外汇、股票、指数、大宗商品、加密货币)以及从 M1 到 Monthly 的所有时间周期。其核心原理是价格跟随成交量。MERAVITH 识别机构资金成交量的集中区域,并从该集中区域中推导出数学上精确的价格水平。它不预测,不推测。它只计算。 使用 MERAVITH SCANNER,您可以在 2–3 分钟内扫描全部 28 个主要外汇货币对的所有时间周期。您也可以扫描任何您选择的市场——例如,大约 100 只股票约需 10 分钟。 该指标计算耗尽水平、平衡线、偏差、统计水平以及目标投射。 图表元素 Origin Point 标记所有计算的起始位置。指标会自动将其放置在最佳位置。红色标签(TOP)表示市场高点并带有看跌倾向。绿色标签(BOTTOM)表示市场低点并带有看涨倾向。 Sentiment Line 是一条动态曲线,反映基于成交量加权计算得出的市场情绪。
Meravith MT5
Ivan Stefanov
5 (3)
MERAVITH 是一款适用于 MetaTrader 5 的多周期成交量与流动性指标,它在每一个时间周期上显示趋势、支撑与阻力区域、入场、目标和止损。它为您提供完整的市场流动性地图,一个对冲基金风格的流动性工具,并用专有的成交量加权平均价格方法自动完成全部计算,因此没有主观解读。 适用于外汇、黄金(XAUUSD)、指数和加密货币,适用于所有时间周期。 购买后赠送:一套关于如何用 MERAVITH 交易的视频课程。购买后请给我发消息。 MERAVITH 的功能 分析所有时间周期,并显示每个周期上正在生效的趋势。 标记流动性区域(Volume Equilibrium),即多头与空头成交量相等的位置。 将所有时间周期的流动性水平直接显示在您的图表上。 写出市场的文字分析供您参考。 根据当前趋势计算入场、目标、支撑位和止损。 计算您交易的风险回报比。 按您的账户余额计算仓位大小,并估算潜在利润。 在市场出现重要变化时提醒您:警报、电子邮件和推送到手机的通知。 主要线条 Bullish / Bearish Volume Exhaustion 线:目标位。 趋势线:随趋势改变颜色(多头或空头),显
IQ FX Gann Levels a precision trading indicator based on W.D. Gann’s square root methods . It plots real-time, non-repainting support and resistance levels to help traders confidently spot intraday and scalping opportunities with high accuracy. William Delbert Gann (W.D. Gann) was an exceptional market analyst, whose trading technique was based on a complex blend of mathematics, geometry, astrology, and ancient mathematics which proved to be extremely accurate. We don't offer free or bonus indic
This indicator automatically detects internal & swing market structure, Fibonacci Retracement and Fibo Levels. Features Full internal & swing market structure labeling in real-time Fibonacci Retracement Fibonacci Levels After purchasing the indicator, the full source code is provided, and via indicator buffers it can be easily integrated into your Expert Advisors (EAs) for automated trading strategies.
First time on MetaTrader, introducing IQ Star Lines, an original Vedic Astrology Based Intraday Trading Indicator. We don't offer free or bonus indicators in exchange of reviews from you. You won't need any free products with this indicator to make it work. ;) Enjoy! Welcome to the new and updated  IQ Star Lines , the ultimate fusion of ancient planetary cycles and modern quantitative trading, published for the first time on Metatrader. This is an indicator built by the developer, who has spent
Volume Arrow Signal Product Description Volume Arrow Signal is a smart trading indicator designed to help traders identify potential buy and sell opportunities using price action, volume behavior, and directional arrow signals. The indicator places clear arrows directly on the chart, making it easy to spot possible market reversals, trend continuations, and entry opportunities without spending hours analyzing charts manually. Whether you are trading Gold (XAUUSD) , Forex pairs, Indices, or Crypt
Gem SIGNAL
Shengzu Zhong
5 (1)
GEM Signal Pro GEM Signal Pro 是一款適用於 MetaTrader 5 的趨勢跟隨指標,專為希望在圖表上獲得更清晰訊號、更有結構的交易設定,以及更實用風險管理的交易者而設計。 它不僅僅顯示一個簡單的箭頭,GEM Signal Pro 還能以更清晰、更易讀的方式呈現完整的交易思路。當條件確認完成後,指標可在圖表上顯示進場價、止損價與止盈目標,幫助交易者更有效率地評估交易設定。 運作方式 該指標首先根據其內部邏輯識別有效的初始訊號。 當確認條件滿足後,GEM Signal Pro 會在圖表上顯示完整的交易設定。這讓交易者可以更清楚地看到交易結構,並減少手動分析與計算的工作量。 圖表上的交易價位 對於已確認的訊號,GEM Signal Pro 可顯示: 進場價 止損價 止盈 1 止盈 2 止盈 3 風險報酬比 這讓交易設定更容易理解,也有助於讓圖表分析更有條理。 內建風險管理 風險管理是此指標設計的重要部分。 止損位基於近期市場結構,結合附近的擺動高低點與可選的 ATR 緩衝距離。這能讓交易價位更貼近當前市場條件,而不只是依賴固定距離。 圖表資訊面板 GEM Si
ORB Seeker MT5
Marcela Goncalves De Oliveira
特价促销,限量供应,保持产品稀缺性! 仅售 599 美元! 购买后请联系我以获取奖励的 ORB Seeker EA 和个人优化设置文件。 自信地捕捉干净利落的比赛片段! ORB Seeker MT5 是一款专业的开盘区间突破 (ORB) 指标,专为追求准确性、简洁性、灵活性和清晰图表结构的交易者而设计。 它能自动绘制任何交易品种的盘前或自定义交易时段区间,然后给出清晰的突破信号,包括入场点、止损点、止盈点以及可选的50%部分止盈位。所有数据均实时计算并直接显示在图表上。 您可以选择交易伦敦开盘、纽约交易时段、亚洲交易时段,或者自定义交易时段。ORB Seeker MT5 会自动适应您选择的交易时段,让您精准掌握市场波动范围、突破位和交易位。 每次购买均免费赠送 ORB Seeker EA 智能交易系统。该 EA 系统读取指标的突破信号并可自动下单,您可以选择手动交易,也可以让 EA 系统根据指标的信号逻辑自动处理入场。   为什么选择 ORB Seeker MT5 支持多个交易时段 - 您可以自行设置伦敦、纽约、亚洲或自定义交易时段的盘前交易时间和交易时段。 完整的突破视觉效果 -
KenKem Master Volume Profiler - Brief Introduction A Display-only volume-profile cockpit for XAUUSD, BTCUSD and other liquid symbols. Draws profile structure, multi-timeframe flow, EMA trend and study-only setup markers. Places no orders. Not a signal service.  It maps where the market has actually traded and reads recent order flow, so you can see structure and lean at a glance.  What it shows: Master and local volume profiles (POC and value-area high/low) - the price shelves that matter. A liv
Navigator Equilibrium:在一个窗口中同时呈现市场阶段、动量、峰值与背离 不必再在动量震荡指标、趋势过滤器、波动率指标和背离扫描工具之间来回切换。Navigator Equilibrium 将它们整合到一个彩色编码的窗口中,让您一眼看出动量是在增强还是减弱、哪一方占主导、市场处于趋势还是盘整,以及价格与动量在哪里出现分歧。 它既适合希望清晰解读市场的主观交易者,也适合需要干净、有文档说明的缓冲区的 EA 开发者。 与众不同之处 五种状态的柱状图,而不仅仅是多或空。 除了方向之外,颜色还显示动量是在增强、在减弱,还是已经处于峰值状态。 零轴兼具市场状态指示器的作用。 它会变色,告诉您市场处于趋势还是盘整。 一眼看清“谁在主导”。 柱状图顶部的标记线会相对于慢速均线变色,同时提示何时可以考虑逆势交易。 峰值跟踪。 每个柱状图峰值都会与同侧的上一个峰值比较,让您看出动量是在扩张还是收缩。 自动识别四种背离: 常规与隐藏、看涨与看跌。它们以箭头绘制,并可附带文字;滚动或缩放图表时,文字与箭头之间始终保持固定的像素间距。 可切换的计算模式 ,包括柱状图、盘整检测和峰值检测,便于
一句话理解 这是一个 二合一的智能指示器 ——把 RSI 和 MACD 两位“专家”的意见打包成一个简单的结论:出现箭头,就行动;没有箭头,就等待。 而且箭头 不会重绘 ,收盘后是什么样,永远就是什么样。 它解决了什么问题 很多交易者同时看 RSI(判断动量和超买超卖)和 MACD(判断趋势方向),但两者经常给出矛盾信号。 这个指示器的做法是: 只有两人同时同意 ,才发出信号。这就过滤掉了大量假信号和模糊时段。 你实际看到的东西 独立的指示器窗口(不遮住 K 线图) 清晰的 买入箭头 和 卖出箭头 放大版的 MACD 柱状图(更容易看清动量变化) RSI 和 MACD 的线依然在,但你的注意力只需放在箭头上 谁适合用 新手 :不用学两个指标如何配合,跟着箭头做即可 老手 :节省时间,快速过滤噪音,且不重绘的特性让回测结果可信 所有讨厌信号闪烁的人 为什么它不重绘 因为它的判断逻辑基于 完整收盘后的价格数据 。信号只有在满足条件的那一刻才会固定下来,之后不会因为后续 K 线的变化而修改之前的箭头。 这意味着你可以放心做回测,也能在实盘中信任你看到的每一个信号。 底层特点(不复杂地说) 它
Transaction Speed MT5
Ivan Stefanov
5 (4)
当然,以下是翻译成中文(简体)的版本: 该指标标出市场中显现出 交易兴趣 的区域,并随后显示 订单积累区域 。它的工作方式类似于大规模的订单簿。 这是为 大资金 打造的指标,性能卓越。市场中有任何兴趣,你都能通过它清晰看到。 (这是一个 完全重写的自动化版本 —— 不再需要手动分析。) 交易速度 是一个全新的概念指标,它显示了市场上大订单 何时 、 何地 聚集,并揭示了其背后的意义。它可以在 非常早期 就检测到趋势的变化。 在外汇市场,所谓的“交易量”实际上是误导性的,因为那指的是价格在单位时间内的变化,因此真正的名称应是“交易速度”。 一切都取决于我们如何思考、如何行动、如何分析。 改变分析范式至关重要。 该指标完全重构了外汇市场上“交易量”的概念,用逻辑方式重新定义并应用,从而成为一个 独特而精准的工具 。 使用方法: 默认情况下,指标处于 自动模式 ,可独立用于任何时间周期。如果你希望切换到手动模式,只需点击 Auto / Manual Mode 按钮即可。 在 手动模式 下,所有计算从 2025年1月1日 开始。你可以根据需要更改该日期,以查看不同的分析结果。 最优数据周期
TrendMaestro5
Stefano Frisetti
note: this indicator is for METATRADER4, if you want the version for METATRADER5 this is the link:  https://www.mql5.com/it/market/product/108106 TRENDMAESTRO ver 2.5 TRENDMAESTRO recognizes a new TREND from the start, he never makes mistakes. The certainty of identifying a new TREND is priceless. DESCRIPTION TRENDMAESTRO identifies a new TREND in the bud, this indicator examines the volatility, volumes and momentum to identify the moment in which there is an explosion of one or more of these da
看清市场真正在做什么。   在您眼前实时观察三大市场阶段(收缩、扩张、趋势),并在趋势阶段的早期阶段抓住更优的入场点。   不要再猜测。开始像机构和聪明钱那样解读市场。   Apex Market Structure Pro(MT5 版)是一款精准的聪明钱分析工具,它剥离噪音,向您展示每根 K 线之下的真实结构:流动性、结构转变、吸   筹区域与趋势偏向,全部呈现在一个简洁、专业的图层中。专为厌倦了滞后指标、准备以清晰视角交易的严肃交易者打造。   重要提示:本指标专为 Heikin Ashi(平均足)K 线设计。使用前请将图表切换为 Heikin Ashi,以释放其全部威力。全部分析都围绕 Heikin   Ashi 的价格流构建。正是在这里,Apex Market Structure Pro 发挥出最佳表现。   交易者为何选择 Apex Market Structure Pro:   流动性,一览无遗: 瞬间看清止损池所在之处。卖方与买方流动性会被自动标注。实时关注尚未被扫的价位,捕捉价格攫取流动性并反转的精确时   刻。在聪明钱交易的地方交易。   会说话的结构:
FX-AIEA 供给需求区智能识别指标(Supply and Demand Indicators MT5)——技术原理与参数讨论 版本:2.51 | 适用平台:MetaTrader 5 引言 供给需求区是机构订单流的重要表现形式,相比传统支撑阻力位能更直接地反映买卖力量的失衡。本指标尝试通过算法自动识别高概率供需区域,以减少手动绘制的耗时与主观性。其核心逻辑基于自适应 ZigZag 算法,提取波峰波谷并生成区域标识 。 核心技术特点 全自动绘制机制 :基于改良版 ZigZag 动态提取有效极值,标记潜在供给区与需求区。指标遵循 MQL5 原生   prev_calculated   机制,在新 K 线生成时自动重绘,支持跨周期强制计算( Forced_TimeFrame   参数)。 区域边界模式 :支持宽带(覆盖K线影线极值)与窄带(仅覆盖实体)两种模式,用户可通过   use_narrow_bands   参数切换,以适应不同交易风格。 滤噪算法 :启用   kill_retouch   后,自动剔除被后续行情反复轻触但未有效突破的弱势区域,以提升信号有效性。 视觉与性能 :支持自
Footprint 是一款用于分析订单流 (Order Flow) 和成交量的指标。 它有助于在聚类层面识别市场结构,寻找活动增加的关键区域,并直接在图表上使用过滤器,无需不断打开设置窗口。 Footprint 指标功能 Bid x Ask, Delta 聚类图表; 图表上的控制面板; 用于调整过滤器的滑块; Absorption; Initiative; Stacked Imbalances; Big Trades; dPOC / Dynamic Point of Control; Delta; 侧边市场轮廓 (Market Profile); 累计 Delta (Cumulative Delta)。 核心优势 在密集的 Tick 流上快速计算和渲染数据; 图表内管理 — 主要模式和过滤器可直接在图表上切换,无需打开设置; 通过过滤突出显示重要的价格水平和聚类; 视觉信号高亮:吸收、主动性、失衡和大单交易; 按日、周或当前可见范围显示的侧边轮廓; 包含总成交量、Delta 和累计 Delta 的面板。 Footprint 帮助您确定: 重要成交量集中的位置; 主动性压力出现的位置;
Zain Gold ScalpingV5
Ahmed Gamal Abdel Nasser Mohamed
Zain Gold Scalping V5 is a technical analysis indicator for MetaTrader 5 designed for Forex and Gold markets. It provides chart-based market information, trend analysis, signal conditions, and an on-screen dashboard to help traders analyze price movement across multiple timeframes. Main Features The indicator supports multiple timeframes, including M1, M5, M15, M30, H1 and higher timeframes. It can be used with Gold (XAUUSD), Forex currency pairs, indices and other supported instruments. The in
Flag Pattern Angelo
Brighton Mufaro Mudzingwa
Brandon Angelo Flag Pattern — how it works This indicator automatically detects classic bull and bear flag chart patterns in real time. The detection happens in three stages for each bar. First it looks for a flagpole — a sharp, strong directional move over a configurable number of bars ( FlagpoleBars , default 5) that must exceed a minimum percentage size ( FlagpoleMinPct ). For a bullish flag the pole must close net higher than it opened; for a bearish flag, net lower. Second it identifies th
KT Alpha Hunter Arrows MT5
KEENBASE SOFTWARE SOLUTIONS
大多数箭头指标只给你一个信号,然后让你自己去判断剩下的一切。KT Alpha Hunter Arrows 为你提供完整的交易计划。 每一个信号箭头出现时,都会同时绘制一套完整计划:入场线、止损位、四个止盈目标,以及实时优势判断,告诉你当前这个交易品种和时间周期是否值得交易。随附的 Trade Manager EA 会在你手动入场后负责后续执行,让你在市场波动剧烈、情绪干扰明显时也能保持交易纪律。不重绘。仅在K线收盘后确认信号。适用于 Forex、黄金、指数以及任何你在 MT5 上交易的品种。 核心功能 不重绘买入和卖出箭头,只在K线收盘后生成。 每个信号都会显示入场线、结构性止损位和四个止盈目标。 Edge Dashboard 会分别评估当前图表上的买入和卖出机会。 判断系统包括:No Edge、Marginal、Tradeable、Good 或 Strong。 一键 Auto Optimize 按钮可根据当前品种和时间周期自动优化设置。 完整套装包含 Trade Manager EA,并提供五种专为本指标设计的预设交易管理方案。 Prop Firm Risk Panel 可在图表上
Boom & Crash & PainX & GainX Ultimate Spike Detector Trade Spikes With Confidence — Not Guesswork Catching spikes should be one of the most profitable strategies in synthetic markets. But for most traders, it becomes one of the most frustrating. You enter too early… price goes against you. You wait for a spike… it never comes. You finally catch one… but don’t know whether to hold or close. You make profit… then give it all back because there’s no exit plan. This is exactly the problem the Ultim
历史相似性匹配指标  概述 历史相似性匹配器(Historical Similarity Matcher)是 MetaTrader 5 的技术分析指标。它扫描历史价格数据,寻找与用户在图表上选定的参考时期具有统计相似性的片段。当找到匹配时,指标会显示历史模式,并根据这些历史片段的后续走势绘制潜在未来价格走势的投影。 本指标仅供教育和分析用途,不构成财务、投资或交易建议。不保证结果或盈利能力。过去表现不代表未来结果。交易存在重大损失风险。用户对自己的交易决策和结果负全责。  功能特点 - 识别与选定参考时期具有相关性的历史价格片段 - 支持正向和反向模式匹配 - 显示多个匹配的历史模式(数量可配置) - 为每个匹配绘制基于历史延续的独立投影线 - 可选 OpenCL 支持,在兼容硬件上加速计算(不支持时回退到 CPU) - 适用于任何时间周期和交易品种 - 允许在不同于当前图表的时间周期上进行扫描 - 在图表上提供启动扫描和导出结果的按钮 - 导出每个匹配的截图以及包含匹配详情的 CSV 文件  工作原理 1. 用户通过在图表上放置两条垂直线或在输入参数中设置日期来选择
OrderFlow Absorption – 專業級MT5買賣差與吸收訊號指標 釋放真正訂單流分析的力量,OrderFlow Absorption 是MetaTrader 5上最強大的買賣差(Delta)直方圖與吸收訊號指標。專為想看清每一個價格波動背後真相的交易者設計,這個工具揭示了隱藏的買賣壓力與推動市場的吸收事件。 功能特色 買賣差直方圖視覺化:   以清晰的色彩直方圖即時顯示買方與賣方壓力。 吸收訊號偵測:   先進邏輯自動辨識多空吸收事件,及早預警潛在反轉。 圖表標記:   吸收訊號直接標示於主圖表,方便視覺辨識。 彈出式警報:   新吸收訊號出現時即時通知。 自訂門檻:   過濾弱訊號,專注高勝率機會。 資源管理:   高效運算,適用於大型圖表也能流暢運行。 全品種兼容:   適用於任何商品與週期,包括外匯、指數、商品等。 簡易整合:   參數簡單,快速上手與調整。 OrderFlow Absorption 的邏輯說明 OrderFlow Absorption 採用專利演算法,能在沒有完整Tick數據的情況下,估算每根K棒的買賣壓力(Delta)。它分析成交量、價格行為、K
Chimera Volume
Marko Milenkovic
适用于 MetaTrader 5 的 Chimera Volume 高级成交量分析与市场活跃度可视化 Chimera Volume 是一款为 MetaTrader 5 设计的自定义指标,旨在通过动态视觉框架分析标准化成交量活跃度,并展示市场参与度的变化。 该指标利用自适应标准化算法处理 Tick 成交量数据,生成关于成交量强度、累积阶段以及不同市场条件下活跃度变化的结构化表达。 与显示原始成交量数值的标准成交量指标不同,Chimera Volume 应用了额外的计算方法,以突出市场活动的相对变化并提高图表的可读性。 主要功能 根意图直方图 (Root Intent Histogram): 一种动态直方图,用于可视化标准化成交量强度和市场参与度。该直方图使用自适应颜色过渡,以区分活跃度增加时期与参与度减弱时期。 惯性线 (Inertia Line): 一条由标准化成交量计算得出的平滑分析线。旨在帮助交易者观察成交量动能的变化,并监控扩张期与收缩期之间的转换。 信号线 (Signal Line): 一个用于比较短期和长期成交量表现的次级计算层,在评估市场状况时可作为辅助参考。 自适应成交量
VTrende Pro
Andrii Diachenko
5 (1)
VTrende Pro - MTF indicator for trend trading with a display panel for MT5 *** Videos can be translated into any language using subtitles (video language - Russian) Although the signals of the VTrende Pro indicator can be used as signals of a full-fledged trading system, it is recommended to use them in conjunction with the Bill Williams TS. VTrende Pro is an extended version of the VTrende indicator. Difference between Pro version and VTrende: - Time zones - Signal V - signal 1-2 waves -    S
作者的更多信息
TREND HARMONY MT4 –  Multi Timeframe Trend and Phase and Pullback Level Visualizer indicator for Metatrader4 The TREND HARMONY indicator automates deep trend analysis and generates visualizations for you. Take control of your trades by eliminating uncertainty! Revolutionize your trading experience with precision and insight through the TREND HARMONY Multi Timeframe Trend Indicator – your ultimate MT4 trend visualization indicator. Are you tired of missing trading opportunities or consistently e
BreakHarmony Multi-Timeframe Breakout Indicator for MT4 The BreakHarmony Multi-Timeframe Breakout Indicator for MT4 is a highly advanced tool providing information on breakout points across different timeframes, aiding traders in decision-making and understanding market movements. [   Features and Manual   |   MT5 version   |  All Products  ] The indicator tracks breakout points on price charts across 6 timeframes. Breakout prices are indicated with the closing price of the corresponding candle
MN1-W1-D1 Close Price Indicator to Index Trading for MT4 The indicator draws lines to the close prices of the last closed bars of monthly, weekly and daily timeframes. Observably, these prices are significant support and resistance prices at major indices, like Nasdaq, DAX. The info panel always shows the prices relative to each other in the correct order. If the current price is the highest - i.e. higher than the last monthly, weekly and daily closing price - it is in the first row. The lowest
BreakHarmony Multi-Timeframe   Breakout Indicator for MT5 The BreakHarmony Multi-Timeframe Breakout Indicator for MT5 is a highly advanced tool providing information on breakout points across different timeframes, aiding traders in decision-making and understanding market movements. [  Features and Manual   | MT4 version   |   All Products  ] The indicator   tracks breakout points   on price charts across 6 timeframes.   Breakout prices are indicated   with the closing price of the correspondi
MN1-W1-D1 Close Price Indicator to Index Trading for MT5 The indicator draws lines to the close prices of the last closed bars of monthly, weekly and daily timeframes. Observably, these prices are significant support and resistance prices at major indices, like Nasdaq, DAX. The info panel always shows the prices relative to each other in the correct order. If the current price is the highest - i.e. higher than the last monthly, weekly and daily closing price - it is in the first row. The lowest
筛选:
无评论
回复评论