Momentum Shadow Indicator
- 指标
- 版本: 1.0
- 激活: 5

轻松识别真实市场强度 — 即使你是新手。
动量影子指标(MSI)非常适合初学者和专业交易者。
它向你显示市场是否真的有力量 — 让你更有信心知道何时买入和卖出。
没有困惑。没有猜测。
只有简单的线条,告诉你什么是真实的,什么不是。
✅ 超级易用 — 适合所有水平
✅ 明确的买入和卖出信号
✅ 最适用于20分钟及以上时间框架,但也适合快节奏交易
最适用于合成波动指数——没有新闻会影响这些市场,因此你获得的是纯粹的动量信号。
工作原理:
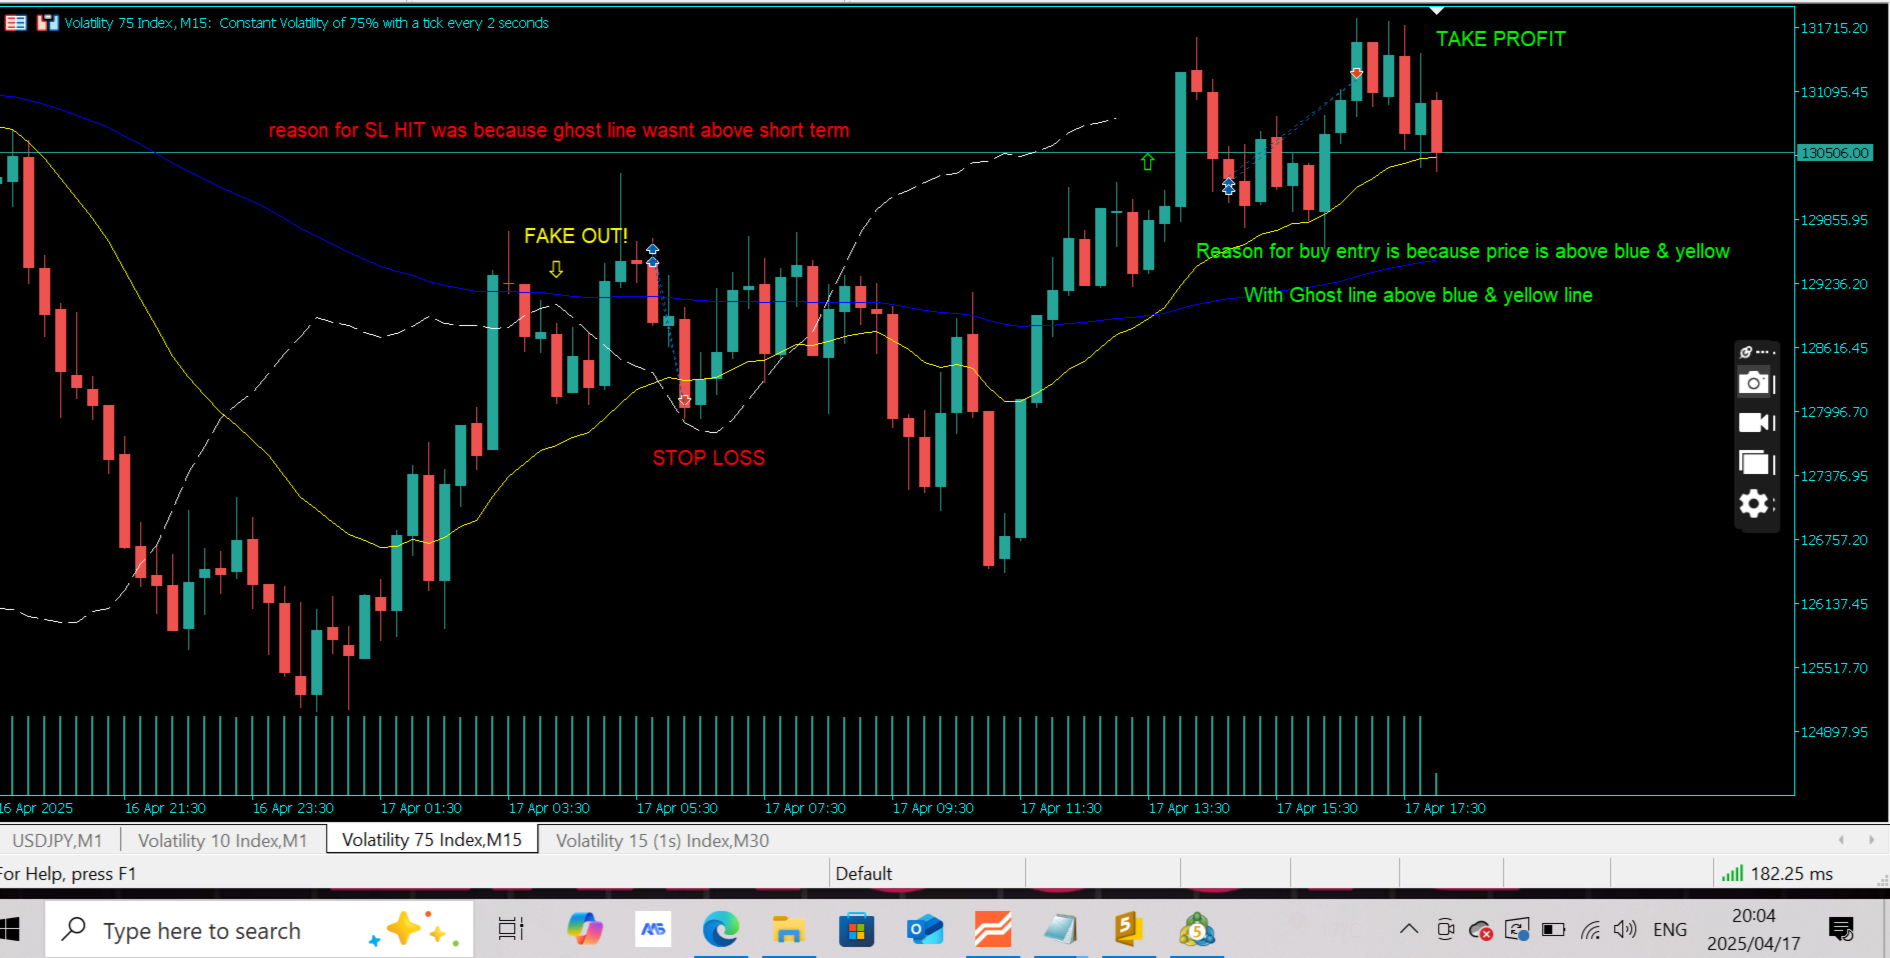
MSI 在你的图表上显示三条线:
-
短期趋势线(黄色)
-
长期趋势线(蓝色)
-
动量影子线(白色),跟踪过去的价格运动
看涨信号:
当价格突破黄色和蓝色线,且动量影子也在其上方时:
➤ 表明强劲的上行动力。建议买入。
看跌信号:
当价格跌破黄色和蓝色线,且动量影子也在其下方时:
➤ 表明强劲的下行动力。建议卖出。
如果影子与价格不一致(例如价格突破,但影子仍在下方),说明动量较弱,行情可能是假突破。
最佳时间框架:
✅ 在20分钟及以上时间框架下效果最佳
✅ 也可用于短线交易(剥头皮)
为何与众不同:
-
通过跟踪动量确认价格走势,减少虚假信号
-
适用于任何市场:外汇、指数、加密货币、股票
-
清晰简单的界面 — 没有杂乱,只有精准
-
非常适合趋势交易者、短线交易者和突破交易者
MSI 不只是跟随价格 — 它揭示背后的动能。
仅在动量真正支持走势时进行交易。
免责声明: 本指标为辅助工具,并非金融建议。请自行做出交易决定。交易风险由用户自行承担。