Momentum Shadow Indicator

Identifiez facilement la véritable force du marché — même si vous êtes débutant.
L'indicateur Momentum Shadow (MSI) est parfait pour les débutants et les professionnels.
Il vous montre si le marché a vraiment de la puissance — pour que vous sachiez quand acheter ou vendre en toute confiance.

Pas de confusion. Pas de devinettes.
Juste des lignes simples qui vous montrent ce qui est réel ou non.

✅ Très facile à utiliser — pour tous niveaux
✅ Signaux clairs d'achat et de vente
✅ Idéal pour les graphiques de 20 minutes et plus, aussi adapté au scalping

Fonctionne mieux sur les indices de volatilité synthétiques — aucune actualité n’impacte ces marchés, donc vous obtenez des signaux de momentum purs.

Comment ça marche :
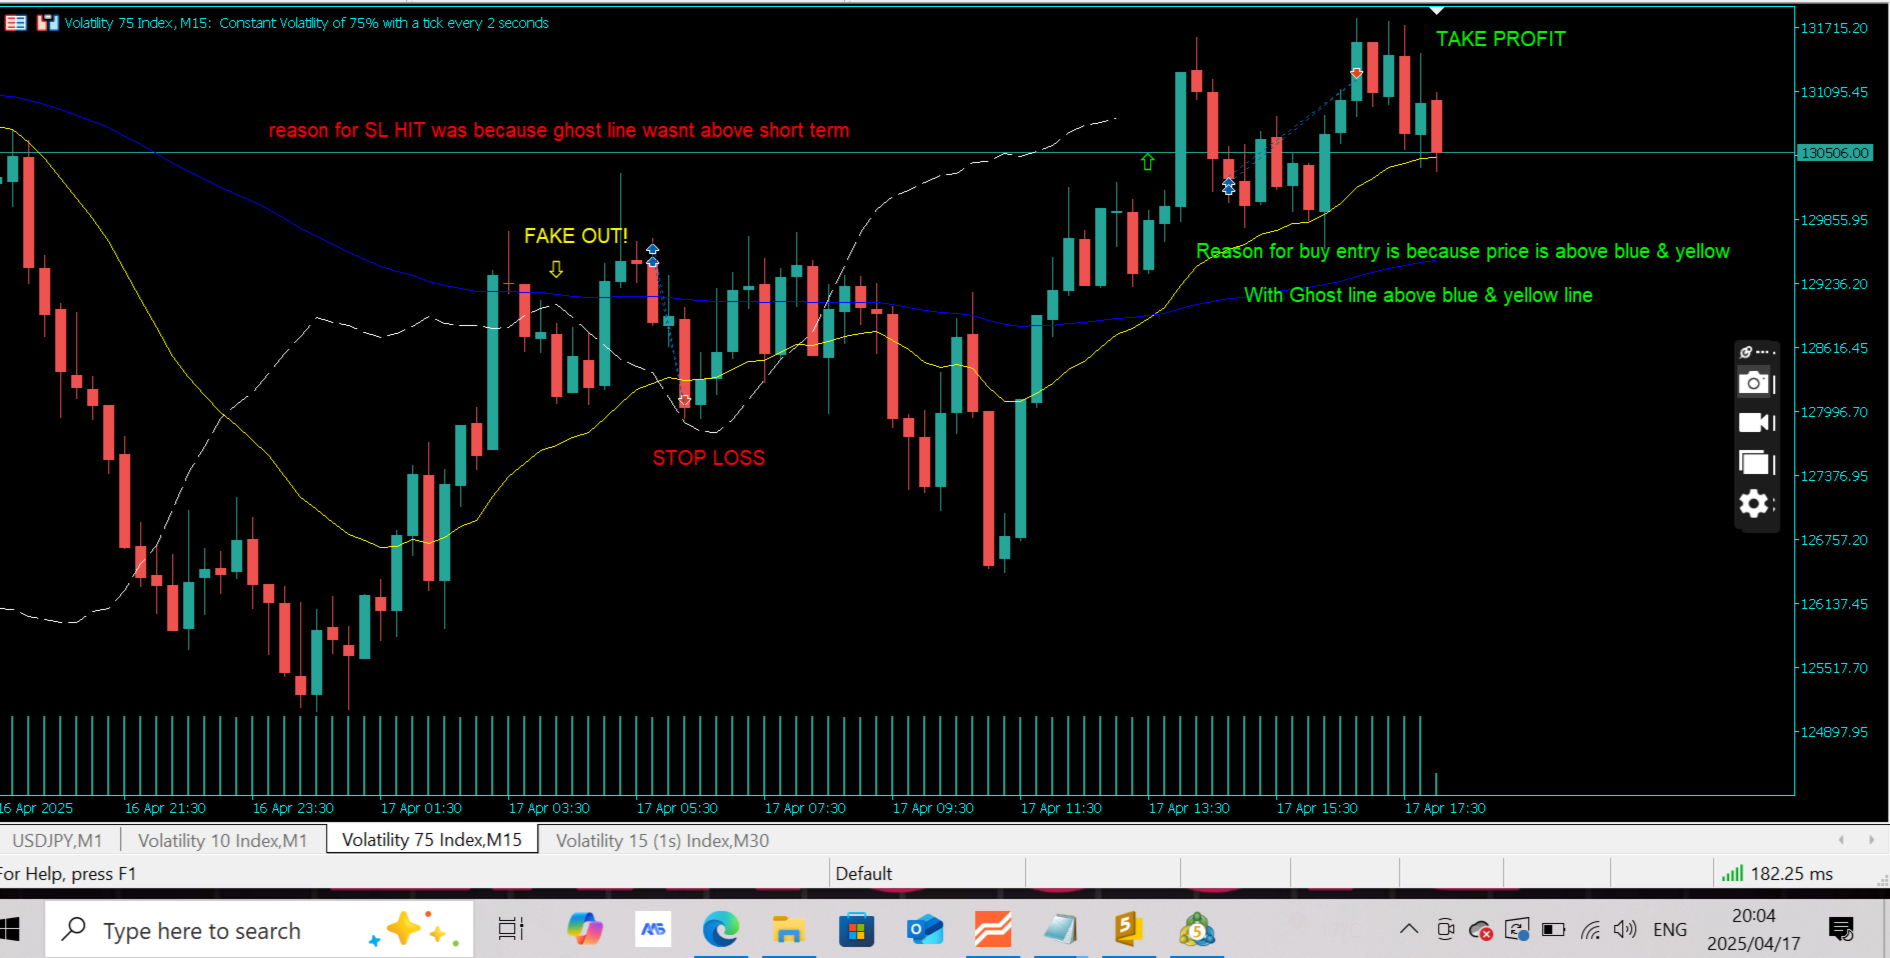
MSI affiche trois lignes sur votre graphique :

  • Une ligne de tendance court terme (jaune)

  • Une ligne de tendance long terme (bleue)

  • Une ligne d'ombre de momentum (blanche) qui suit le mouvement passé

Signal haussier :
Si le prix dépasse les lignes jaune et bleue, et que l’ombre est également au-dessus :
➤ Forte dynamique haussière. Envisagez un achat.

Signal baissier :
Si le prix tombe sous les deux lignes et que l’ombre est également en dessous :
➤ Forte dynamique baissière. Envisagez une vente.

Si l’ombre ne suit pas le prix, le momentum est faible — le mouvement peut être faux.

Meilleurs timeframes :
✅ Fonctionne mieux sur les timeframes de 20 minutes ou plus
✅ Peut aussi être utilisé pour du scalping

Pourquoi c’est différent :

  • Élimine les faux signaux en confirmant le prix avec le momentum

  • Fonctionne sur tous les marchés : Forex, indices, crypto, actions

  • Interface claire et simple — pas de désordre, juste la précision

  • Idéal pour les traders de tendance, les scalpeurs et les breakout traders

MSI ne suit pas simplement le prix — il révèle la force derrière.
Ne tradez que lorsque le momentum soutient vraiment le mouvement.

Avertissement : Ce n’est pas un conseil financier. Vous êtes responsable de vos propres décisions de trading.


Produits recommandés
Adjustable Consecutive Fractals  looks for 2 or more fractals in one direction and sends out a on screen alert, sound alert and push notification, for strong reversal points . Adjustable Consecutive Fractals, shows the fractals on chart along with a color changing text for buy and sell signals when one or more fractals appear on one side of price. Adjustable Consecutive Fractals is based Bill Williams Fractals . The standard Bill Williams fractals are set at a non adjustable 5 bars, BUT withe th
RAD CRITICAL LEVES RAD indicator tracks “Relevant Volume” in real time, identifying accumulation and distribution processes, projecting them in the chart as SUPPORT or RESISTANCE zones. Natural   support   and resistance levels are generated by Volume Accumulation and Distribution processes. As these processes evolve, levels at which the relevant volume in the market place is positioned, become difficult areas to cross upwards or downwards. By using this information, traders can identify very s
Here   our more valuable tools SMC Trend Trading   ,  Easy SMC Trading  ,  Institutional SMC Architect Volume Analysis Tools  ,  Volume flow Profile  ,  Market volume profile  , FVG with Volume  , Liquidity Heatmap Profile  ,  Volume Spread Analysis The Trading Guide MT5 Indicator is a powerful psychological trading assistant designed to keep traders disciplined, focused, and emotionally balanced. This innovative indicator displays real-time motivational messages, trading rules, and analysis
FREE
Here   our more valuable tools SMC Trend Trading   ,  Easy SMC Trading  ,  Institutional SMC Architect Volume Analysis Tools  ,  Volume flow Profile  ,  Market volume profile  , FVG with Volume  , Liquidity Heatmap Profile  ,  Volume Spread Analysis What It Does FiboPivot Dashboard is a powerful technical analysis tool that automatically calculates and displays Fibonacci-based pivot points on your chart. It identifies key support and resistance levels based on the previous day's price acti
FREE
Automatic Vwap Midas
Ricardo Almeida Branco
5 (1)
The 3 Automatic Vwap (Midas) Indicator can be used for Price and Volume studyers to map the movement of market drivers. It automatically plots 3 Vwaps, two of which are dynamic and will be updated throughout the day if new highs or new lows emerge. The third Vwap is daily and can help if the trend is up or down. Also, an auxiliary indicator that plots (also dynamic) points of interest with OHLC prices (Open, High and Low of the current day and Close of the previous day) was inserted. Success and
Direct Scalping
Yosi Malatta Madsu
Direct Scalping shows the most SUPER SUPER SUPER EARLY opportunity to scalp the market. Do entry as early as possible, as soon as the first sign appears. It plays sound alert so that you can wait the moment while doing something else. Remember to cut loss below the '' area. Yes, it is not stop loss but cut loss (exit on candle close). Made for M1 timeframe, but higher is good too. My new favorite setup: M3 using 8 indicators with different parameters: 11, 18, 25, 32, 39, 46, 53, and 60. Combin
VWAP Bands
Rafael Caetano Pinto
This indicator uses VWAP and projects this VWAP into up to 3 levels, shifted by a percentage of the chart's symbol. How to configure: Choose the symbol and desired graphic time Set the start time of the symbol (in bovespa, WIN and WDO start at 9 o'clock). This time is used as the cutoff reference for VWAP. Check which VWAP period fits the chart better: Ideally, a period when VWAP is not too distant from the chart Set percentage levels: Ideally, you should set levels based on history, so that le
Cet indicateur est basé sur la transformée de Hartley discrète. L'utilisation de cette transformation vous permet d'appliquer différentes approches lors du traitement des séries chronologiques financières. Une caractéristique distinctive de cet indicateur est que ses lectures ne se réfèrent pas à un point sur le graphique, mais à tous les points de la période de l'indicateur. Lors du traitement d'une série temporelle, l'indicateur permet de sélectionner différents éléments de la série temporell
Do you use volume in your reading of the market? Certainly many traders use it, and do not imagine operating without it. The Color Histogram Volume Set indicator allows the user to choose the value that he considers interesting to monitor. When you pass this you will have visual confirmation and if you want you will also have the audible alert that is given by the indicator. Of course, there are other ways to try to find a high volume, such as assessing whether the volume is above av
Liquidity Trap Confirmation Pendant les sessions intraday actives, le prix peut balayer un niveau clair de liquidité puis se retourner avant que le setup soit réellement prêt. Liquidity Trap Confirmation est un outil de confirmation sur clôture de bougie pour les traders discrétionnaires qui préfèrent éliminer les mauvaises entrées plutôt que recevoir davantage de signaux. Il évalue la liquidité, la structure, le déplacement, la volatilité et le contexte de marché afin d’indiquer si un setup doi
Better Volume MT5
Illia Zhavarankau
1 (1)
Description: The indicator of tick volumes Better Volume MT5 allows you to assess the general mood of the market and quite accurately catch the moments of the formation of large movements. The indicator is a color histogram in an additional window. In the calculation of Better Volume MT5 the Price Action combinations are taken into account, the values of the volumes with the height of columns and color marking are displayed. Input parameters: MAPeriod - period for calculating the moving average
In the context of trading, Malaysia SNR (Support and Resistance) refers to the technical analysis of support and resistance levels in financial markets, particularly for stocks, indices, or other assets traded. This is single timeframe version. Multiple timeframe version is avaiable here . There are three type of Malaysia SNR level Classic , GAP and Flipped 1. Classic Support is the price level at which an asset tends to stop falling and may start to rebound. It acts as a "floor" where demand is
WT Vwap Bands
Ricardo Almeida Branco
The WT Vwap Bands indicator is an indicator that combines price and volume, helping to show whether the price is within the "fair price", overbought or oversold. The indicator code was designed for performance and has already been tested in a real trading account. In addition to the visual inputs (color, thickness and line style), the user can define a% value that depends on the price. The default values work with the most distant band at 1% of the price and then dividing this distance in
Alpha One MT5 - Système avancé de détection des tendances Alpha One est un indicateur professionnel de suivi des tendances qui fournit des signaux d'ACHAT et de VENTE clairs avec entrée automatique, stop loss et trois niveaux de take profit tracés directement sur votre graphique. L'indicateur dispose d'une visualisation unique du champ d'énergie composée de 15 lignes dynamiques qui passent du vert au rouge pour refléter la force et la direction de la tendance en temps réel. L'énergie verte ind
The chaos wave
Letlhogo Mokgatle
This is the best indicator we have created by far, this indicator replicates the well known heiken ashi indicator,  but with a more precise entry point, this indicator can work on all time-frames and is strong on all the time frames , this indicator does not repaint nor does it lag , this indicator strategy combined with price action will change your trading experience , elevate your experience to the next level.
Serious about inside bar strategies? This professional indicator delivers three game-changing advantages: efficient backtesting through TIME ZONE signal filtering that eliminates noise and focuses on INSIDE BAR PATTERNS , instant alerts for live trading when your attention is required elsewhere, and complete timezone customization that works anywhere in the world regardless of your broker's location. Additional Features: Zero false positives with advanced pattern validation Automatic broker GMT
Visual Heatmap Book Analyzer
Alexandre Moraes De Souza Lima
Visual Heatmap Book Analyser This indicator monitors the market liquidity and generates colors based on order patterns, quantities, and renewal activities in the book. This allows you to visualize the order flow and identify areas of high and low liquidity and activity. The indicator uses machine learning techniques to analyze the order behavior in the book, enabling it to detect patterns and trends in orders, allowing you to make informed decisions about your trading operations. The color pale
Mini Indice Composition
Thalles Nascimento De Carvalho
Mini Índice Composition: A Revolução na Análise do Mini Índice! O Mini Índice Composition é um indicador inovador que monitora em tempo real as principais ações que compõem o mini índice, trazendo uma visão quantitativa poderosa sobre o fluxo de ordens do mercado! Como Funciona? Diferente de outros indicadores que utilizam apenas dados históricos, o Mini Índice Composition faz uma leitura ao vivo das ordens que entram e saem das ações, pesando o impacto direto no mini índice. Com
PTS Demand Index MT5
PrecisionTradingSystems
Code PTS Demand Index par Precision Trading Systems Le Demand Index a été créé par James Sibbet et utilise un code complexe pour faciliter l'interprétation du volume et du prix en tant que combinaison. Comprendre les volumes n'est jamais une tâche facile, mais ce magnifique morceau de programmation simplifie certainement les choses. Il existe plusieurs façons dont cet indicateur peut bénéficier aux traders et aux investisseurs. Divergences (en tant qu'indicateur de premier plan) Après avo
Chessmark
Matheus Oliveira Rossi
Trend Indicator  This indicator is about long buy and long sell using a simple visualization of trend.  The green candle after a long sell period means a good moment to buy. A red candle after a long sequence of buyers means a good moment for sell. After all, you can use all time-frames on this indicator. * * If you prefer a better visualization, use long period on chart. Ex: 1H and 4H.   
This product is designed for the MT5 platform and offers two key features: VWAP (Volume Weighted Average Price) calculation and Volume Profile analysis. Advantages: VWAP Calculation: The product calculates the VWAP, which is a popular indicator used by traders to determine the average price of a security based on its trading volume. It helps identify potential buying or selling opportunities by comparing the current price to the average price weighted by volume. Volume Profile Analysis: The prod
Description The indicator uses market profile theory to show the most relevant trading zones, on a daily basis. The zones to be shown are LVN (low volume nodes) and POC (point of control). An LVN zone is one which represents price areas with the least time or volume throughout the day. Typically, these areas indicate a supply or demand initiative, and in the future, they can turn into important breakout or retracement zones. A POC zone is one which represents price areas with the most time or vo
Yp fb Indicator MT5
Machbub Yusakh Pribakti
this indicator combines Fibonacci Retracement with Smart Money Concept (SMC) elements such as Order Blocks, Liquidity, Break of Structure (BOS), and Change of Character (CHoCH). This indicator has a fairly complex structure and functions as a technical analysis tool that merges two popular concepts. The code is already quite neat with a separation of functions based on their respective tasks (initialization, calculation, drawing). Support Multi Time frame
Balance Aggression
Edson Cavalca Junior
The indicator measures the balance of aggression. The formula is as follows:   Aggression  = Purchase Volume - Sales Volume. Note : It is rec ommended to use the default configuration and VPS values. It does not work in Forex. Meet Our Products     Parameters : Numbers of days prior to the current one for calculation; Volume Divider e; Enables calculation of the current candle; Histogram Line style and; Size; Line Line style and; Size;  Follow us on our website to check the next news.
OWL Divergence Scanner
Gabriel Alejandro Sanchez Lledo
OWL Divergence Scanner is a professional-grade multi-timeframe, multi-symbol divergence detection tool for MetaTrader 5. Built with precision and speed in mind, this advanced scanner automatically identifies Regular and Hidden divergences across your favorite oscillators, helping traders spot high-probability trend reversal and continuation setups before the market moves. Key Features Powerful Divergence Detection — Accurately detects both bullish and bearish regular divergences (for potential r
ArroX
Zahed Khodarahmi
ArroX Indicator Description ArroX is a technical analysis indicator designed for MetaTrader 5 platform. This indicator analyzes price movements and market trends to provide trading signals. Key Features: - Displays buy and sell arrows on the chart - Includes trend filtering capabilities - Provides multiple take profit levels - Shows market analysis information panel - Supports different signal sensitivity modes - Uses Bollinger Bands and moving averages for analysis - Includes stop loss calc
Holiday Sales Zones Indicator The Zones Indicator is your everyday Trading tool that  leverages advanced algorithms, including ICT institutional concepts like order blocks , engulfing candle patterns , and Level interactions , to identify critical levels of supply and demand (Resistance & Support). Visual signals are generated and clearly marked on the chart, providing a straightforward guide for traders to spot key opportunities. Key Features Advanced Algorithmic Analysis : Identifies supply
CDV Candle Engine Pro is a MetaTrader 5 indicator designed to visualize Cumulative Delta Volume (CDV) directly on the price chart. It helps traders read market pressure more clearly by showing the balance between buying and selling activity in a clean, customizable layout. If you trade on MetaTrader 4, the MT4 edition is available here:  CDV Candle Engine Pro MT4 Public channel:   CLICK HERE Main Features CDV candle visualization on the main chart for easy reading in real time. Optional subwind
VWAP Indicator MT5
Kyra Nickaline Watson-gordon
Description : VWAP (Volume-Weighted Average Price) is the ratio of the value traded to total volume traded over a particular time horizon. It is a measure of the average price at which pair is traded over the trading horizon. Read More. All Symbols and All Timeframes are supported. Indicator Inputs :     VWAP Mode : Mode of VWAP Calculation. Options can be selected : Single,Session,Daily,Weekly,Monthly     Volumes : Real Volumes,Tick Volumes     Price Type : Used price for calculating. O
Was: $249  Now: $99   Market Profile defines a number of day types that can help the trader to determine market behaviour. A key feature is the Value Area, representing the range of price action where 70% of trading took place. Understanding the Value Area can give traders valuable insight into market direction and establish the higher odds trade. It is an excellent addition to any system you may be using. Inspired by Jim Dalton’s book “Mind Over Markets”, this indicator is designed to suit the
Les acheteurs de ce produit ont également acheté
Neuro Poseidon MT5
Daria Rezueva
4.95 (22)
Neuro Poseidon is a new indicator by Daria Rezueva. It combines precise trading signals with adaptive TP/SL levels - creating best possible trades as a result! Message me and get  Neuro Poseidon Assistant  as a gift to automize your trading process! What makes it stand out? 1. Proven profitability on all assets and timeframes 2. Only confirmed BUY and SELL signals present on the chart 3. Adaptive TP & SL levels generated by the software for each trade 4. Easy to understand - suitable for al
PrimeScalping
Temirlan Kdyrkhan
PrimeScalping is a powerful trading companion designed to generate high-probability entry signals with dynamic TP/SL/DP levels based on volatility. Built-in performance tracking shows win/loss stats, PP1/PP2 hits, and success rates — all updated live. Key Features: Buy/Sell signals with adaptive volatility bands Real-time TP/SL/DP levels based on ATR Built-in MA Filter with optional ATR/StdDev volatility Performance stats panel (Success, Profit/Loss, PP1/PP2) Alerts via popup, sound, push, or e
SuperScalp Pro
Van Minh Nguyen
4.65 (26)
SuperScalp Pro – Système avancé d’indicateur de scalping multi-filtres SuperScalp Pro est un indicateur de scalping avancé qui combine le Supertrend classique avec plusieurs filtres de confirmation intelligents afin d’identifier les opportunités de trading. Il fonctionne efficacement sur plusieurs unités de temps, de M1 à H4, avec des performances optimisées sur XAUUSD, BTCUSD et les principales paires Forex. L’indicateur fournit des signaux d’achat et de vente clairs, ainsi que des niveaux d’en
Divergence Bomber
Ihor Otkydach
4.9 (90)
Chaque acheteur de cet indicateur reçoit également gratuitement : L’outil exclusif « Bomber Utility », qui accompagne automatiquement chaque opération de trading, fixe les niveaux de Stop Loss et de Take Profit, et clôture les positions selon les règles de la stratégie Des fichiers de configuration (set files) pour adapter l’indicateur à différents actifs Des set files pour configurer le Bomber Utility selon différents modes : « Risque Minimum », « Risque Équilibré » et « Stratégie d’Attente » U
Entry In The Zone and SMC Multi Timeframe is a real-time 2-in-1 market analysis tool that combines market structure analysis and a No Repaint BUY / SELL signal system into a single indicator, built on Smart Money Concepts (SMC) — a widely adopted framework used by professional traders to understand market structure. This indicator helps you see the market more clearly, make decisions based on structure rather than guesswork, and focus on high-probability zones where price is more likely to react
Commençons par être honnêtes. Aucun indicateur ne vous rendra rentable à lui seul. Si quelqu’un vous dit le contraire, il vous vend un rêve. Tout indicateur qui affiche des flèches parfaites d’achat/vente peut être rendu impeccable — il suffit de zoomer sur la bonne partie de l’historique et de capturer uniquement les trades gagnants. Nous ne faisons pas cela.  SMC Intraday Formula est un outil. Il lit la structure du marché pour vous, identifie les zones de prix à la probabilité la plus élevée
ScalpPoint
Temirlan Kdyrkhan
ScalpPoint is a powerful trading companion designed to generate high-probability entry signals with dynamic TP/SL/DP levels based on volatility. Built-in performance tracking shows win/loss stats, PP1/PP2 hits, and success rates — all updated live. Key Features: Buy/Sell signals with adaptive volatility bands Real-time TP/SL/DP levels based on ATR Built-in MA Filter with optional ATR/StdDev volatility Performance stats panel (Success, Profit/Loss, PP1/PP2) Alerts via popup, sound, push, or emai
Ce produit a été mis à jour pour le marché 2026 et optimisé pour les dernières versions de MT5. AVIS DE MISE À JOUR DU PRIX : Smart Trend Trading System est actuellement disponible à $99 . Le prix passera à $199 après les 30 prochains achats . OFFRE SPÉCIALE : Après avoir acheté Smart Trend Trading System, envoyez-moi un message privé pour recevoir Smart Universal EA GRATUITEMENT et transformer vos signaux Smart Trend en trades automatisés. Smart Trend Trading System est un système de trading c
SignalTech is an unique fully rule based trading system delivers an Institutional approach for both Independent Traders and Prop Firm Challengers. Never Repaint. Push Notification available. No over-optimization. All the winning trades with chart setups are published on the comments page. 2026-05 4107 Pips (Until 05-29 NY Closed) 2026-04 2243 Pips 2026-03 2165 Pips 2026-02 2937 Pips 2026-01 2624 Pips 2025-12 1174 Pips It can generate signals with Buy/Sell Arrows, Push Notification (To Mobile) an
MasterTrend
Temirlan Kdyrkhan
MasterTrend Indicator for MT5 A powerful trend-following and signal-evaluation tool MasterTrend   is a custom MT5 indicator that combines Moving Averages and ATR-based risk/reward logic to generate clear buy/sell signals. It visualizes dynamic SL/TP levels, evaluates past trade outcomes, and displays win/loss statistics in a clean on-chart panel. Key features include: Buy/Sell signals based on MA crossovers ATR-based SL/TP1/TP2/TP3 levels with visual lines and labels Signal outcome tracking wit
Quantum TrendPulse
Bogdan Ion Puscasu
5 (25)
Présentation de   Quantum TrendPulse   , l'outil de trading ultime qui combine la puissance de   SuperTrend   ,   RSI   et   Stochastic   dans un seul indicateur complet pour maximiser votre potentiel de trading. Conçu pour les traders qui recherchent précision et efficacité, cet indicateur vous aide à identifier les tendances du marché, les changements de dynamique et les points d'entrée et de sortie optimaux en toute confiance. Caractéristiques principales : Intégration SuperTrend :   suivez f
Power Candles MT5
Daniel Stein
5 (8)
Power Candles V3 - Indicateur de force à optimisation automatique Power Candles V3 transforme la force des devises et des instruments en un plan de trading exploitable sur chaque graphique auquel il est associé. Au lieu de se contenter de colorer les bougies, il effectue une optimisation automatique en temps réel en arrière-plan et vous fournit les meilleurs niveaux de Stop Loss, Take Profit et seuils de signal pour le symbole que vous avez sous les yeux. Un simple clic suffit pour l'adopter en
Trend Catcher ind mt5
Ramil Minniakhmetov
5 (4)
INDICATEUR DE DÉTECTEUR DE TENDANCE L'indicateur de détecteur de tendance analyse les mouvements de prix du marché grâce à une combinaison d'indicateurs d'analyse de tendance adaptatifs, propriétaires et personnalisés. Il identifie la véritable direction du marché en filtrant les fluctuations à court terme et en se concentrant sur la force de la dynamique sous-jacente, l'expansion de la volatilité et la structure des prix. Il utilise également une combinaison d'indicateurs personnalisés de lis
Présentation       Quantum Breakout PRO   , l'indicateur révolutionnaire MQL5 qui transforme la façon dont vous négociez les zones d'évasion ! Développé par une équipe de traders expérimentés avec une expérience commerciale de plus de 13 ans,       Évasion quantique PRO       est conçu pour propulser votre parcours commercial vers de nouveaux sommets grâce à sa stratégie de zone de discussion innovante et dynamique. Quantum Breakout Indicator vous donnera des flèches de signalisation sur les z
Gann Made Easy   est un système de trading Forex professionnel et facile à utiliser qui est basé sur les meilleurs principes de trading en utilisant la théorie de mr. WD Gann. L'indicateur fournit des signaux d'ACHAT et de VENTE précis, y compris les niveaux Stop Loss et Take Profit. Vous pouvez échanger même en déplacement en utilisant les notifications PUSH. VEUILLEZ ME CONTACTER APRÈS L'ACHAT POUR RECEVOIR GRATUITEMENT DES INSTRUCTIONS DE TRADING ET D'EXCELLENTS INDICATEURS SUPPLÉMENTAIRES! V
Azimuth Pro
Ottaviano De Cicco
5 (7)
Azimuth Pro V2: Synthetic Fractal Structure and Confirmed Entries for MT5 Overview Azimuth Pro is a multi-level swing structure indicator by Merkava Labs . Four nested swing layers, swing-anchored VWAP, ABC pattern detection, three-timeframe structural filtering, and closed-bar confirmed entries — one chart, one workflow from micro-swings to macro-cycles. This is not a blind signal product. It is a structure-first workflow for traders who care about location, context, and timing. V2 Launch Offe
GoldenX Entry MT5
Kareem Abbas
5 (9)
GoldenX Entry est un indicateur MT5 doté d’un algorithme adaptatif Smart Entry Trend, d’un système de scoring des signaux, d’un détecteur de régime de marché et d’un filtre de volatilité. Chaque signal inclut un niveau d’entrée calculé, trois niveaux de Take-Profit (TP1, TP2, TP3) ainsi qu’un niveau de Stop-Loss. Il est construit sur plusieurs couches analytiques conçues pour s’adapter à différentes conditions de marché, combinant un système analytique multicouche avec un optimiseur intégré et u
FX Trend MT5 NG
Daniel Stein
5 (6)
FX Trend NG : La Nouvelle Génération d’Intelligence de Tendance Multi-Marchés Vue d’ensemble FX Trend NG est un outil professionnel d’analyse de tendance multi-timeframe et de surveillance des marchés. Il vous permet de comprendre la structure complète du marché en quelques secondes. Au lieu de naviguer entre de nombreux graphiques, vous identifiez immédiatement quels instruments sont en tendance, où le momentum s’affaiblit et où plusieurs unités de temps sont alignées. Offre de Lancement – Ob
M1 Quantum MT5
Hamed Dehgani
5 (1)
M1 Quantum est un système de trading professionnel pour M1 qui fournit des signaux rapides et précis avec Stop Loss, Take Profit et une gestion intelligente du capital intégrés. M1 Quantum contient un système professionnel de gestion du capital conçu pour faire croître le compte rapidement en se concentrant sur les gains consécutifs . Fonctionnalités principales de l' indicateur M1 Quantum Conçu pour l' unité de temps M1 et toutes les paires majeures Toutes les transactions ont un Stop Loss et u
Reversion King Indicator
Eugen-alexandru Zibileanu
5 (4)
Un nouveau Roi en ville - Indicateur + Gestion des ordres (TP1 + TP2 + TP3) + Envoi optionnel de signaux Telegram INCLUS (GRATUIT) (SYSTÈME COMPLET DE TRADING et DE SIGNAUX) Notre meilleur EA pour l’Or : Gold Slayer Cet indicateur inclut une stratégie avancée, un système de trading avec gestion des ordres personnalisable ainsi qu’un système de retour à la moyenne combinant des extensions d’enveloppes, soutenu par plusieurs filtres intelligents de confirmation comme le RSI afin de détecter des en
Atomic Analyst MT5
Issam Kassas
4.26 (35)
Ce produit a été mis à jour pour le marché 2026 et optimisé pour les dernières versions de MT5. AVIS DE MISE À JOUR DU PRIX : Atomic Analyst est actuellement disponible à $99 . Le prix passera à $199 après les 30 prochains achats . OFFRE SPÉCIALE : Après avoir acheté Atomic Analyst, envoyez-moi un message privé pour recevoir Smart Universal EA GRATUITEMENT et transformer vos signaux Atomic Analyst en trades automatisés. Atomic Analyst est un indicateur de trading Price Action sans repaint, san
Meridian Pro
Ottaviano De Cicco
5 (2)
Meridian Pro 2.00: Professional Multi-Timeframe Trend Matrix for MT5 Meridian Pro 2.00 is a professional adaptive trend matrix for MetaTrader 5. It combines the original Meridian trend engine, a clean chart ribbon, closed-bar signal arrows, an 8-timeframe dashboard, Fuel momentum, weighted consensus, synthetic HTF processing and chart-native higher-timeframe context lines. The goal is simple: read current trend, multi-timeframe structure, strength, momentum and EA-ready state from one discipline
SmartScalping
Temirlan Kdyrkhan
SmartScalping is a powerful trading companion designed to generate high-probability entry signals with dynamic TP/SL/DP levels based on volatility. Built-in performance tracking shows win/loss stats, PP1/PP2 hits, and success rates — all updated live. Key Features: Buy/Sell signals with adaptive volatility bands Real-time TP/SL/DP levels based on ATR Built-in MA Filter with optional ATR/StdDev volatility Performance stats panel (Success, Profit/Loss, PP1/PP2) Alerts via popup, sound, push, or e
ARIPoint
Temirlan Kdyrkhan
1 (1)
ARIPoint is a powerful trading companion designed to generate high-probability entry signals with dynamic TP/SL/DP levels based on volatility. Built-in performance tracking shows win/loss stats, PP1/PP2 hits, and success rates all updated live. Key Features: Buy/Sell signals with adaptive volatility bands Real-time TP/SL/DP levels based on ATR Built-in MA Filter with optional ATR/StdDev volatility Performance stats panel (Success, Profit/Loss, PP1/PP2) Alerts via popup, sound, push, or email Cu
Ce produit a été mis à jour pour le marché 2026 et optimisé pour les dernières versions de MT5. AVIS DE MISE À JOUR DU PRIX : Smart Price Action Concepts est actuellement disponible à $200 . Le prix passera à $299 après les 30 prochains achats . OFFRE SPÉCIALE : Après l’achat, envoyez-moi un message privé pour recevoir un bonus gratuit + un cadeau . Tout d’abord, il est important de souligner que cet outil de trading est un indicateur sans repaint, sans redrawing et sans retard, ce qui le rend
TrendProMaster
Temirlan Kdyrkhan
MasterTrend Indicator for MT5 A powerful trend-following and signal-evaluation tool MasterTrend   is a custom MT5 indicator that combines Moving Averages and ATR-based risk/reward logic to generate clear buy/sell signals. It visualizes dynamic SL/TP levels, evaluates past trade outcomes, and displays win/loss statistics in a clean on-chart panel. Key features include: Buy/Sell signals based on MA crossovers ATR-based SL/TP1/TP2/TP3 levels with visual lines and labels Signal outcome tracking wit
Version Swing M30/H1/H4 disponible Attraper les grands mouvements ? Gold Signal Swing Pro (M30/H1/H4). Objectif : $20-$80+ par trade. https://www.mql5.com/en/market/product/177643 KURAMA GOLD SIGNAL PRO (MT5) — Système de Trading XAUUSD Complet à 7 Couches de Filtres Aucun repaint. Aucun redraw. Aucun délai. Chaque signal reste figé une fois confirmé. Bonus acheteur : Tout acheteur de la licence d'achat reçoit AI Zone Radar (valeur $59) + manuel PDF
FX Power MT5 NG
Daniel Stein
5 (32)
FX Power : Analysez la force des devises pour des décisions de trading plus intelligentes Aperçu FX Power est l'outil essentiel pour comprendre la force réelle des principales devises et de l'or, quelles que soient les conditions du marché. En identifiant les devises fortes à acheter et les faibles à vendre, FX Power simplifie vos décisions de trading et révèle des opportunités à forte probabilité. Que vous suiviez les tendances ou anticipiez les retournements à l'aide de valeurs extrêmes de D
RelicusRoad Pro MT5
Relicus LLC
4.96 (24)
RelicusRoad Pro : Système d'Exploitation Quantitatif du Marché 70% DE RÉDUCTION ACCÈS À VIE (DURÉE LIMITÉE) - REJOIGNEZ 2 000+ TRADERS Pourquoi la plupart des traders échouent-ils même avec des indicateurs "parfaits" ? Parce qu'ils tradent des concepts isolés dans le vide. Un signal sans contexte est un pari. Pour gagner, il faut de la CONFLUENCE . RelicusRoad Pro est un Écosystème Quantitatif complet . Il cartographie la "Fair Value Road", distinguant le bruit des cassures structurelles. Arrête
FX Levels MT5
Daniel Stein
5 (14)
FX Levels : Des zones de Support et Résistance d’une Précision Exceptionnelle pour Tous les Marchés Présentation Rapide Vous recherchez un moyen fiable pour déterminer des niveaux de support et résistance dans n’importe quel marché—paires de devises, indices, actions ou matières premières ? FX Levels associe la méthode traditionnelle « Lighthouse » à une approche dynamique de pointe, offrant une précision quasi universelle. Grâce à notre expérience réelle avec des brokers et à des mises à jour
Filtrer:
Aucun avis
Répondre à l'avis