Momentum Shadow Indicator
- 지표
- 버전: 1.0
- 활성화: 5

초보자도 쉽게 시장의 진짜 힘을 식별하세요.
모멘텀 섀도우 인디케이터(MSI)는 초보자와 전문가 모두에게 완벽합니다.
시장이 실제로 힘이 있는지를 보여주어, 매수 또는 매도 타이밍을 확신 있게 결정할 수 있습니다.
혼란 없음. 추측 없음.
진짜인지 아닌지를 알려주는 간단한 선만 있습니다.
✅ 매우 쉬운 사용법 — 모든 수준에 적합
✅ 명확한 매수 및 매도 신호
✅ 20분 이상 차트에 최적화, 스캘핑에도 유용
합성 변동성 지수에서 가장 잘 작동합니다 — 뉴스가 이러한 시장에 영향을 미치지 않기 때문에 순수한 모멘텀 신호를 얻을 수 있습니다.
작동 원리:
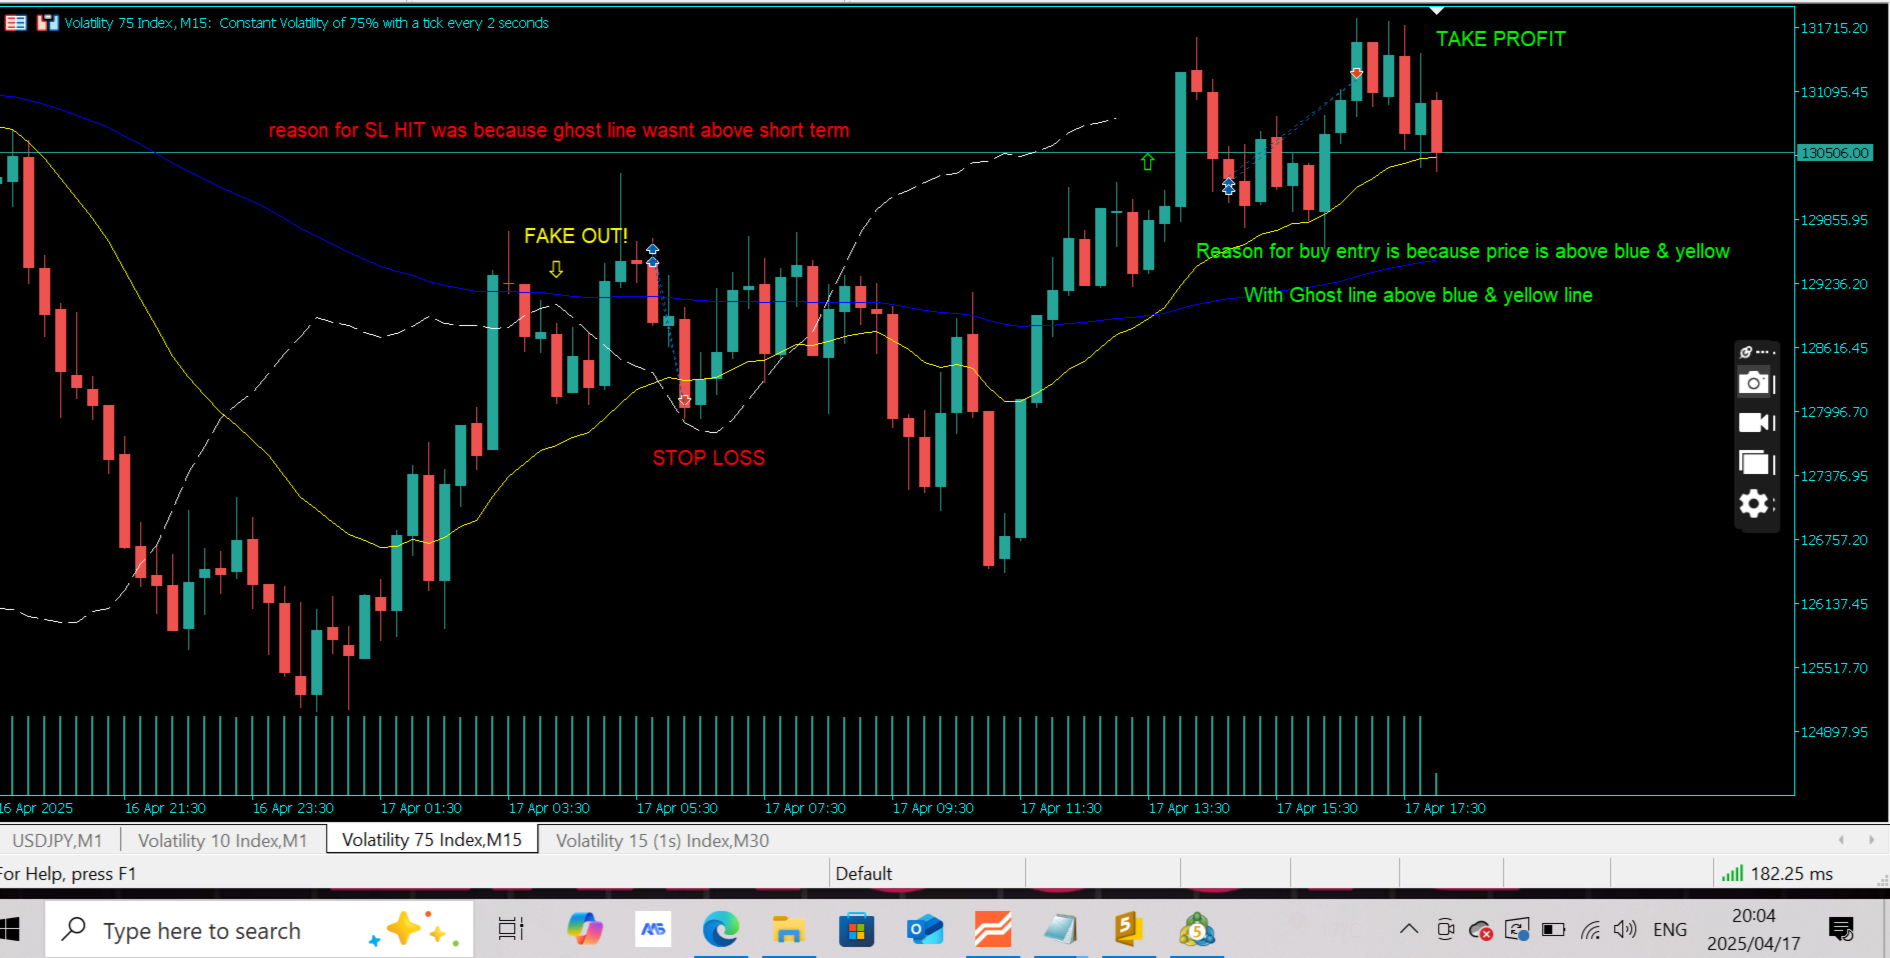
차트에는 세 개의 선이 표시됩니다:
-
단기 추세선 (노란색)
-
장기 추세선 (파란색)
-
모멘텀 섀도우 선 (흰색) — 과거 가격 움직임을 따름
매수 신호:
가격이 노란색과 파란색 선 위에 있고, 섀도우도 위에 있으면:
➤ 강한 상승 모멘텀. 매수 고려.
매도 신호:
가격이 두 선 아래로 떨어지고, 섀도우도 아래에 있으면:
➤ 강한 하락 모멘텀. 매도 고려.
가격과 섀도우가 일치하지 않으면, 모멘텀이 약하고 움직임이 지속되지 않을 수 있습니다.
추천 시간 프레임:
✅ 20분 이상 차트에서 최고의 성능
✅ 빠른 거래(스캘핑)에도 사용 가능
왜 특별한가요?:
-
가격 움직임을 모멘텀으로 확인하여 가짜 신호 제거
-
외환, 지수, 암호화폐, 주식 등 모든 시장에 사용 가능
-
간단하고 깔끔한 UI — 혼란 없음
-
추세 트레이더, 스캘퍼, 돌파 트레이더에게 이상적
MSI는 단순히 가격을 따라가는 것이 아니라, 그 뒤의 힘을 보여줍니다.
모멘텀이 실제로 움직임을 뒷받침할 때만 거래하세요.
면책 조항: 본 지표는 금융 조언이 아니며, 모든 거래 결정은 사용자 본인에게 책임이 있습니다.