Momentum Shadow Indicator
- インディケータ
- バージョン: 1.0
- アクティベーション: 5

簡単に本当の市場の強さを見抜く — 初心者でも安心。
MSI(モメンタム・シャドウ・インジケーター)は初心者にもプロにも最適です。
市場に本当に勢いがあるかどうかを示してくれるので、自信を持って「買い」や「売り」の判断ができます。
迷わない。推測しない。
本物かどうかを教えてくれるシンプルなラインだけ。
✅ とても使いやすい — すべてのレベルに対応
✅ 明確な売買シグナル
✅ 20分以上のチャートで最も効果的、スキャルピングにも対応
合成ボラティリティ指数で最も効果を発揮します。ニュースの影響を受けないため、純粋なモメンタムシグナルを得られます。
仕組み:
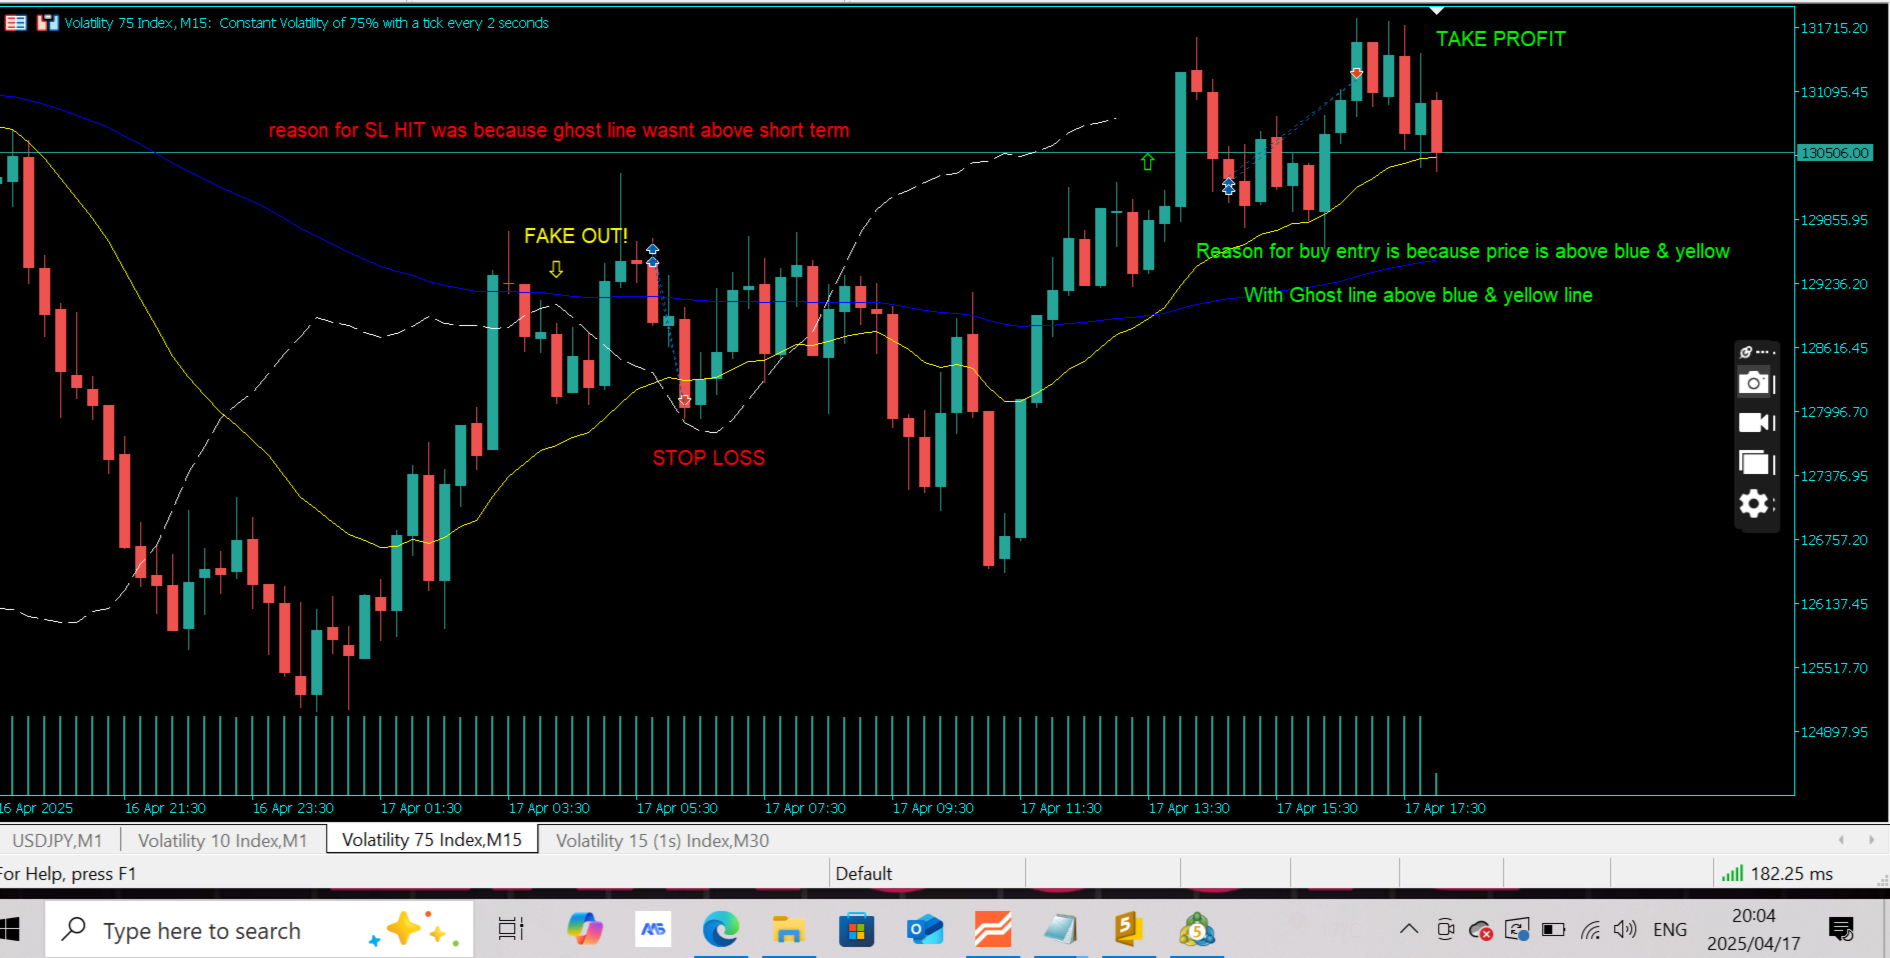
チャート上に3本のラインを表示:
-
短期トレンドライン(黄色)
-
長期トレンドライン(青色)
-
過去の価格を追うモメンタムシャドウライン(白色)
上昇シグナル:
価格が黄色と青色のラインを上抜け、シャドウも上にある場合:
➤ 強い上昇モメンタムを示し、買いのチャンス。
下降シグナル:
価格が両ラインを下抜けし、シャドウも下にある場合:
➤ 強い下降モメンタムを示し、売りのチャンス。
シャドウが価格と一致していない場合、モメンタムが弱く、動きが持続しない可能性があります。
おすすめ時間軸:
✅ 20分足以上で高精度なシグナル
✅ 短期トレードにも対応
他との違い:
-
モメンタムで価格の動きを確認し、ダマしを排除
-
すべての市場で使用可能:FX、株、仮想通貨、指数など
-
シンプルで見やすい設計
-
トレンドトレーダー、スキャルパー、ブレイクアウトトレーダー向け
MSIは単なる追従ではなく、背後にある力を見せてくれます。
本物のモメンタムがある時だけトレードしましょう。
免責事項: このインジケーターは教育ツールであり、投資アドバイスではありません。