 MetaTrader 5
 专家
专家
 指标
指标
 程序库
程序库
 实用工具
实用工具
 窗口小部件
窗口小部件
 规则
规则
适用于MetaTrader 5的免费技术指标 - 45
 技术指标的信号外汇和股票市场的开仓交易和平仓交易起着至关重要的作用。指标的本质就是一种交易品种的数学转换,旨在预测未来的价格变化。
测试技术指标可以更有利于预测市场行为并从中获利。
技术指标的信号外汇和股票市场的开仓交易和平仓交易起着至关重要的作用。指标的本质就是一种交易品种的数学转换,旨在预测未来的价格变化。
测试技术指标可以更有利于预测市场行为并从中获利。 
The ATR (Average True Range) Indicator is a powerful tool designed to measure market volatility. This indicator provides accurate data on price movement ranges, helping traders manage risk more effectively and make well-informed trading decisions. Based on the widely-used ATR indicator, it’s suitable for both professional and beginner traders to analyze market volatility. The ATR Indicator allows you to track the current price movement range and use this information to set stop-losses, select en
FREE

How to Read DeepEdge DeepEdge is designed to make the current setup easy to understand directly from the chart. When a BUY setup is detected: A BUY arrow is displayed around price The current trend conditions support a bullish setup An ATR-based Stop Loss reference can be displayed below the setup An ATR-based Take Profit reference can be displayed above the setup When a SELL setup is detected: A SELL arrow is displayed around price The current trend conditions support a bearish setup An ATR-bas
FREE

Squat Bar Marker is an indicator for MetaTrader 5 that detects Bill Williams MFI bar types and displays them directly on the price chart. Supported bar types: Green Bar — MFI and volume are rising; Fade Bar — MFI and volume are falling; Fake Bar — MFI rises while volume falls; Squat Bar — MFI falls while volume rises. Chart display: green bars — Green Bar; brown bars — Fade Bar; blue bars — Fake Bar; pink bars — Squat Bar. Display modes: no coloring; only Squat bars; all bar types. The indicator
FREE

Lazyyy Hotkeys & Period Separators Lazyyy Hotkeys & Period Separators is a lightweight productivity tool designed to speed up your chart navigation and improve market structure visualization in MetaTrader 5. It combines custom keyboard shortcuts with automatic period separators , helping traders stay focused, organized, and efficient during analysis. Key Features ️ Custom Hotkeys for Timeframes Instantly switch between timeframes using your keyboard: M1 → MN (fully customizable keys) No mo
FREE

QUANTUM VIXES EMPEROR - AI Trading System for Deriv VIX Indices Professional indicator designed exclusively for Volatility Indices (VIX 10, 25, 50, 75, 100). This wont work in FOREX GOLD, EUR-USD. Please test it on Synthetic indices such as Volatility Indices (VIX 10, 25, 50, 75, 100) KEY FEATURES Auto VIX Detection Automatically identifies which VIX index you're trading and applies optimal settings for that specific index. For any further about the indicator kindly contact me here on ht
FREE

opnMAX Sysifus: Indicator Overview Traditional Volume Profile and TPO (Time Price Opportunity) indicators suffer from a fatal flaw: they rely on hundreds of heavy graphical objects that lag the MetaTrader 5 terminal, drain CPU resources, and interfere with Expert Advisor execution. opnMAX Sysifus is engineered to solve this. It is a razor-sharp, highly optimized structural mapper that dives into granular 1-minute tick data to reveal exactly where institutional liquidity is parked and where sudd
FREE
Simple SuperTrend indicator, similar to that of TradingView's.
It has buffers for buy and sell signal, if you want to integrate this into an EA.
It helps traders easily identify trends by providing clear buy and sell signals based on price movements. Designed for simplicity, it’s easy to use and integrates well with various trading strategies, making it a great option for traders of all levels.
Happy trading!
FREE

by installing this indicator you can create a horizontal line with the click of a button press Q = to create a horizontal line at the location of mouse pointer press W = to delete all existing horizontal lines press E = to delete the horizontal line nearest to your mouse pointer WANT SIMILAR INDICATOR for PRICE ALERT ?? CHECK OUT MY OTHER PRODUCTS https://www.mql5.com/en/market/product/165765
by default the line is blue with dashes and price highlighted on the line, but its fully customizable
FREE

# Statistic Titan — Lịch Sử Giao Dịch Của Bạn, Được Biến Thành Huyền Thoại
**Lịch trình hiệu suất hàng tháng hiển thị ngay trên biểu đồ của bạn — không cần bảng tính, không cần ứng dụng bên thứ ba, không cần xuất dữ liệu.**
Hầu hết các nhà giao dịch theo dõi kết quả trong một mớ hỗn độn các báo cáo của nhà môi giới, sổ tay và các tab Excel, những thứ nhanh chóng trở nên lỗi thời ngay khi một giao dịch mới kết thúc. Statistic Titan thay thế tất cả những điều đó chỉ bằng một cái nhìn: toàn bộ
FREE

Precision Trailing Stop is a dynamic trailing stop indicator that anchors itself to real market structure instead of lagging moving averages or fixed ATR multiples. It identifies key structural price levels on both sides of the market, builds adaptive support and resistance bands, and engages a ratcheting stop that only moves in your favour. As market structure evolves, outdated levels drop out of the calculation automatically. The result is a trailing stop that stays tight to price action when
FREE

Probability emerges to record higher prices when Commodity Channel Index breaks out oscillator historical resistance level when exhibit overbought values. Since, oscillator breakout of support and resistance have similar effect as price breaks support and resistance levels, therefore, its highly advised to confirm price breakout with oscillator breakout; certainly, will have the same output in short trades. Concept is based on find swing levels which based on number of bars by each side of peak
FREE

This indicator sums up the difference between the sells aggression and the buys aggression that occurred in each Candle, graphically plotting the waves of accumulation of the aggression volumes. Through these waves an exponential average is calculated that indicates the direction of the business flow.
Note: This indicator DOES NOT WORK for Brokers and/or Markets WITHOUT the type of aggression (BUY or SELL). Be sure to try our Professional version with configurable features and alerts: Agre
FREE

Volume Flow Indicator (VFI) - User Manual 1. General Introduction The Volume Flow Indicator (VFI) is an advanced technical oscillator designed to measure the strength and sustainability of a price trend by incorporating both price and volume data. Developed based on the concepts of On-Balance Volume (OBV) but with significant improvements, the VFI provides deeper insight into money flow and the conviction behind price movements. This indicator is not an automated trading system but a powerful an
FREE

The Box Range Indicator for MT5 helps traders visualize key price zones by automatically detecting and highlighting market structures. It dynamically draws upper, lower, and middle levels based on price action, making it an effective tool for identifying support and resistance zones, breakouts, and trend reversals .
Key Features: • Automatic Box Detection – Identifies price ranges based on market movements. • Dynamic High and Low Updates – Adjusts in real time to reflect market conditions.
FREE

Session Highs and Lows Essential market levels. Clear. Simple. Powerful. Daily & Weekly Levels is a lightweight and fully customizable MetaTrader 5 indicator that automatically plots important reference levels directly on your chart. No complicated calculations or unnecessary clutter, just the levels you need to quickly understand the previous day's and week's price range. Key Levels The indicator can display: Daily Open Previous Day High Previous Day Low Previous Week High Previous Week Low
FREE

Limited-time free release: Adaptive SuperSmoother Trend Signals MT5 is free while MetaCoderStore collects trader feedback, comments, and feature requests for the first public version. Adaptive SuperSmoother Trend Signals MT5 plots a low-lag adaptive SuperSmoother line on price, adds optional ATR bands, and marks filtered bullish or bearish cross signals with EA-readable buffers. Use cases Follow a smoother adaptive trend line without adding heavy lag. Find price crosses that agree with the curre
FREE

Indicator Description 4 Hull MA Color + Envelopes is a powerful trend-following indicator for MetaTrader 5 that combines four Hull Moving Averages (HMA) with Moving Average Envelopes to clearly identify market direction, trend strength, and potential reversal or pullback zones. This indicator is designed to reduce noise, react quickly to price movement, and provide a clean visual structure for professional trading. Key Features 4 Hull Moving Averages (20, 50, 100, 200) Automatic color change
FREE

Clear Signal AI — No‑Repaint Trend Confirmation + Trend Dashboard Clear Signal AI is a trend confirmation indicator built for fast, confident decisions. It combines confirmed on‑chart signals (designed to avoid repainting behaviour), SAR trend structure, multi‑timeframe alignment (M15/H1/H4) and a live confidence score — with a clean dashboard and optional alerts. Product overview Clear Signal AI is designed for traders who want clarity, structure and consistency. It provides: Confirmed trend ar
FREE

1. Overview The ATR Dynamic Stop (CE) is a powerful technical indicator designed to help traders identify and follow market trends. Its core function is to provide a dynamic trailing stop-loss based on price volatility, as measured by the Average True Range (ATR) indicator. The main objectives of the ATR Dynamic Stop are: Profit Optimization: It helps you ride a strong trend by setting a reasonable stop-loss, preventing premature exits due to minor market noise and fluctuations. Risk Management:
FREE

Esse Indicador é uma boa opção para quem gosta de operar a longo prazo e com paciência. Ele trabalho com os níveis de fibo na media de 200 são 9 níveis onde você pode operar nas reversões o mercado partir do níveis abaixo. Level 1 = 550 pontos Level 2 = 890 pontos Level 3 = 1440 pontos Level 4 = 2330 pontos Level 5 = 3770 pontos Level 7 = 9870 pontos Level 8 = 15970 pontos Level 9 = 25840 pontos Level 6 = 6100 pontos
FREE

Fair Value Gaps (FVG) and Liquidity Voids are price ranges you can exploit for better entries and exits on your trades. They're similar concepts, so let's look at them from the top and break it down. Think of FVG and Liquidity voids as soft-spots in the market. They are paths of least resistance. That doesn't mean price will go through them, but price could go through them more easily.
To find and locate it is easy but tidiest to repeat the same thing all over again. This helps to boost your t
FREE

GoldEdge Signal Indicator
Description
Professional signal indicator for XAUUSD (Gold) based on a validated trend-pullback strategy. Draws BUY/SELL arrows on the chart with calculated SL/TP levels, a real-time dashboard, and popup alerts.
Validated edge: PF 1.44 / Sharpe 3.87 / Max DD 3.95% (12-month backtest, real ticks).
What It Does
- BUY/SELL arrows drawn directly on the chart at signal bars
- Entry, SL, and TP horizontal lines for the last signal (visual trade setup)
- Live dashboard sho
FREE
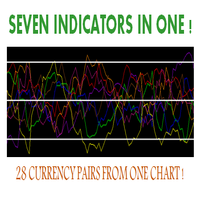
Hello, This indicator is a unique high reliability 7-in-1 multicurrency indicator comprising these sub-indicator’s: A Trend Power Crossover Indicator. A Percent Change Crossover Indicator. A Currency Overbought/Oversold Indicator. A Currency Deviation Indicator. A Currency Impulse Signal Indicator. A Trend Power Indicator. A Currency Volatility Indicator. The main advantage of this indicator is that it's reasoning by currency and not by currency pair. The values of each sub-indicator are calcula
FREE

Pivot Points Classic – L’indicatore essenziale per ogni trader tecnico Questo indicatore disegna automaticamente i livelli di Pivot Point più utilizzati dai trader professionisti, con supporto completo a 4 metodi di calcolo: Metodi supportati :
• Traditional
• Fibonacci
• Woodie
• Camarilla Caratteristiche principali :
Calcolo su timeframe superiore (multi-timeframe)
Visualizzazione chiara dei livelli P, R1, R2, R3, S1, S2, S3
Etichette dinamiche con nome e valore del livello
Colori per
FREE
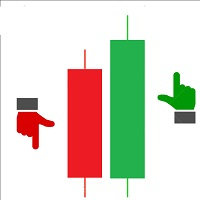
Maximum Minimum Candle indicator is a basic indicator (but useful) that shows the highest and lowest candle in a period of time .
The indicator shows the maximum candle and the minimum candle for a defined period of time. You can choose the number of candles that make up the period The indicator will show with color points the maximum and minimum values. A message tells you when the price reaches the maximum or minimum.
Parameters number_of_candles: It is the number of candles that will be c
FREE

Description:
The Dynamic Color Stochastic is an enhanced version of the classic Stochastic Oscillator that provides instant visual feedback on market momentum through color-coded line transitions. Unlike the standard indicator, this version automatically changes the color of both the Main (%K) and Signal (%D) lines based on their relative positions. This allows traders to identify bullish and bearish crossovers instantly without squinting at the lines. Bullish Momentum (Green): When the Main
FREE

The DailyWeeklyMarkers indicator helps traders visualize trading weeks by clearly marking the start of each day and week on the chart. It draws vertical separator lines for each day (including weekends if enabled) and highlights the beginning of new trading weeks with double lines for better clarity. This makes it easier to analyze price action within daily and weekly contexts. Who Is This Indicator For? Swing Traders – Helps identify weekly opening gaps and key levels. Day Traders – Vis
FREE

Liquidity Momentum Pulse (LMPX) 产品介绍
Liquidity Momentum Pulse(LMPX)是一款技术指标,用于通过结合市场参与度和价格加速度来衡量真实的市场压力。 该指标计算: 归一化成交量 :成交量 / 成交量移动平均 价格动量 :价格变化率(ROC) 最终数值为归一化成交量与动量(ROC)的乘积,从而生成一个复合信号,可用于: 识别由高于平均水平的成交量支持的价格波动 判断市场处于零轴以上或以下的趋势状态 发现可能的吸筹或派发阶段 主要特点 支持外汇、指数、贵金属及加密货币市场 适用于所有时间周期 可自定义报警阈值 零轴趋势判断 参数完全可调 参数说明 Use Real Volume – 选择使用真实成交量或Tick成交量。 Volume SMA Period – 用于归一化成交量的移动平均周期。 ROC Lookback – 计算价格变化率(ROC)所使用的K线数量。 Price Type – 计算所采用的价格类型(收盘价、典型价、中间价)。 ROC Percent – 启用百分比方式计算ROC。 Output Scale – 输出信
FREE

VWAP_PC_MQL5 — 一个简单的自制 VWAP 类指标,在 MT5 图表上实时显示成交量加权平均价。 时间框架:
适用于所有周期。 品种:
兼容外汇、指数、大宗商品和股票。 参数: AppliedPrice – 用于计算的价格类型(收盘价、典型价、加权价等) LineColor / Width / Style – 线条样式设置 SessionReset – 可每日重置或连续模式 工作原理(VWAP 原理):
VWAP(成交量加权平均价)计算公式为: VWAP = (价格 × 成交量之和) / (成交量之和) 它反映买卖双方的动态平衡:
价格 高于 VWAP → 多头占优;
价格 低于 VWAP → 空头占优。 简短结论:
VWAP_PC_MQL5 是一个轻量级的 VWAP 工具,结构简单但实用,帮助学习和分析成交量行为。
FREE
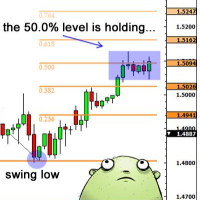
交易实用必备工具指标 波浪自动计算指标,通道趋势交易 完美的趋势-波浪自动计算通道计算 , MT4版本 完美的趋势-波浪自动计算通道计算 , MT5版本 本地跟单复制交易 Easy And Fast Copy , MT4版本 Easy And Fast Copy , MT5版本 本地跟单复制交易 模拟试用 Easy And Fast Copy , MT4 模拟账号运行 Easy And Fast Copy , MT5 模拟账号运行 Fibo: 来源于KTrade 1.自动计算分析波段.->得出所需波段 2.画出斐波那契 回撤线,以及扩展线作为参考 指标波段分析如何得来->请参考如下 波段分析来源于波浪分析指标↓↓↓ 波浪自动计算指标,通道趋势交易 完美的趋势-波浪自动计算通道计算 , MT4版本 完美的趋势-波浪自动计算通道计算 , MT5版本
FREE

Indicator that show candlestick bars with an different sampling method than time fixed. Real time data is sourced to the indicator and it may be used as substitute of the default graph. Each bar is formed when a predefined amount of ticks is received, showing in the graph the OHLC of this clusteri of ticks. The input variable is the amount of ticks of each bar. It's a different approach of sampling, the amount of bars is proportional to the amount of negotiations insted of a sample in a fixed am
FREE
This indicator is a very simple indicator that draws candlesticks on a chart. However, it is possible to draw not only on the main chart but also on several sub-charts. In addition,it is possible to draw different symbols and timeframes from the main chart. features. 1. any symbols 2. any timeframes 3. two candle type(normal and heikin ashi) 4. many candle colors(intersection with ma_1) 5. pivot line (ver1.2) In case of positive candle, FULL : change color if low is over ma_1 PARTIAL :
FREE

Double Correlation indicator (free) plots two windowed correlations in a separate window. the size of window is taken as input before the two symbols to correlate to. Two symbols are taken as an input parameters as well as period length. and the two correlations are computed with the currently shown symbol ex: input GBPJPY and AUDNZD. current symbol EURUSD then the following will be computed corr(EURUSD,GBPJPY) and corr(EURUSD,AUDNZD) The indicator can be useful to run a multi-symbol pair trad
FREE
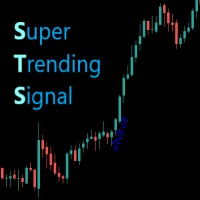
O indicador Supertrendingsignal imprime um sinal na tela indicando início de uma forte tendência. O sinal não mostra o ponto de entrada com melhor risco retorno, apenas faz a indicação de uma forte tendência. Foi idealizado a partir de um conjunto de médias móveis e volume. Parametros: Periodmalongo: Períodos da média longa Periodmamedio: Períodos da segunda media Periodmamedio2: Perídos da terceira media Periodmacurto: Períodos da média curta. PeriodATR: Períodos do indicador ATR para adequar
FREE
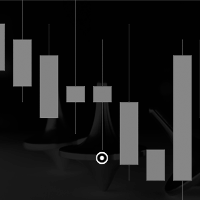
真正的陀螺指示器
它检测图表上准确的陀螺,平衡的主体和灯芯高度比,这是陀螺的真正含义,不同于锤子和十字线或空烛台。
该指标在图表上找到的陀螺数量处绘制了一个翼形图标。
设置包括
条数:调整搜索条数
图标颜色:更改图标颜色
图标代码:更改图标的wingdings代码
真正的陀螺指示器
它检测图表上准确的陀螺,平衡的主体和灯芯高度比,这是陀螺的真正含义,不同于锤子和十字线或空烛台。
该指标在图表上找到的陀螺数量处绘制了一个翼形图标。
设置包括
条数:调整搜索条数
图标颜色:更改图标颜色
图标代码:更改图标的wingdings代码
真正的陀螺指示器
它检测图表上准确的陀螺,平衡的主体和灯芯高度比,这是陀螺的真正含义,不同于锤子和十字线或空烛台。
该指标在图表上找到的陀螺数量处绘制了一个翼形图标。
设置包括
条数:调整搜索条数
图标颜色:更改图标颜色
图标代码:更改图标的wingdings代码
FREE

The indicator plots three lines on the chart — an upper band, a moving average, and a lower band — forming an envelope around price. On each bar it computes a momentum value by subtracting the price n bars ago from the current price (where n is the momentum period). This captures how fast price is moving, not just where it is. It then looks back over the last period bars and sums up the squared momentum values. The square root of that average gives a momentum-based standard deviation — essential
FREE

Want to AUTOMATE this strategy? We have released the fully automated Expert Advisor based on this logic. Check out Range Vector Fibo Logic EA here: https://www.mql5.com/en/market/product/158065
UPGRADE AVAILABLE: Tired of manual trading? I just released the Automated MTF Version with Mobile Alerts and Auto-Targets. Get the Pro Version here: https://www.mql5.com/en/market/product/159350 Range Vector Fibo Logic (Indicator) One Candle Strategy Stop waking up at 3 AM to draw lines manually. Range
FREE

这是一款适用于 MetaTrader 5 的多品种仪表板指标,可同时提供多达 20 个交易品种的市场倾向(bias)和价格区间状态的实时概览。其专业版(Pro Version)包含通知功能,可在 Mql5 商店获取。
主要特点:
可加载至任意图表 — 运行独立于图表当前的交易品种。
实时仪表板表格,显示:
当前价格
日、周、月度倾向(当前价格与对应周期开盘价的对比)
日、周、月度区间状态:
HIGH(高位)→ 价格突破上一周期的最高点(看涨突破)
LOW(低位)→ 价格跌破上一周期的最低点(看跌突破)
NO BIAS(无倾向)→ 价格仍处于上一周期的区间内
整体倾向 — 基于日/周/月度倾向的多数投票结果(看涨或看跌)
智能通知(仅在 M15 K 线收盘时触发以减少干扰):(仅限专业版)
整体倾向变化
区间突破(高点/低点)
单个周期倾向反转
首次加载时:发送所有品种的综合汇总信息
视觉自定义:
通过按钮切换仪表板显示/隐藏
可调整宽度、颜色和字体大小
支持按倾向排序(看涨品种置顶)
支持任意交易品种(外汇、黄金、指数等) — 只需输入“市场报价
FREE

DS True Open Sessions V2.6 Daily, Weekly, Monthly, Quarterly and Yearly Open Levels Indicator for MetaTrader 5 DS True Open Sessions V2.6 is a MetaTrader 5 indicator that automatically calculates and displays major market opening levels on the chart. The indicator plots: Daily Open Weekly Open Monthly Open Quarterly Open Yearly Open Each level is calculated from the corresponding market period opening price and displayed as a horizontal chart reference. Features Daily Open Displays the opening p
FREE

Ultimate MACD MTF Pro 是经典 MACD 的强大升级版 — 专为现代交易重新设计。 该指标为您提供 多周期 MACD (MTF)、动态直方图颜色、信号交叉标记以及基于动量的智能线条变色功能 。 专为追求清晰信号、早期趋势检测和专业级视觉清晰度的交易者打造。 主要功能 多周期 MACD (MTF) 轻松在当前图表周期或更高周期(H1, H4, D1…)之间切换。 非常适合自上而下的趋势确认。 清晰的 MACD 和信号线 – 可调节线条宽度 – MACD 穿过信号线时自动变色 – 平滑且视觉清晰的设计 5 色智能直方图 直方图根据以下情况变为 5 种不同颜色: 动量增加 动量减少 零轴上方或下方 趋势转变方向 这让您可以即时洞察趋势强度和反转。 交叉点(入场/出场点) 当 MACD 穿过信号线时,指标会绘制清晰的点: 绿色点 = 看涨交叉(买入机会) 红色点 = 看跌交叉(卖出机会) 非常适合发现早期反转。 高度可定制 您可以显示/隐藏: MACD 线、信号线、直方图、交叉点、MTF 模式、变色模式。 还包括
FREE
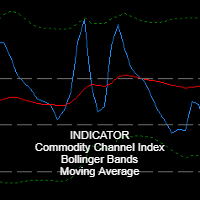
Main Indicator Description: RosMaFin Triple Insight CCI Navigator is an advanced technical indicator that combines the power of three popular indicators - CCI (Commodity Channel Index), Bollinger Bands, and Moving Average - in one comprehensive window. This versatile tool provides traders with a complex view of market conditions and helps identify potential trading opportunities with greater precision. Key Features: Display of all three indicators in one window for efficient analysis Fully custo
FREE

Algorion ScanMaster – Fusion Horizon Professional Multi-Symbol Confluence Scanner for MetaTrader 5 Algorion ScanMaster – Fusion Horizon is a professional multi-symbol market scanner for MetaTrader 5 that continuously monitors your watchlist and identifies the strongest trading opportunities using a proprietary 4-Factor Fusion Engine . Instead of manually switching between dozens of charts, ScanMaster analyzes multiple symbols and multiple timeframes simultaneously, ranks them by overall confluen
FREE

Volume Profile Custom Pro Volume Profile Custom Pro est un indicateur MetaTrader 5 permettant d'afficher la distribution des volumes directement sur le graphique sous forme d'histogramme horizontal. L'indicateur analyse les volumes sur une plage configurable de bougies et met en évidence les zones de prix les plus échangées afin d'identifier rapidement les niveaux clés du marché. Fonctionnalités Profil de volume horizontal en temps réel Nombre de bougies analysées configurable Nombre de ni
FREE

The Magic LWMA indicator is of great help in determining trend direction. It can be an excellent addition to your existing strategy or the basis of a new one. We humans can make better decisions when we see better visually. So we designed it to show a different color for rising and falling trends. Everyone can customize this in the way that suits them best. By setting the Trend Period, we can optimize it for longer or shorter trends for our strategy. It is great for all time frames.
IF YOU NEE
FREE

SuperTrend Indicator for MetaTrader 5 The SuperTrend Indicator is a classic trend-following tool designed to help traders identify the current market direction with clarity and precision. Based on Average True Range (ATR), it dynamically adapts to price volatility to outline potential support or resistance levels in trending markets. Key Features Trend Visualization
Displays color-coded trend lines directly on the chart:
• Uptrend – green line
• Downtrend – red line Signal Arrows
Shows arrows
FREE
MultiPip Range Label v2 — Lightweight Daily/Weekly/Monthly Pip Stats
MultiPip_RangeLabel_v2 is a zero-plot, ultra-light indicator that prints a compact, draggable text panel with objective range statistics—perfect for order-flow and breakout traders who need quick context without clutter.
No backgrounds, no heavy drawing—just crisp labels you can park anywhere on the chart. The header is draggable; all lines move together.
What it shows
Today – current day’s range (high–low) in pips
Last D
FREE

Donchian MTF + ZigZag + arrow logic 100% intact and just tacks on the reversal averaging. It scans every confirmed pivot from your breakout signals, sums the leg distances in points, and divides by count to give you the statistical mean reversal for ETHUSD on that HTF.
The non-repaint logic means averages only update on closed bars, so history scan happens once on init then increments live.
Can also work with others asset
FREE

This is an ordinary MACD indicator displayed in the main window according to the selected chart style, i.e. Bars, Candlesticks or Line. When you switch the chart type, the indicator display also changes. Unfortunately I could not improve the chart type switching speed. After switching, there are delays before the arrival of a new tick.
The indicator parameters Fast EMA period Slow EMA period Signal SMA period Applied price
FREE

DailyHiLo Indicator
Master the daily range like a pro. This indicator automatically plots the previous day’s high and low levels —a core element in the (Beat The Market Maker) trading approach—directly on your chart. These levels act as natural boundaries for intraday price action, helping traders identify potential reversal zones, breakout points, and liquidity targets. Key Features Accurate plotting of yesterday’s high and low for any symbol and timeframe. Works seamlessly with BTMM-inspired
FREE
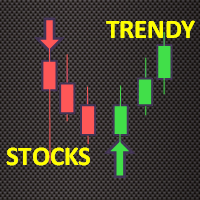
Trendy Stock is a price following indicator that uses Stochastic to show when the price is out of the oversold or overbought areas. The algorithm allows you to stay longer in a trend where the bulls or bears are in control. The indicator changes color immediately the price exits oversold/overbought state. In short, the downtrend [red] bars start to paint when the buying pressure decreases while the uptrend [green] bars form as the buy pressure kicks in. For MT4 version, follow :: https://www
FREE
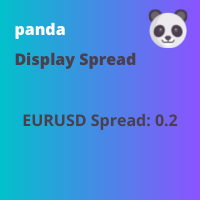
This indicator displays the spread Simple and easy to use and fully customisable: View as Pips or Pipettes Chart symbol can be hidden Text display can be changed Change color and text styles Add or hide a decimal point Spacing options between inputs Default screen positions Screen position inputs
How to use 1. Simply use the default settings; or 2. Choose to show pips or pipettes; 3. Choose to display symbol, text or decimal; 4. Choose where to place it on the screen; 5. Save settings or save
FREE

RPMS-IND — Range Probability Multi-Pair Scanner by XBK Systems Overview RPMS-IND is a multi-symbol scanner indicator for MetaTrader 5. Instead of switching between dozens of charts to see what's setting up, RPMS-IND continuously analyzes every symbol you choose — Forex majors and minors, metals, energies, crypto, indices, or literally your broker's entire symbol list — and ranks them in one live panel, refreshed automatically every few seconds. Each symbol is scored on how compressed its range i
FREE

Indicator and Expert Adviser EA Available in the comments section of this product. Download with Indicator must have indicator installed for EA to work.
Mt5 indicator alerts for bollinger band and envelope extremes occurring at the same time. Buy signal alerts occur when A bullish candle has formed below both the lower bollinger band and the lower envelope Bar must open and close below both these indicators. Sell signal occur when A bear bar is formed above the upper bollinger band and upper
FREE
本产品接收指标/信号工具的信息,在满足特定条件时显示箭头或通知。
例如,当MA25和MA50交叉、SAR反转、MACD改变正负值或收盘价穿过布林线时,都会显示箭头和通知。
具体配置请参考示例设置图。
详细手册和配置文件:
https://www.mql5.com/en/blogs/post/755082
免费版本也可供下载。
箭头可以以多种配置显示,组合方式无限,任您想象。
如果您在设置与信号工具和指标的链接时遇到困难,请联系我们寻求帮助。
我们还可以向您的智能手机、电子邮件、Slack、Line、Discord等推送通知,最多添加8个参数,或根据您的要求单独链接到指标。您可以将其用作信号工具的补充或事件的通知功能。 https://www.mql5.com/zh/users/mt4kabukimono
FREE

Multi-Symbol Chase Mirror 只读取账户自己已经收盘的成交历史,只数一件事:一共在多少个不同的品种上开过新仓。它不预测,也不给建议。面板上的每一个数字,都是这个账户上已经发生过的事。
数字是怎么算出来的:它读取最多 31 天的已收盘成交,覆盖所有品种、所有魔术号——统计的是整个账户,不是当前图表上的这一个品种。Symbols traded today 统计从服务器时间今天零点以来、有过新开仓的不同品种数;Symbols in last 60min 统计同一件事,只是窗口换成滚动的 60 分钟——这两项无论结果是不是零,都会显示真实数字。从今天往前的 30 天,另外单独算出 30d daily median:这段时间里每天交易品种数的中位数,用中位数而不是平均数,是为了一天异常活跃不会拖动整条基准线。如果这 30 天内新开仓不到 5 笔,历史样本就不够建立一条公平的基准线,这时只有 30d daily median 这一项会显示 "Collecting history",而不是用太少的数据硬凑出一个数字——today 和 last 60 minutes 这两项照样
FREE

Stop guessing. Start reading the market like a pro. The MBS Indicator is a powerful multi-timeframe trend scoring system designed to give you a clear, data-driven bias using the most trusted tools in trading: EMA • RSI • ATR • Stochastic No more indicator clutter.
No more confusion.
Just one clean panel that tells you exactly what’s happening. WHAT THIS INDICATOR DOES The MBS Indicator analyzes the market across: D1 (Daily Trend) H4 (Structure Direction) H1 (Entry Momentum) It then combines ev
FREE

Resistance and Support is an easy to use indicator to apply horizontal lines of resistance and support. There are two windows for adding levels. When you press the button, a line appears on the price chart. It is possible to move this line with the mouse, thereby changing the indicator readings. In the indicator menu there is a choice of possible alerts - no alert, alert on touching the level and an alert for closing the candle after the level.
FREE

CCI Multi-Timeframe Dashboard shows the CCI reading of four timeframes at the same time, so you can measure momentum extremes across the market at a glance. By default it displays the M15, H1, H4 and D1 timeframes, and the period, applied price and levels are configurable. Each timeframe is color coded, with red when the reading is above the upper level, green when it is below the lower level and grey when it is in the normal zone, which makes stretched conditions easy to see. Alerts are based o
FREE

This indicator solves the problem of chart scaling where the bar becomes too thin and it becomes difficult to determine the bar's open and close prices.
Thick Bar indicator - allows you to change the thickness of the lines and the color of the stroke, due to which you can get a thicker bar on the chart. The default indicator has a bar thickness of 2 and preset colors that can be changed in the settings
FREE

BrioQuant Position Monitor keeps your floating result where your eyes already are: beside the newest candle at the current price. Show this symbol's positions or the whole account, in cash and as a percentage of balance or equity, with optional entry lines and a per-position label for every open trade on the chart symbol. Features: - Floating readout rides the newest candle at current price height - no corner panel to glance away at - Scope: this symbol or the whole account; swap included or exc
FREE

The MetaTrader 5 Position Indicator is a custom technical tool designed to enhance traders' ability to monitor and manage their positions effectively. It displays key trade details such as stop-loss (SL), take-profit (TP), groups them where they are the same, average buy price, and average sell price directly on the chart. Costs accounted for. Key Features:
Displays TP and SL levels
Groups TP and SL levels where they are the same
Shows average buy and sell price levels Candlestick countdown Pan
FREE

The Martinware Volume indicator plots a colored moving average over volume bars. The coloring uses three colors and can be done in different ways choosable by the user and is applied both to the average as to the volume bars.
Three types of coloring are possible: None: no coloring is done Increasing or decreasing: changes the color depending on the current value being bigger or lesser than the previous one Volume relative to average: colors vary if the current volume is bigger or lesser then
FREE
具有双线信号、零水平系统、多时间框架支持、可自定义视觉信号和高度可配置警报系统的高级相对活力指数(RVI)指标。
自由编程服务、更新和其他 TrueTL 产品可在我的 MQL5 资料页 上获取。
非常感谢您的反馈和评价!
什么是相对活力指数(RVI)? 相对活力指数(RVI)是由 John Ehlers 开发的动量振荡器,通过将收盘价与开盘价进行比较(以交易区间为标准化基准),来衡量近期价格走势的可信度。其基本原理是:在牛市中,收盘价往往高于开盘价;而在熊市中则相反。 RVI 在零线附近振荡——正值表示看涨动量,负值表示看跌动量。该指标由两条线组成:主线(RVI 值)和信号线(主线的 4 根K线对称加权移动平均线)。两条线之间的交叉通常被用作进场和出场信号。 功能: 具有零水平参考系统的双线 RVI(主线和信号线) 具有三个独立可配置信号缓冲区的视觉信号标记(箭头、垂直线) 高级信号检测:方向变化、线交叉、级别交叉、两条线的峰值/谷值 可配置的警报功能(电子邮件、推送、声音、弹出窗口),带有时间范围过滤 带插值的多时间框架(MTF)、多种颜色模式以及用于 EA 集成的 iCust
FREE

Here is the full technical and strategic description for the Gann Square of 9 indicator. Full Name Gann Square of 9 - Intraday Levels (v2.0) Overview This is a mathematical Support & Resistance indicator based on W.D. Gann's "Square of 9" theory. Unlike moving averages which lag behind price, this indicator is predictive . It calculates static price levels at the very beginning of the trading day (based on the Daily Open) and projects them forward. These levels act as a "road map" for the day,
FREE

Titan Gold Visual Hunter V3.0 像机构一样洞察市场。 “不再猜测。不再滞后指标。只有纯粹的视觉精度。” 专为 XAUUSD(黄金) 的爆炸性波动而设计,Titan Gold Visual Hunter V3.0 不是又一个形态扫描器。它是一个 完整的视觉交易系统 ,能过滤市场噪音并提供高概率的交易机会。 为什么选择 Titan Gold V3.0? 为黄金而生 – 专为 XAUUSD 的独特行为模式设计 零延迟信号 – 形态确认瞬间即时提醒 风险优先设计 – 仅显示数学上具备合理风险回报比的信号 适用于 M5 和 M15 – 完美适配剥头皮和日内交易 视觉信号 蓝色箭头 → 高概率买入信号 红色箭头 → 高概率卖出信号 ️ 推荐设置 品种: XAUUSD(黄金)及主要货币对 时间框架: M5 或 M15 账户类型: ECN / Raw Spread / 低点差账户 “Titan Gold Visual Hunter V3.0 不预测未来。它告诉你,概率站在你这边。”
FREE

Our offer also includes a free panel — Indicator Panel — which allows you to show or hide indicators created by BOToBRACIA -> MT4 / MT5 Our offer also includes a version for MetaTrader 4 -> https://www.mql5.com/en/market/product/171186?source=Site+Market+My+Products+Page
Pivot Points are a classic technical analysis indicator that calculates the central pivot point (PP) as well as support (S1–S3) and resistance (R1–R3) levels based on the previous day’s High, Low, and Close.
The indicato
FREE

The multi-timeframe indicator of the levels of the Pivot Points. Every closed daily period has its own so-called reference point - Pivot Point, which sets the levels for smaller intraday timeframes for the following day. The Pivot Points indicators existing in the codes have no method of showing the dynamics of the pivot point changes on the historical data of the price chart. Pivot Point calculation formula. Pivot=(High + Low + Close) /3 High — the maximum of the previous day; Low — the minimum
FREE

VOLUMEPRESSURE NAVIGATOR MT5 Buying and Selling Pressure Dashboard
TAGLINE
Measure who is in control—buyers or sellers.
PRODUCT OVERVIEW
VolumePressure Navigator MT5 is a multi-timeframe pressure-analysis indicator for MetaTrader 5. It estimates whether buyers or sellers are dominating current market behavior by analyzing the relationship between tick volume and candle direction.
The indicator is designed to simplify market-participation analysis for traders who want more information than
FREE
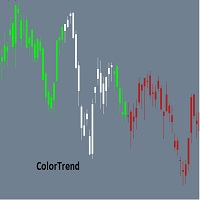
Combining the best of Price Action , Directional Movement , and Divergence / Convergence analysis, the Candle Color Trend is the easy and reliable way to identify the direction of the trend. The indicator automatically paints the candles according to the premise that the upward trend is defined by prices that form a series of ascending tops and bottoms. On the other hand, the downward trend is defined by prices that form a series of descending tops and bottoms.
Color Trend is certainly one of
FREE

FREE
学习如何在MetaTrader AppStore上购买EA交易,MetaTrader平台的应用程序商店。
MQL5.community支付系统支持通过PayPay、银行卡和热门付款系统进行交易。为更好的客户体验我们强烈建议您在购买前测试EA交易。
