 MetaTrader 5
 专家
专家
 指标
指标
 程序库
程序库
 实用工具
实用工具
 窗口小部件
窗口小部件
 规则
规则
适用于MetaTrader 5的免费技术指标 - 44
 技术指标的信号外汇和股票市场的开仓交易和平仓交易起着至关重要的作用。指标的本质就是一种交易品种的数学转换,旨在预测未来的价格变化。
测试技术指标可以更有利于预测市场行为并从中获利。
技术指标的信号外汇和股票市场的开仓交易和平仓交易起着至关重要的作用。指标的本质就是一种交易品种的数学转换,旨在预测未来的价格变化。
测试技术指标可以更有利于预测市场行为并从中获利。 
Reversal Oscillator — Advanced Momentum Shift Detector
Reversal Oscillator is a free indicator designed to highlight price zones that are statistically outside their normal movement patterns, helping traders anticipate potential turning points before they occur. Unlike traditional oscillators that react mainly to overbought/oversold conditions, this indicator applies third derivative analysis (the "acceleration of the acceleration" of price) calculated using two independent methods within a n
FREE

Indicador Multiple Regression Indicador faz o plot da Curva de Retorno e dos canais superior e inferior de uma regressão para os preços de fechamento do ativo do gráfico. A Curva de Retorno é a linha central do indicador e representa a região de equilíbrio do preço entre vendedores e compradores. Nesse indicador o usuário escolhe o tipo da regressão podendo ser de 3 tipos: primeiro grau, segundo grau ou terceiro grau. Os plots do indicador são: Linha central – cor padrão preta; Linha superi
FREE

Description This is an indicator for MT5 which has enhanced the "Fractals" indicator. "Fractals" indicator is included in MT5 by default but the draw line period is fixed at "5" and it cannot be modified. Thus I have reinvented the Fractals indicator with some useful function added. This tool will be useful especially for those who are learning how to draw good horizontal lines and wants to get some reference. Of course, those who are considering Fractals as an important horizontal line wil
FREE

自定义指标将您的移动平均线提升到一个新水平,允许您组合来自最多5个不同符号的MA! 为什么? 这样您的决策基于互补的市场。 示例: 您交易纳斯达克,但想同时关注比特币和罗素2000,以了解市场趋势。 或者交易XRP,但想拥有全局视角。 现在这是可能的! 确保符号与您的经纪商匹配,区分大小写。 US100Cash或XAUEUR#等等...取决于您的经纪商。 这是一个免费工具,我将非常感谢您的评论和评价支持。 在截图中,我们看到EA Bull Scalper在处理仓位。 但您也可以免费获取我的EA,它在图表上创建P&L。 https://www.mql5.com/en/market/product/128104 在这里查看我的交易EA: https://www.mql5.com/en/market/product/116071 ***** 5星表示您喜欢它!
FREE
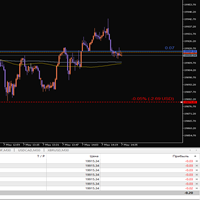
This indicator is designed for visual risk management and monitoring of open positions on the chart. It automatically calculates and displays: The average entry price for all open positions of the current instrument. The total volume of positions. A horizontal Stop Loss line, which can be moved manually. The potential loss if SL is triggered – both as a percentage of the account balance and in the account currency.
FREE

Trend Multi-Timeframe Dashboard tells you whether the market is going up or down on four timeframes at once, using a fast and a slow exponential moving average on each timeframe. Instead of guessing the direction or flipping through charts, you see the whole picture in one panel. By default it reads the M15, H1, H4 and D1 timeframes, and the settings are fully configurable. Each timeframe is shown in green when the trend is up, red when it is down and grey when it is flat, and the percentage gap
FREE

Candle color RSI (Relative Strength Index) indicators change candlestick colors on the price chart to visually show RSI conditions like overbought/oversold levels or bullish/bearish momentum, using colors like red for overbought/bearish and green for oversold/bullish, helping traders spot reversals or strength at a glance without looking at the separate RSI pane. These custom indicators often color candles red above 70 (overbought), green below 30 (oversold), and keep default colors in between
FREE

Critical Market Session Information with a Single Glance Stop juggling multiple tools and squinting at time zone converters. The SessionInfoDisplay Indicator is your new, indispensable trading co-pilot that puts real-time market intelligence directly on your chart. What It Does: Your Essential Trading Dashboard This intelligent indicator provides three critical pieces of information at a glance: 1. Real-Time Session Detection - Automatically identifies which major financial session is act
FREE
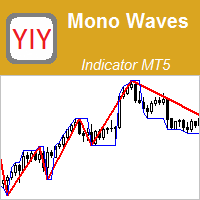
The Mono Waves indicator is designed to display the wave behavior of the market on a chart. Its appearance is presented on slide 1. This indicator uses the PPPC (Point-Percent Price Channel) indicator, which can be downloaded for free from the Market . When the market moves up, the upper border of the price channel is built on High candlestick prices (for more details, see the description of the PPPC indicator at the link given above). The higher the High prices rise
FREE

This indicator is based on Volumes standard indicator, calculates the average of Volumes based on the last N bars set by users, and if the value of the volume is bigger then a set % respect the average a different color will be used. The indicator is shown in a separate indicator window. This version has now a limitation in setting the % about the threshold.
If you are interested to set threshold consider to buy the PRO version ( https://www.mql5.com/en/market/product/35925 ) If you want to use
FREE

The YK-SMART-EMA is an indicator that displays multiple Exponential Moving Average (EMA) lines on a price chart to help analyze price trends. This indicator features five EMA lines: EMA14 (red line): Calculated based on the closing prices of the last 14 candles. EMA30 (blue line): Calculated based on the closing prices of the last 30 candles. EMA50 (green line): Calculated based on the closing prices of the last 50 candles. EMA100 (orange line): Calculated based on the closing prices of the last
FREE

Easy Correlations Indicator The Easy Correlations Indicator is designed to help traders analyze the relationship between two correlated instruments. By monitoring the distance between their Relative Strength Index (RSI) values, the indicator highlights situations where one instrument has moved significantly further than the other. This creates potential trading opportunities: Sell the stronger instrument (overstretched RSI) Buy the weaker instrument (lagging RSI) Because the positions are opened
FREE

该指标的开发是为了帮助您作为交易者确定市场方向,在交易中我们有三种类型的走势,即上升趋势、下降趋势和侧向走势,市场走势的侧向走势是大多数交易者陷入困境的地方,因为价格是合并,这仅仅意味着没有方向,对于剥头皮者来说,只有当他们知道如何识别资产类别何时处于这一时期时,这对他们来说才是有利的。
试图开发锄头来识别趋势是这个指标的全部内容,当价格高于绿点时坚持并在连续 2 个点发生后进行买入交易,或者当价格低于红点时我们专注于卖出头寸.
我在这个指标中所做的是避免当市场处于范围内时,当价格不低于红点时不要卖出当价格不高于绿点时不要买入。
对于我的大部分条目,我等待价格高于点,然后在连续第二根蜡烛上我选择趋势的方向。
FREE

Trading Report 是一款轻量且功能强大的可视化指标,实时显示账户和交易的核心信息 — 全部集中在一个优雅、可完全拖拽的极简面板中。 主要功能 每跳动更新(持仓及浮动盈亏实时显示) 当前持仓详情(BUY/SELL + 手数 + 开仓价 + 浮动盈亏带绿/红颜色) 当日盈亏及余额变化(自动上色:绿=盈利 | 红=亏损 | 白=持平) 完整统计:Balance、Equity、总交易数、胜/负、胜率(%)、盈利因子、最佳/最差交易 可点击的“Report”按钮:点一次显示,再点一次完全隐藏(快速清理屏幕) 完全可拖拽:拖动按钮即可把报告放在图表任意位置 优势 不固定占用屏幕,一键隐藏 无需打开历史即可一览当日和账户表现 完美适合多品种交易者 极适合录屏、直播、教学和日常监控
FREE

Transform your MetaTrader 5 chart into a professional trading cockpit. Apex Dashboard is a high-performance utility designed for serious traders who need complete situational awareness. It moves beyond simple monitoring by providing a comprehensive overview of your account's solvency, performance, and risk exposure in real-time. Unlike standard indicators, Apex Dashboard features a Persistent Data Engine . It records your historical Peak Drawdown to a local file, ensuring your risk metrics r
FREE
The Shadow Chart indicator is the advanced evolution of the Mirror Chart MT5. Rather than overlaying the second instrument directly onto the main chart with dynamic scaling, it renders it in a dedicated sub-window with its own independent price axis. The second symbol behaves exactly like a separately opened chart window — the scale is absolute and undistorted. The sub-window automatically adapts its display mode to match the main chart — candles, bars, or line — and inherits all color settings
FREE
The Channel Sgnals ProfRoboTrading Indicator for MT5 is an effective Forex trading tool designed to track market movements. The MT5 signal point indicator effectively detects trend reversals after they have already occurred. This Indicator is a fully automated technical tool that includes a number of parameters to track market trends. It automatically examines the ever-changing price dynamics of the market, compares the information with earlier data and generates a trading signal. Because
FREE

======================================================== GOLD WAVE MONSTER - MQL5/MT5 MARKET DESCRIPTION (formatting: **bold** = Bold button; lines with • = bullet list; UPPERCASE = heading) ========================================================
OVERVIEW ------------------------------------------------------- **Gold Wave Monster** shows the current chart's **Wave-3 start lines** and live **wave count**. When an H1/M15 Wave-3 line is broken upward it flags a BUY; broken downward, a SELL - vis
FREE

1. Introduction The Market Squeeze Momentum Indicator (SQZMOM_LB) is a powerful technical analysis tool designed to help traders identify periods of low market volatility (the "squeeze" phase) and predict the direction and strength of price momentum after the squeeze ends. This indicator combines the principles of Bollinger Bands and Keltner Channels to detect changes in market volatility, along with a momentum oscillator to measure buying/selling pressure. 2. Key Components of the Indicator The
FREE
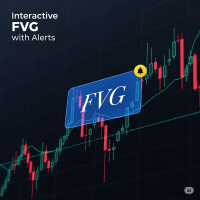
FVG Indicator with Alerts Description: This is a simple and effective indicator for identifying and displaying Fair Value Gaps (FVGs) on any timeframe. The indicator helps you see important price imbalances and provides powerful interactive tools for your analysis. Key Features: Detects FVGs: Clearly identifies and draws boxes around Bullish and Bearish Fair Value Gaps. Midline Level: Displays the 50% equilibrium level inside each FVG box, a critical point of interest. Complete Alert System: Rec
FREE

The indicator highlights the points that a professional trader sees in ordinary indicators. VisualVol visually displays different volatility indicators on a single scale and a common align. Highlights the excess of volume indicators in color. At the same time, Tick and Real Volume, Actual range, ATR, candle size and return (open-close difference) can be displayed. Thanks to VisualVol, you will see the market periods and the right time for different trading operations. This version is intended f
FREE
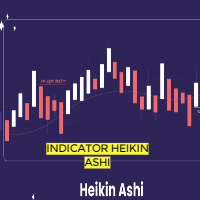
In this indicator, Heiken Ashi candles are calculated with the most optimal method. You can also customize the results by adjusting the amount of period and method input. But the most important advantage of this indicator is the adjustment of the time frame value. You can use this to calculate the Heiken Ashi chandels to See in time frames with lottery in the lower time chart. In this case, you get the best signal to buy or sell using two or more Heiken Ashi indicators with different timeframes
FREE

The indicator draws levels based on the overbought and oversold values of the RSI indicator.
The maximum values are taken into account, which are equal to or exceeded certain limits. That is, for example, when the price has gone into the overbought zone, the highest price is selected from all prices in this zone for this period of time, and as soon as the indicator value returns to a value below the overbought value, the level is fixed and the calculation of new values begins.
The same
FREE

Powerful Price Discovery
Features
1. Displays Key Price Levels and Probability.
2. Key Price Levels: Calculated as (Buy + Sell) × (Limit + Stop) = 4 Lines, shown when Probability > 55%.
3. Time Frame Dependency: Each Time-frame has different OHLC prices, affecting Probability calculations.
4. Breakout Condition: If the price breaks the historical Highest or Lowest, Probability may reach 99%.
5. Parameter: PatrolPoints = 8 : The indicator recalculates only when the price moves over PatrolPoint
FREE

If you love this indicator, please leave a positive rating and comment, it will be a source of motivation to help me create more products <3 How to use Slope Direction Line Uptrend: When the SDL line slopes up and turns from red to green, it shows that the price is trending up. This is also considered a buy signal. Downtrend: When the SDL line slopes down and turns from green to red, it shows that the price is trending down. This is also considered a sell signal. Sideways: When the SDL line mo
FREE

“这是广受欢迎的 Apex Trend Genesis 4 指标的官方版本,已针对 MetaTrader 5 平台进行了全面优化。” Apex Trend Genesis 4 MT5 是一款基于深度改良的 SuperTrend(超级趋势)算法开发的专业趋势跟踪指标。与标准版本的主要区别在于其集成了独特的 Smart Gap Filter(智能跳空过滤器) 模块。该模块能有效保护交易者,防止在开盘跳空或高波动性新闻事件导致的价格突变时出现错误信号。 该指标完全适应现代市场环境,综合运用了多种噪声过滤技术和动态波动率评估方法。 核心优势:保证 100% 不重绘 (Non-Repainting) 该算法完全杜绝了信号重绘现象。信号(箭头)在当前 K 线(Bar)闭合的确切时刻固定。一旦下一根 K 线打开,信号将永久保留在图表上,绝不会改变位置或消失。这确保了手动交易和回溯测试中信号的绝对真实性和可靠性。 算法基础:Apex Trend Genesis 4 基于什么原理? 该指标采用了技术分析方法的平衡组合: 改良的 ATR 计算(SuperTrend 核心): 基础趋势检测逻辑建立在动态波动
FREE

Investment Castle 波动指数 — 读懂市场能量
Investment Castle 波动指数用一个清晰的读数显示当前品种的成交量和市场波动性。它与 Investment Castle EA 用来设定动态距离和把握反向入场时机的波动引擎完全相同。
它能为您做什么 成交量与波动性一目了然: 看清当前市场的活跃度和波动程度。 驱动动态距离: 与 Investment Castle EA 用于自适应间距和反向入场的指数相同。 可按品种优化: 参数可针对每个品种进行调整和优化。 适用任何图表: 任何品种、任何周期。
适合人群: 根据真实市场波动来确定仓位与间距的交易者。
风险提示: 交易存在重大亏损风险。请务必先在模拟账户上测试,并使用您能接受的风险设置。过往表现不代表未来结果。
FREE
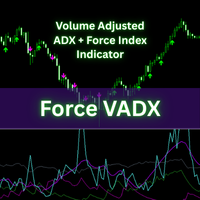
Force VADX Indicator Force VADX is an advanced, multi-factor indicator that fuses volume-adjusted trend strength, normalized force index, and adaptive directional signals. Designed for modern traders, it pinpoints high-confidence buy and sell zones, offering a robust technical foundation for both discretionary and automated trading.
Use this indicator in conjuntion with other tools for confirmation and confluene. This indicator is not intended to be a complete trading system but rather a tool
FREE

Investment Castle News — Stay Ahead of the Headlines
The Investment Castle News Indicator plots upcoming economic news events directly on your chart, so high-impact releases never catch you off guard. Know what's coming, and trade around it with confidence.
What it does for you News on your chart: upcoming events marked right where you trade — no separate calendar tab. Avoid nasty surprises: see high-impact releases before they hit the market. Plan around volatility: time your entries and exit
FREE

Unlock Market Insights: Dynamic Trend Analysis with Statistical Precision for MT5 Are you seeking a deeper understanding of market movements? Many traditional tools may not fully capture the complex, non-linear dynamics often seen in financial markets. This can sometimes lead to uncertainty in identifying subtle trend shifts. Introducing Adaptive PolyBands Optimizer – an advanced MQL5 indicator designed to enhance your market analysis. Unlike some conventional tools, Adaptive PolyBands Optimizer
FREE

Neural Levels Indicator – Precise AI-Based Market Levels Unlock next-level trading precision with the Neural Levels Indicator, a powerful market analysis tool built on advanced price-action principles and inspired by cutting-edge neural networks. Instantly identify three key neural trading levels directly on your chart:
Neural Level 1 Purpose: Crucial equilibrium level, ideal for identifying market balance points and potential turning zones.
Neural Level 2 (Optimal Entry) Purpose: Indicates p
FREE

Indicator Description
This simple yet highly practical indicator draws clearly visible price levels above and below the current market price. It is optimized for use on the M1 timeframe, making it especially suitable for traders who depend on fast and precise market feedback. Although it is designed with M1 in mind, the indicator can be used on other timeframes as well. The indicator follows a minimalist design philosophy, focusing purely on functionality without unnecessary features or visual d
FREE

Looks for strong price movements and draws levels upon their completion.
You determine the strength of the movement yourself by specifying in the settings the number of points and the number of candles of the same color in a row in one direction.
There are 2 types of building in the settings: extrenum - high / low close - close price You can also adjust the number of displayed levels and the number of candles for calculations.
By default, the settings indicate 5 levels for 360 candles.
That
FREE
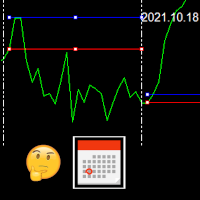
This indicator draws the high intraday price and the low intraday price of the first n minutes of the day. The chart shows the days with vertical lines and two horizontal lines to indicate the max and the min close price of the n first minutes of the day. The max/min lines start and end with the day calculated. With this indicator you can see how starts the day compared with the previous days. It is valid for any market inasmuch as the start time is calculated with the data received.
Parameter
FREE

Az Filter Trend Signal is a high-precision trading tool that combines statistical analysis with advanced trend filtering. By utilizing the Z-Score algorithm, this indicator normalizes price action to identify how far the current price is from its statistical mean, effectively filtering out market noise. The core of the indicator is a smoothed Signal Line (EMA) derived from the Z-Score. This line features a dynamic color-coding system based on its slope and a customizable sensitivity threshold, a
FREE

The Box Range Indicator for MT5 helps traders visualize key price zones by automatically detecting and highlighting market structures. It dynamically draws upper, lower, and middle levels based on price action, making it an effective tool for identifying support and resistance zones, breakouts, and trend reversals .
Key Features: • Automatic Box Detection – Identifies price ranges based on market movements. • Dynamic High and Low Updates – Adjusts in real time to reflect market conditions.
FREE

Investment Castle Engulfing — Never Miss an Engulfing Candle
Whether you scalp or trade the daily, bullish and bearish engulfing candles are some of the most reliable signals — but spotting them across timeframes is tedious and easy to miss. This indicator finds them for you, including an engulfing candle forming on a higher timeframe while you trade a lower one.
What it does for you Automatic engulfing detection: bullish and bearish engulfing candles are flagged for you. Multi-timeframe aware
FREE

一笔套息交易可以安静地攒三个月的隔夜利息,然后在一周之内被价格波动吃光。
关键不在于隔夜利息有多少,而在于它相对这个品种的波动够不够大。终端里那一列原始数字回答不了这个问题:它们的计价单位不同,合约大小不同,而品种之间的波动幅度更是差着数量级。这些数字之间本来就无法直接比较。
Swap Scanner 把每个品种折算成以存款货币表示的同一个数字,按一手的名义价值年化成百分比,再放到该品种自身的年化波动率旁边。两者相除就是 EFF 一列——你为每一分利息承担了多少价格波动。面板不开仓、不修改、不平仓,也不产生交易信号。
swap 数值会因品种不同而以不同单位公布:点数、基础货币、保证金货币、存款货币、年化利率百分比,或持仓重开时附加的点数。Swap Scanner 读取终端为每个品种报告的计息模式,将各种模式统一归结为以账户货币表示的单一数值,使不同行的数值可以直接相互对照。换算基于 tick 价值与合约大小推导,因此对带有经纪商前缀或后缀的品种同样适用。
面板列说明
- SYMBOL:经纪商提供的品种名称。 - SWAP L 与 SWAP S:多头与空头持仓的每日 swap
FREE

Estadistica.mq5:您的交易與分析主控面板 透過 Estadistica.mq5 優化您的交易管理——這是專為追求清晰與精準的交易者打造的終極控制面板。此獨立指標讓您能在緊湊且高效的操作介面中,即時監控未平倉部位及已平倉交易的詳細歷史紀錄。
主要功能: 全面的多標記面板:一目瞭然地查看未平倉部位摘要,包含每組貨幣對或資產的手數及即時交易結果。
進階已平倉交易分析:獲取專業的績效指標(整體摘要與按標記細分),包含總交易筆數、勝率(WR)、美元盈利及盈利係數(PF)。
魔術號篩選:專為全面相容性設計。透過應用魔術號篩選統計數據,讓您能獨立分析任何專家顧問(EA)的表現,包括馬丁格爾等複雜策略。
互動式簡潔介面:面板具備「點擊隱藏」功能,保持圖表整潔,並讓您僅在需要時顯示資訊。
回撤追蹤:透過精確的「最大回撤」與「當前回撤」指標監控風險,持續監測帳戶健康狀況。
為何選擇 Estadistica.mq5? 無論您是手動交易者還是運行多個 EA,Estadistica.mq5 都能消除混淆,並提供您做出明智決策所需的精確數據。無需再進行手動計算;立即獲取
透過 Dee
FREE
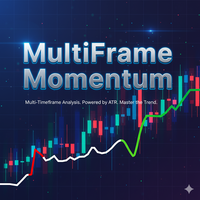
MultiFrame Momentum 指标 (多周期动量指标) MultiFrame Momentum 是一种高级指标,可 同时分析多个市场周期 ,以识别 方向趋同 的时刻。其独特的设计旨在寻找不同时间周期之间的动量一致性,通过一条在 绿色(看涨) 、 红色(看跌) 和 灰色(中性) 之间切换的线条,生成清晰的视觉信号。 关键设置与测试 该指标的有效性完全取决于 个性化的时间周期配置 。每位交易者都应该测试并评估哪种时间周期组合最符合他们的策略: 剥头皮 (Scalping): 启用 M1 到 M15 日内交易 (Day Trading): 结合 M30 与 H1-H4 波段交易 (Swing Trading): 侧重 H4 到 W1 通过激活/停用不同的组合进行实验,直到找到最适合您交易风格的 最佳设置 。 实际信号管理 入场 (ENTRIES): 操作前务必等待蜡烛图完全收盘。 指标可能在蜡烛形成过程中显示颜色变化,但只有在收盘时才能确认有效信号。 出场 (EXITS): 当线条返回到 灰色(中性) 状态或切换到 相反颜色 时,平仓,这表示多周期趋同已结束。 与现有策略的整合
FREE
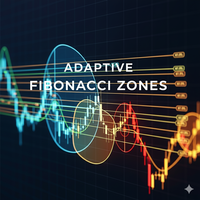
Adaptive Fibonacci Zones 是 MetaTrader 5 经典斐波那契回撤工具的增强动态版本。它与原生斐波那契工具的主要区别在于, 你无需手动绘制水平线 ,也无需主观决定从哪个点到哪个点测量回撤。 该指标为你完成了这项工作:它使用分形和基于 ATR 的波动率过滤器, 自动检测市场中相关的摆动点(高点和低点) 。这样,斐波那契工具就能实时适应市场,显示出更真实、更有用的水平线,以识别潜在的 支撑和阻力区域 。 相较于 MT5 原生斐波那契工具的优势 自动与自适应: 原生斐波那契工具需要你手动绘制水平线。而该指标能自动找到最相关的摆动点。 更加真实: 它使用 ATR(波动率)来过滤虚假摆动点,避免在不相关的微小波动中出现水平线。 动态颜色: 颜色方案会根据趋势方向(看涨或看跌)而变化。 看涨(Bullish) → 冷色调:蓝色、绿色、紫色。 看跌(Bearish) → 暖色调:红色、橙色、金色。 价格标签: 每个水平线不仅显示斐波那契百分比,还显示实时的精确价格。 重要提示:滞后与重绘(Repaint) 与任何基于分形和历史数据的指标一样,该指标会 重绘(repain
FREE
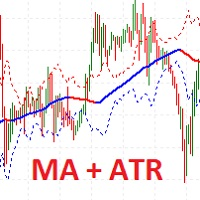
I present the well-known Moving Average indicator connected to the ATR indicator.
This indicator is presented as a channel, where the upper and lower lines are equidistant from the main line by the value of the ATR indicator.
The indicator is easy to use. The basic settings of the moving average have been saved, plus the settings for the ATR have been added.
Moving Average Parameters:
MA period Shift MA Method
Moving Average Parameters:
ATR TF - from which timeframe the values are taken A
FREE

Universal Asset Meter (MT5) Universal Asset Meter is a next-generation, high-performance matrix engine designed to decode real-time currency and asset strength directly on your Metatrader 5 platform. Unlike traditional currency meters that are restricted to fixed major pairs, this commercial-grade tool provides a fully customizable, cross-asset analytics dashboard built for professional traders. Engineered with asynchronous processing and advanced data encapsulation, it scans the entire market
FREE

White Crow Indicator
by VArmadA A simple yet powerful candle analysis based indicator using the White Soldiers & Crow patterns.
Works with timeframes 1H and higher and tested on all major pairs. Pay attention to the signal: An arrow indicating a long or short entry.
How It Works:
Arrows indicate a ongoing trend. After multiple bullish or bearish candles in a row the chances for another candle towards that trend is higher.
Instructions: - Crow Count: Set the number of candles that need to su
FREE

This is addition of Effective SV squeeze momentum that add bolliger band and Keltner channel to chart window. Squeeze momentum introduced by “John Carter”, the squeeze indicator for MT5 represents a volatility-based tool. Regardless, we can also consider the squeeze indicator as a momentum indicator, as many traders use it to identify the direction and strength of price moves. In fact, the Tradingview squeeze indicator shows when a financial instrument is willing to change from a trending ma
FREE

During volatile market conditions brokers tend to increase spread. int OnCalculate ( const int rates_total, const int prev_calculated, const datetime &time[], const double &open[], const double &high[], const double &low[], const double &close[], const long &tick_volume[], const long &volume[], const int &spread[]) { int spread_array[];
FREE

Classic ZigZag formula. But no lags and repaints. You can see on screenshots that it shows values between peaks and it is useful to test strategies based on indicator. Because sometimes people find a good idea about it but don't understand that repainting indicators have some things to keep in mind. The parameters are the same as original ZigZag indicator: Depth, Deviation and Backstep. Useful for visual analyze of the chart and cut strategies based on repainting peaks.
FREE

主要城市的时间。北京时间、东京时间、悉尼时间、惠灵顿时间、纽约时间、法兰克福时间、伦敦时间、迪拜时间。 城市时间可选择开启或者关闭。 点差变色提醒。设置点差提醒点数,例如,设置100点,点差大于100点,文字会变红色。 Time in major cities. Beijing time, Tokyo time, Sydney time, Wellington time, New York time, Frankfurt time, London time, Dubai time. City time can be turned on or off. Dot difference color change reminder. Set the point difference reminder points. For example, set 100 points. If the point difference is greater than 100 points, the text will turn red.
FREE

The best and the only World Time Display for MT5
Features :
- JAPAN, LONDON & NEW YORK Time Display
- You can customize with different Font, Color And Text Size
- You can customize Box Position and Box Color to meet your satisfaction
- Only For Metatrader 5
- Customize GMT according to your Time Zone
- Simple To Use. Just Attach to your MT5
- No hidden code or no errors
FREE

ATR Short Box Anchor MT5 ATR Short Box Anchor MT5 is a visual risk-reward indicator for MetaTrader 5, specifically designed for planning short setups. The indicator creates an ATR-based short box directly on the chart, including entry, stop-loss zone, take-profit zone, and optional risk-reward information. The indicator works with a freely movable anchor point. This anchor defines the desired entry price and the candle whose ATR value is used for the calculation. This allows a short setup to be
FREE

Value Chart indicator presents the Price evolution in a new form. This indicator, Price Momentum , was developed taking all the calculations presented in the book " Dynamic Trading Indicators " by Mark W. Helweg and David Stendahl (2002). The technique involves de-trended Prices from a user-defined Period of analysis and the addition of a Volatility index correction. The result is an Oscillator with 3 zones: Fair Price Value, Overbought/Oversold and Extremely Overbought/Oversold zones. Adding th
FREE
The DR IDR Range Indicator plots ADR, ODR and RDR ranges for a given amount of days in the past. A key feature that appears is that it calculates the success rate of the ranges for the shown days. This indicator is perfect for backtest since it shows ranges for all of the calculated days, not just the most recent sessions. PRO VERSION
https://www.mql5.com/en/market/product/93360 Remember: this free version counts neutral days as true days , so stats might be slightly inflated. To get perfect a
FREE
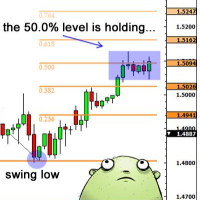
交易实用必备工具指标 波浪自动计算指标,通道趋势交易 完美的趋势-波浪自动计算通道计算 , MT4版本 完美的趋势-波浪自动计算通道计算 , MT5版本 本地跟单复制交易 Easy And Fast Copy , MT4版本 Easy And Fast Copy , MT5版本 本地跟单复制交易 模拟试用 Easy And Fast Copy , MT4 模拟账号运行 Easy And Fast Copy , MT5 模拟账号运行 Fibo: 来源于KTrade 1.自动计算分析波段.->得出所需波段 2.画出斐波那契 回撤线,以及扩展线作为参考 指标波段分析如何得来->请参考如下 波段分析来源于波浪分析指标↓↓↓ 波浪自动计算指标,通道趋势交易 完美的趋势-波浪自动计算通道计算 , MT4版本 完美的趋势-波浪自动计算通道计算 , MT5版本
FREE

MTF MA Dashboard Pro v1.04 - 中文 MTF MA Dashboard Pro v1.04 - 专业多时间框架移动平均线分析器 面向MT5的高级技术指标,提供全面的多时间框架移动平均线分析,具有智能金叉/死叉检测功能和完全可定制的可视化仪表板。 停止在时间框架之间切换!同时分析多达4个时间框架,即时发现趋势一致性。 核心功能 多时间框架分析 同时监控多达4个时间框架(M1-MN1 + 自定义周期) 每个时间框架可独立配置 所有时间框架实时同步 适用于任何交易品种(外汇、黄金、指数、加密货币) 双均线系统 每个时间框架两条移动平均线(快线和慢线) 周期:1-500(完全可自定义) 方法:SMA、EMA、SMMA、LWMA 应用价格:收盘价、开盘价、最高价、最低价、中间价、典型价、加权价 金叉/死叉检测 自动识别看涨金叉(快线上穿慢线) 自动识别看跌死叉(快线下穿慢线) 仪表板上清晰的可视信号 无重绘 - 信号确认后保持固定 实时趋势分析 即时趋势分类:看涨/看跌/混合 基于价格相对于移动平均线的位置 市场摘要显示所有时间框架的整体
FREE

Trend Filter Line is a trend-following tool designed to help traders identify the market's core direction with surgical precision. Based on the popular Two-Pole Filter logic, this indicator eliminates market "noise" and provides a clear, color-coded visualization of the prevailing trend.
Whether you are a scalper, day trader, or swing trader, the Trend Filter Line Pro acts as your primary decision-making filter—ensuring you never trade against the momentum.
How It Works The indicator uses a s
FREE

Exponential Moving Average (EMA) Indicator The Exponential Moving Average (EMA) is one of the most widely used indicators in technical analysis.
It smooths out price fluctuations to help traders identify market trends more clearly — without being too slow to react to price changes. Unlike the Simple Moving Average (SMA), the EMA gives greater weight to recent prices , making it more responsive to new market information. This makes it ideal for traders who want to detect trend reversals earlier o
FREE

The Keltner Channel Pro is a modern and enhanced version of the classic Keltner Channel , designed for traders who want to identify trends, reversals, and overbought/oversold zones with greater accuracy. Built with EMA (Exponential Moving Average) and ATR (Average True Range) , this indicator automatically adapts to market volatility, providing dynamic channels that help filter noise and improve trade timing. Key Features: Main channel (upper, middle, and lower) based on EMA + ATR. Optional ad
FREE

MT5 Visual Theme Indicator – Clean Chart and Full Customization Enhance the appearance of your charts in MetaTrader 5 with this fully customizable visual indicator, designed to provide a clean, modern, and easy-to-read trading environment. This indicator does not generate signals or open trades. Its sole function is to optimize chart visualization to help you analyze the market with greater clarity. If you find this useful, please leave a 5-star rating and follow me for future tools, indicators,
FREE

The VIX Index, or CBOE Volatility Index, is an indicator designed for MetaTrader 5 that transforms historical volatility into an easy-to-interpret oscillator, placing the volatility range between 0 (minimum) and 100 (maximum) based on a configurable normalization period.
Unlike a simple ATR, this oscillator shows you on the chart when volatility is abnormally low or high compared to its recent behavior. Additionally, the indicator provides context and information about the famous VIX Volatility
FREE

BinaWin NoTouch is an indicator that sends an alert signal when the trade is in the right position to wait for the breakdown of a side market.
It is specially designed to trade under the “No Touch” strategy of the Binary.Com platform with synthetic indexes N.10, N.25, N.50, N.75 and N.100
Similarly, trading can be done with the conventional CALL and PUT strategy of any Binary Options platform.
Requirements to use the indicator:
1. Have an account at Binary.Com
2. Configure the Binary.Com d
FREE

This indicator is a **Pivot-Confluence Zone Identifier** that focuses exclusively on identifying key support and resistance levels where price clusters align with classic pivot points. Here's what it does:
## Core Functionality
**Pivot Confluence Detection**: - Only displays price zones that align with classic pivot point levels (R1, R2, R3, S1, S2, S3) - **Excludes the main pivot point** - focuses only on support and resistance levels - Uses a configurable pip range to detect confluence nea
FREE

Consecutive candles can give us an indication as to the strength of a trend. With this indicator, you can set the number of consecutive bull or bear candles you wish to be present before achieving a valid signal of RSI crossing into overbought or oversold. With this information, you can better judge if a continuation or reversal situation is about to present. RSI has two settable levels
Interesting settings: Number of consecutive candles needed before a valid signal Overbought level of RSI Over
FREE

Indicador Regressão Linear – Par de Ativos - INTRADAY Indicador é um oscilador que faz o plot do Resíduo resultado da regressão linear entre os dois ativos inseridos como input do indicador, representado pela fórmula: Y = aX + b + R Onde Y é o valor do ativo dependente, X é o valor do ativo independente, a é a inclinação da reta entre os dois ativos, b é a intersecção da reta e R é o resíduo. O resíduo representa a quantidade da variabilidade que Y que o modelo ajustado não consegue explicar. E
FREE

This project did not reach the basic funding number, so I am abandoning it momentarily. The system is now free for other traders to continue the idea. You can follow my new project through my signals.
A tool for institutional investor, now avaliable for Home users. We equip you like banks equip their analysts!
How it works
Focused on the Forex market, it takes advantage of the need of nations to control the value of their currency and the world exchange variations to analyze, through the pro
FREE
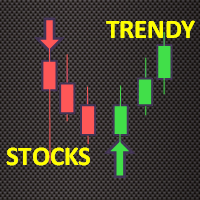
Trendy Stock is a price following indicator that uses Stochastic to show when the price is out of the oversold or overbought areas. The algorithm allows you to stay longer in a trend where the bulls or bears are in control. The indicator changes color immediately the price exits oversold/overbought state. In short, the downtrend [red] bars start to paint when the buying pressure decreases while the uptrend [green] bars form as the buy pressure kicks in. For MT4 version, follow :: https://www
FREE

The indicator displays the chart of an arbitrary combination of trading instruments, described by the entered arithmetic formula. Using the indicator. Add an indicator to any chart. Enter the formula as a string in the indicator's parameters. All symbols used in the formula must exactly match the names in the table "Market Overview" of the terminal. Example of the formula: (SIBN + SNGS) / 'RTS-3.19' + 2.5 * GAZP / LKOH Start the indicator The formula must meet the following requirements: The nam
FREE
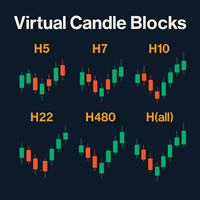
虚拟K线块(Virtual Candle Blocks)—— 视觉化无界市场 虚拟K线块 是一款为 MetaTrader 5 设计的高级指标,它能让你创建并观察任何自定义周期的 K 线,即使是那些平台本身不提供的周期。 主要特点: 自定义周期 :将基础 K 线组合成任意时长的 K 线块(例如:5 小时、14 小时、28 小时、72 小时等),从而创建全新的虚拟 K 线。这使你能够使用像 TradingView 等高级平台独有的周期。 清晰的视觉效果 :直接在图表上绘制带有实体和影线的虚拟 K 线。你可以自定义颜色、实体宽度,并选择是否显示影线,以便进行纯粹的价格行为分析。 高度可定制 :该指标包含一个简约面板,用于显示你选择的虚拟周期。它与 MT5 的所有绘图工具兼容,允许你在虚拟 K 线上标记支撑位、阻力位和趋势线。 高级分析 :将图表周期用作“缩放”功能,以检查每根虚拟 K 线的内部结构,从而提高你发现模式和趋势变化的能力。 理想用户: 价格行为交易者 :喜欢干净、无干扰图表的人。 技术分析师 :使用非标准周期来获得视觉和概念优势的人。 使用建议: 为了获得无重叠的视觉效果,我们建
FREE

Free for now, price is going to be 30 USD at Jan 1. 2025.
Features: Pin Bar Detection : The indicator is designed to identify bullish and bearish pin bars based on specific criteria, including the relative size of the candle’s body and shadow, as well as the position of the candle's body in relation to the 38.2% Fibonacci level. Customizable Labels : Custom text is displayed above each identified bullish or bearish pin bar, such as "[38.2]" for bullish and "[-38.2]" for bearish, helping traders
FREE

Матрица AurumEdge — это коммерческий алгоритм идентификации тренда с использованием нескольких таймфреймов (MTF), специально разработанный для фильтрации стохастического рыночного шума и агрессивного снижения просадки от «whipsaw» в условиях боковых макро-рынков. Изначально созданная как основной математический сигнальный движок для частной автоматизированной алгоритмической торговой системы, теперь мы выпускаем чистую визуальную Матрицу для ручных трейдеров, которым требуется детерминированная
FREE

具有多时间框架支持、可自定义视觉信号和可配置警报系统的优雅振荡器(EO)指标。
自由编程服务、更新和其他 TrueTL 产品可在我的 MQL5 个人主页 获取。
非常欢迎您的反馈和评价!
什么是 EO? 优雅振荡器(EO)是一种归一化动量指标,将 Fisher 变换(反双曲正切)与 Butterworth 低通滤波器相结合。它通过将当前价格导数与可配置振荡器周期内的均方根(RMS)进行比较来衡量近期价格变动的相对强度,然后使用由带边缘参数控制的二阶 Butterworth 滤波器对结果进行平滑处理。 EO 值在 -1 和 +1 之间振荡。正值表示上升动量,负值表示下降动量。由于输出针对近期波动性进行了归一化处理,该指标在不同交易品种和时间框架上表现一致。交易者使用 EO 来识别方向变化、动量枯竭和零线穿越,作为潜在的进场或出场信号。 功能特点: 带箭头和垂直线的视觉信号标记 三个独立信号缓冲区,具有可配置触发器 信号检测选项:方向变化、水平穿越、峰值/谷值 每个信号的可配置警报功能(电子邮件、推送、声音、弹窗) 具有插值方法的多时间框架(MTF)功能 柱状图或线形绘制模式 多种颜
FREE
MetaTrader市场是您可以下载免费模拟自动交易,用历史数据进行测试和优化的唯一商店。
阅读应用程序的概述和其他客户的评论,直接下载程序到您的程序端并且在购买之前测试一个自动交易。只有在MetaTrader市场可以完全免费测试应用程序。
