 MetaTrader 5
 专家
专家
 指标
指标
 程序库
程序库
 实用工具
实用工具
 窗口小部件
窗口小部件
 规则
规则
适用于MetaTrader 5的免费技术指标 - 12
 技术指标的信号外汇和股票市场的开仓交易和平仓交易起着至关重要的作用。指标的本质就是一种交易品种的数学转换,旨在预测未来的价格变化。
测试技术指标可以更有利于预测市场行为并从中获利。
技术指标的信号外汇和股票市场的开仓交易和平仓交易起着至关重要的作用。指标的本质就是一种交易品种的数学转换,旨在预测未来的价格变化。
测试技术指标可以更有利于预测市场行为并从中获利。 
趋势反转概率 Trend Reversal Probability 产品简介 趋势反转概率是一款用于 MetaTrader 5 的分析型指标。它不会开仓、平仓或管理订单,只做一件事:用数字描述当前动量状态的持续时间,并将这一持续时间与历史上同类状态的持续时间进行比较。 指标运行在独立子窗口中。每根 K 线都会更新当前状态的持续时间、所有已完成状态持续时间的平均值与标准差,以及当前持续时间所对应的经验分位数值。 指标的测量内容 计算基于每根 K 线的中位价,即最高价与最低价的平均值。 对中位价分别计算 5 周期与 34 周期简单移动平均线,两者之差构成动量振荡值。 取该振荡值的逐根变化量,并拆分为上升部分与下降部分,两部分分别用维尔德式平滑(周期由输入参数决定)处理。 将平滑后的结果转换为一个中心化数值,大致在 -50 到 +50 之间波动,其零轴即为参考基准。 中心化数值向上或向下穿越零轴时,视为一个新状态开始。指标统计自上次穿越以来经过的 K 线数量,称为信号持续时间。 每当一个状态结束,其最终持续时间会被计入统计量。指标根据所有已完成持续时间计算平均值与标准差,并绘制为平均持续时间
FREE

Overview Reversal Probability Profile is a price-action analysis indicator that identifies historical swing points, groups them into price clusters, and displays a profile of potential reversal zones directly on the MetaTrader 5 chart. The indicator combines pivot detection, K-Means clustering, and a profile-based visualisation to help traders assess areas where historical price reactions have occurred. It also provides configurable reversal signals, ATR-based risk references, and a visual repr
FREE

产品简介 Pyramiding Entry Master 是一款专为 MT4 和 MT5 双平台设计的主图均线趋势跟踪与金字塔式加仓入场指标。它在主图上绘制四周期均线系统(MA5、MA10、MA20、MA60),并基于 55 周期趋势动量模型、成交量放大确认和多重超跌条件,自动生成三类买入信号:半路追涨(Chase)、加仓(Add)和抄底(Dip Buy),覆盖趋势加速追入、次日低吸加仓和深度超跌抄底三种典型入场场景。信号逻辑严谨、视觉层次分明,并配备独立冷却过滤与多通道提醒机制,是构建金字塔加仓交易系统的理想主图工具。 核心功能 四周期均线系统与右侧标签 系统在主线图上绘制四条均线: MA5 白色线 反映超短期价格重心, MA10 黄色线 反映短期趋势方向, MA20 品红色粗线 作为中短期趋势分水岭, MA60 绿色粗线 作为中长期趋势基准。四条均线右侧均附带同色文字标签,便于快速识别各均线位置。均线多头排列(MA5 > MA10 > MA20 > MA60)时代表趋势健康向上,是 Chase 和 Add 信号发挥最佳效力的背景条件。 MT5 版本额外支持信号 K 线染色
FREE

SAR Manager SAR Manager 是一款基于标准 Parabolic SAR 算法开发的 MetaTrader 5 信号指标。该指标可以识别 SAR 方向变化,生成虚拟 BUY 和 SELL 信号,计算止损和止盈水平,并将所有相关信息直接显示在图表上。 本产品用于市场分析和辅助人工交易。它不会开启、修改或关闭任何真实交易订单。 信号计算 当 Parabolic SAR 点从价格上方移动到价格下方时,BUY 信号得到确认。当 SAR 点从价格下方移动到价格上方时,SELL 信号得到确认。 新信号仅在当前K线收盘后计算。正在形成的K线不会用于确认入场信号。虚拟入场价格取 SAR 方向变化确认后的下一根K线开盘价。 指标同时只跟踪一个虚拟持仓。当虚拟持仓处于激活状态时,不会生成新的入场信号。当价格触及止损或止盈、出现反向 Parabolic SAR 信号,或者价格跳空越过指定水平时,虚拟持仓将被关闭。 止损和止盈 止损和止盈距离以 MetaTrader 点数为单位设置。对于 BUY 信号,止损位于虚拟入场价格下方,止盈位于虚拟入场价格上方。对于 SELL 信号,则采用相反的设置
FREE

Supertrend Master — Multi-Timeframe Supertrend Indicator
A clean, visual Supertrend indicator for MetaTrader 5 with a multi-timeframe dashboard.
The chart displays a clear Supertrend line with colored candles and directional arrows on trend changes — designed to be readable at a glance.
A compact HUD shows the current Bull / Bear direction across 7 timeframes simultaneously:
M5 | M15 | M30 | H1 | H4 | D1 | W1
No need to switch charts. See the full market picture in one view. The HUD c
FREE

Barbaduque Lot Calculator — MetaTrader 5 交易手数计算器 根据您设定的风险金额和止损距离,直接在图表上计算交易手数。 计算器自动识别当前图表的交易品种,并使用经纪商提供的最小价格变动单位及其价值来估算手数。 主要功能 可按账户余额或净值的百分比计算风险,也可输入以账户货币计价的固定金额。 默认风险为账户余额的 0.50%。 可直接在面板中编辑风险和止损距离。 止损距离以 MetaTrader 的 point 为单位,而非 pip。 醒目显示计算手数和预计风险金额。 根据经纪商的交易量限制和手数步长向下取整。 最小交易手数超过设定风险时显示提示。 黑金配色面板固定于图表左下角,可最小化和展开,并保留已输入的数值。 使用方法 将指标添加到图表,在设置中选择风险模式,输入风险和止损距离,然后按 Enter。 说明 界面为葡萄牙语。支持合约规格符合本指标要求的外汇和 CFD 品种。计算依赖经纪商提供的数据。本工具不会下单,也不会检查可用保证金或总风险敞口。风险金额为估算值,不包含佣金、隔夜利息或滑点。
FREE

一条在决定守哪一侧之前先问资金流向何处的跟踪止损线。Alpha Trend MTF用ATR搭起跟踪线,把方向交给资金流来判断,然后从这条线与它自己两根K线之前的副本相交处取得信号。正是这一构造,让它在能把普通跟踪止损甩出去的锯齿行情里依然安静。上位时间周期的信号可以画在任何图表上,而读取的只有已收盘的上位K线。它是免费的:没有试用期,没有锁定功能,没有升级页面。 以ATR为距离,从最低价和最高价各搭出一个跟踪水平。由资金流决定守住哪一个:只要资金流指数在五十或以上,市场就被视为被买入,守住下方水平;低于五十则守住上方水平。没有成交量时,同样的判断由收盘价的RSI做出,这是原作自带的开关,此处默认关闭。 接着,这条线与它自己两根K线之前的副本相比较。产生阴影和箭头的正是这一比较,而不是与价格的比较,这与原作完全一致。在MetaTrader 5上,资金流背后的成交量是逐笔成交量,本平台上所有基于成交量的研究都建立在它之上。 图表上有什么 在价格窗口里绘制:按所守一侧上色、跨越转折而不断开的跟踪线;延迟两根K线的副本,画成细线;两者之间的两处阴影;以及该线与延迟副本相交那根K线上的BUY和S
FREE

Pivot Points Classic and Camarilla 直接在图表上绘制经典枢轴点位(P、R1-R3、S1-S3)和 Camarilla 位(H1-H4、L1-L4)。这些价位根据所选时间周期(默认 D1)上一个周期的最高价、最低价和收盘价计算,每个周期都会在其适用的时间段上绘制一条水平线,因此您可以看到价格在之前的几天、几周或几个月对这些价位的反应。 功能 经典枢轴点 - 中心枢轴 P,以及三个阻力位(R1-R3)和三个支撑位(S1-S3) Camarilla 枢轴点 - 八个价位 H1-H4 和 L1-L4;H3/L3 和 H4/L4 绘制得更粗,因为这是 Camarilla 交易者最关注的价位;在经典模式中,枢轴 P 和外侧价位 R3/S3 更粗 经典、Camarilla 或两者同时显示 在同一图表上;经典线条为实线,Camarilla 线条默认使用虚线样式(线条样式可在输入参数中更改) 任意来源时间周期 - 日内图表上显示日线枢轴点,更大周期的图表上显示周线或月线枢轴点 过往周期历史 - 1 到 200 个周期,便于研究价格在这些价位附近的表现 价位根据上一个已收
FREE

The VWAP Session Bands indicator is a powerful tool designed for Meta Trader 5. This indicator calculates the Volume Weighted Average Price (VWAP) and its standard deviation bands within customizable daily sessions, offering traders a clear view of price trends and volatility. Unlike traditional VWAP indicators, it ensures smooth, continuous lines across session boundaries by using the previous candle's values for the current (incomplete) bar. Ideal for scalping or day trading on instruments lik
FREE

Supertrend Oscillation — 多敏感度 SuperTrend 共识振荡指标(MetaTrader 5) 说明:本文为英文正式描述的中文对照版本。在 MQL5 Market 上架时,请以英文版为正式描述,本中文版可作为附加译文放在英文正文之后,便于中文用户阅读。 一、指标简介 Supertrend Oscillation 把大家熟悉的 SuperTrend 思路改造成一个"广度型"振荡指标。它不再只跑一条单一 ATR 倍数的 SuperTrend,而是同时运行一整族共 20 个不同敏感度的 SuperTrend,并在每根 K 线上,把收盘价与这 20 条轨道的距离全部画出来。 它回答的是单条 SuperTrend 回答不了的问题: 当前这波行情的力度,是足以让最慢的那一档也跟着转向,还是只有最快的一档能看见? 指标绘制在独立子窗口中,包含三个部分: 网格柱(Mesh) — 20 根柱状线,对应 20 个敏感度档位。零轴之上用上涨色绘制,零轴之下用下跌色绘制。最左侧一档最敏感,最右侧一档最迟钝。 中位线(Median) — 20 个数值的中位数,以折线形式呈现;
FREE
具有双线信号、单级系统、多时间框架支持、可自定义视觉信号和高度可配置警报系统的高级MACD(移动平均线收敛发散指标)。
自由职业编程服务、更新和其他TrueTL产品可在我的 MQL5主页 获取。
非常欢迎您的反馈和评价!
什么是MACD? MACD(移动平均线收敛发散指标)是一种趋势跟踪动量指标,显示资产价格的两条指数移动平均线之间的关系。它由两条线组成:MACD线(快速EMA与慢速EMA之差)和信号线(MACD线的EMA)。 交易者使用MACD来识别趋势方向、动量变化以及潜在的入场/出场点。MACD线与信号线之间的交叉以及穿越零水平线,是最广泛使用的交易信号之一。 功能特点: 具有单级系统(零线)的双线MACD(主线和信号线) 带有三个独立可配置信号缓冲区的视觉信号标记(箭头、垂直线) 两条线的高级信号检测:方向变化、线交叉、水平交叉、峰值/谷值 具有时间范围过滤的可配置警报功能(电子邮件、推送、声音、弹窗) 带插值的多时间框架(MTF)、多种颜色模式以及用于EA集成的iCustom缓冲区访问 输入参数: 基本设置: MACD参数: 快速EMA周期(默认:12)、慢速EMA周期
FREE

使用指南
帮助您了解指标的工作原理以及 Smart Money Concepts(聪明钱概念)背后的逻辑。 指标设置指南 // 如何使用 SMC
Smart Market Concepts - 适用于MT4/MT5的全能型SMC指标:市场结构、订单块、FVG、价格区间、交易时段、斐波那契/OTE及警报功能。// MT4版本 该指标将20余种指标整合为单一“全能”工具,实时展示市场结构——包括内部及震荡的BOS/CHoCH水平、订单区块、溢价与折价区域、等高点与等低点、公允价值缺口、多时间周期的高点与低点、斐波那契/OTE水平、交易时段等丰富内容。该指标聚焦于“聪明钱”概念,融合了“内圈交易者”分析等先进交易策略以及基于“聪明钱”理念的交易策略,旨在揭示大型机构的运作机制并协助预测其动向。 “聪明钱”概念通过追踪结构如何被打破以及反应区(订单区块、供需失衡、前期高低点、交易时段窗口)可能形成的位置,帮助价格走势交易者绘制流动性分布图和关注区域。该指标将大部分标注工作自动化,让您减少绘图时间,专注于分析。 可选的警报模块会在相关 SMC 条件触发时(如结构破位、订单区块突破
FREE

是否厌倦了复杂的指标,尤其是在交易波动剧烈的黄金市场时?EasyTrend Gold MT5 指标专为驾驭黄金在任何时间周期上的波动性而设计。它利用 ATR (平均真实波幅) 的力量,将黄金的剧烈波动转化为一条清晰、动态且能过滤市场噪音的趋势线。 无论您是在 M1 周期上进行剥头皮交易,还是在 H4 周期上进行波段交易,您都可以直观地看到趋势的方向和强度,轻松识别盘整期,并获得关于何时对 XAU/USD 采取行动的直观洞察。 其他推荐资产 虽然 EasyTrend 针对黄金等高波动性资产进行了优化,但其逻辑在众多以强劲趋势著称的市场中同样非常有效: 主要外汇对: EUR/USD, GBP/USD, USD/JPY 股票指数: US500 (标准普尔500指数), US100 (纳斯达克100指数), GER30 (德国DAX指数) 加密货币: BTC/USD (比特币), ETH/USD (以太坊) 大宗商品: WTI/USOIL (原油) 1. 策略:指标的实际运作方式 EasyTrend 是一款趋势跟踪指标,它使用平均真实波幅 (ATR) 来创建一条能够适应市场波动
FREE

請查看「新功能」以了解版本 1.3 的詳細說明
//+---------------------------------------------------------------------------------------------------------------+ 我創建了這個指標,因為在我的策略中缺少了這樣的工具,並且沒有找到類似的工具。對我來說,這個指標在日內交易中表現最好,但你可以隨意進行實驗。 概述 此指標旨在通過分析價格走勢和成交量動態,幫助識別市場中的關鍵轉折點。 特點 指標策略的核心是基於識別通常在重大價格變動之前出現的高點和低點模式。這些模式通過掃描圖表,尋找具有以下特徵的K線來確定: 看跌K線模式 :當K線的高點高於[用戶可調]的前置(默認5)和後置(默認3)K線的高點時,該模式被識別。僅當該K線之前的K線數中有[用戶可調]數量的成交量逐漸減少時,才進行標記。 看漲K線模式 :當K線的低點低於[用戶可調]的前置(默認5)和後置(默認3)K線的低點時,該模式被識別。僅當該K線之前的K線數中有[用戶可調]數量的成交量逐漸減少時,才進行標記。 成交量標準
FREE
Color Levels - удобный инструмент для тех, кто использует технический анализ с использованием таких инструментов, как Трендовая линия и Прямоугольник. Имеется возможность настройки двух пустых прямоугольников, трех закрашенных и двух трендовых линий. Настройки индикатора крайне просты и делятся на пронумерованные блоки: С цифрами 1 и 2 вначале - настройки пустых прямоугольников (рамок); С цифрами 3, 4 и 5 - настройки закрашенных прямоугольников; С цифрами 6 и 7 - настройки трендовых линий. Объ
FREE
Peak Trough Analysis is the great tool to detect peaks and troughs in your chart. Peak Trough Analysis tool can use three different peaks and troughs detection algorithm. The three algorithm include the orignal Fractals Indicator by Bill Williams, the Modified Fractals indicator and ZigZag indicator. You can use this peak and trough analysis tool to detect the price pattern made up from Equilibrium Fractal-Wave process. For further usage, there are good guide line on how to use this peak trough
FREE

大家好,
我将尝试说明如何免费使用“全屏显示”功能,该功能可在单一指标和三个不同指标界面同时显示多个数据点。
首先,该指标包含哪些功能? 斐波那契水平线 FVG与OrderBlock水平线 一目均衡表 布林带 唐氏通道 回测区域 支撑与阻力区域 随机指标及ATR指标。
1. 控制面板界面包含哪些内容?
获取斐波那契值、HH值和LL值所需的实时价格数据(取自最近100根K线)。
通过分析最近100根K线得出的斐波那契水平。
OrderBlock和FVG值(在图表中以水平矩形形式显示给用户)。
2. 控制面板屏幕上显示什么?
ATR指标数据。 随机指标数据。 一目均衡表指标数据。 DonChain指标数据。 布林带指标数据 包络线指标数据 3. 指标面板显示哪些内容?
1. 和2. 指标面板显示的所有数值和数据,均通过多时间周期功能在后台进行分析。这些数据在所有时间段内向您传达什么信息?买入与卖出指标以百分比形式显示数据,并为用户提供方向指引。
请注意,这仅为参考指标,不构成投资建议。
FREE

摆动高点/摆动低点水平(分形),完整支持多时间周期。指标标记已确认的摆动点,并从这些点延伸出水平线——经典的市场流动性地图。 • 多时间周期:同时选择多个周期,在低周期图表上查看高周期摆动水平。 • 可调摆动长度(极值点左右两侧的K线数量)。 • 水平线生命周期模式:触及即删除、收盘突破后删除,或永久保留。 • 触及判定周期:可在更低周期上精确定位触及点,实现对水平线的精准截断。 • 标签、线宽和向前延伸均可配置。 • 水平触及警报:价格回到摆动水平时发出警报(默认关闭)。 图表控制面板:可拖动面板,带周期选择和设置窗口——11 种界面语言、深色与浅色主题、18 色调色板、30–300% 面板缩放。所有设置自动保存。 如果您在使用中遇到任何问题或 bug,请随时联系我——我会尽快修复。也恳请您留下评价:您的反馈是我持续为大家打造优质工具的动力。 喜欢这个指标吗?它只是我的交易面板 Trade Assistant Panel All in One MT5 的17个模块之一。面板内含全部17个指标(订单块、FVG、交易时段、成交量分布、VWAP、SMT、超级趋势等),外加一键交易:按账
FREE

大多数 SMT 指标只会标出背离。这个指标还会检验它们是否真的有效。 ICT Correlation SMT Divergence Honest Stats 将您的图表与相关市场对比(黄金对白银、EURUSD 对 GBPUSD、BTC 对 ETH、US500 对 US100),并标出每一个 SMT 背离。表格在您自己的图表上统计 SMT 之后价格反转的频率是否高于普通新高或新低之后的反转频率。免费,属于 Honest Stats 系列。 MT4 版本 | ICT Killzones Honest Stats(免费) | ICT FVG Honest Stats(免费) | ICT Liquidity Levels Honest Stats(免费) | TrueRisk Trade Panel(免费) | TrueRisk Account Guard(每日亏损限额,免费) 新品:所有 ICT 概念集于一个指标 -> ICT Pro All in One Honest Stats (9 个因素的共振分数、提醒和多品种扫描器) 新品(免费):带提醒的溢价 / 折价和 OTE 区 -> ICT
FREE
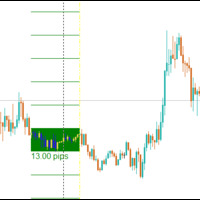
The Central Bank Dealers Range (CBDR) is a key ICT concept, used to project potential highs and lows for the day based on market conditions during a specific time window. The CBDR is utilized to forecast price movements in both bullish and bearish market conditions. By identifying this range, traders can better anticipate the price levels that may form as the day progresses.
CBDR and Standard Deviation A key feature of the CBDR is its application of standard deviation , a statistical measure u
FREE

BKT ZeroFlow 适用于 MetaTrader 5 的多周期趋势指标,将零延迟均线与 ATR 波动通道结合,同时识别五个周期的趋势方向。 BKT ZeroFlow 是一款适用于 MetaTrader 5 的趋势跟踪指标。它以基于 ATR 波动通道平滑处理的零延迟均线为核心,判断市场当前处于多头或空头阶段。趋势翻转箭头标记价格首次突破通道边界的时刻,入场箭头则在已确认趋势中的回调位置出现。图表上直接内置五周期仪表盘与虚拟胜率追踪器。 概述 核心曲线为零延迟均线,通过引入回溯修正项减少标准指数移动平均线固有的滞后性。在该曲线周围,以可配置窗口内 ATR 的滚动最大值构建上下 ATR 通道。当收盘价突破上轨时登记为多头趋势;当收盘价跌破下轨时登记为空头趋势。趋势状态保持不变,直至反向突破发生。 可选的 ATR 基准过滤器将当前 ATR 与短期 ATR 均值进行比较。当 ATR 低于基准时,市场被视为横盘整理,不生成新信号,从而减少震荡期的噪音干扰。 左上角的仪表盘同时显示 M5、M15、H1、H4 和 D1 五个周期的趋势状态。每行根据独立应用于该周期的相同零延迟均线逻辑显示 B
FREE

该指标可在图表中自动识别关键的供给区与需求区(可能引发价格反应的区域)。其计算基于结构化的枢轴(Pivot)逻辑,并结合基于 ATR(平均真实波幅)的动态区间宽度,从而能够适应不同的市场条件。 识别出的区域以矩形形式显示在图表中,并在未被定义的市场行为“消化”(Mitigation)之前保持有效。 工作原理 自动区域识别: 通过枢轴分析检测局部高点和低点,并将其解释为供给区或需求区。 动态区间宽度: 区域大小由平均真实波幅(ATR)控制,并可通过乘数进行调整。 Mitigation 逻辑: 当价格突破区域内预设阈值时,该区域将被视为无效。 重叠过滤: 可自动过滤彼此接近的同类型区域,以确保图表清晰。 多时间框架分析: 计算可基于任意选择的时间周期进行,独立于当前图表。 区域以彩色矩形显示在图表中,并可选择显示每个区域内的 50% 中线(均值水平)。颜色、线条样式及显示选项均可自定义。还可选择显示标签以标识区域。 内置仪表板(图表注释)显示当前状态、有效的供给区与需求区数量,以及价格与最近区域之间的距离(点数)。帮助快速了解当前市场中的关键价格位置。 提供可选通知功能,当价格进入某一区域
FREE

The indicator synchronizes eight types of markings on several charts of one trading instrument.
This indicator is convenient to use in conjunction with "Multichart Dashboard" or other similar assistant that allows you to work with several charts at the same time.
"Multichart Dashboard" can be found under the link on my youtube channel.
Settings:
enable vertical line synchronization
enable horizontal line synchronization
enable Trend Line synchronization
enabling Fibonacci Retracement synchron
FREE

Technical and Professional Description of the Indicator Price Structure, Fibonacci, Financial Volume, and Interest Zone Indicator This indicator was developed based on in-depth studies of price structure, Fibonacci levels, financial volume behavior, and the identification of market interest zones . Its primary purpose is to transform these different analytical elements into a structured visual tool, allowing users to identify key levels and areas of greater structural relevance on the chart in a
FREE

Professional Cycle Analysis with MACD Momentum Sync. Fusion Cycles is a high-performance indicator designed to identify market cycles by merging Stochastic dynamics with MACD momentum filtering. It offers a clear visual map of trend strength through its proprietary dynamic-color line system. Key Features: Momentum Synchronization: The main oscillator line changes color (Lime/Red) based on the MACD Histogram slope, preventing trades against the short-term flow. Strategic DNA Zones: Calibrated at
FREE

Stop Target Position Planner 是一款适用于 MetaTrader 5 的免费工具,功能类似于 TradingView 上的风险回报比工具,让您在下单之前就能清楚看到每笔交易的风险和目标。
使用方法非常简单:先点击您的入场位置,再点击您的止损位置。工具会自动在图表上画出止损线、入场线,以及任意数量的止盈目标线。每个目标按照 R 的倍数(例如 1R、2R、3R)计算,每条线上都会清楚显示点数和对应的 R 值。
所有设置都可以在图表上的小型面板中完成:目标数量、颜色和线条样式,都能根据您的习惯自由调整。
每个工具都是一个独立的图表对象:您可以选中它、调整大小、移动位置或删除它。图表上可以同时保留任意数量的工具,方便您同时规划多笔交易。
完全免费,适用于 MetaTrader 5,由 TradeToolsOfficial 提供。
FREE

ELOHIM FX – BREAKOUT FIB Session Breakouts. Fibonacci Levels. Clear Trading Structure. Elohim FX – Breakout Fib is a professional MetaTrader 5 indicator designed to help traders identify session opening-range breakouts and automatically map important Fibonacci levels after a confirmed breakout. The indicator combines market structure, session ranges, previous higher-timeframe levels, breakout confirmation and Fibonacci projections into one clean visual trading tool. KEY FEATURES Previous High /
FREE
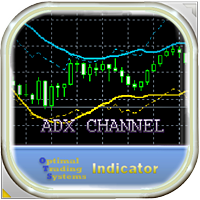
This indicator forms a channel based on the readings of the ADX (Average Directional Movement Index) indicator, displays and informs the trader of a price reversal at the boundaries of this channel, and can also report when the price touches the channel boundaries. It also draws additional dotted lines, which depend on the readings of the + DI and -DI of the ADX indicator. It also has an option for filtering signals depending on the readings of the stochastic. The channel drawn by this indicato
FREE
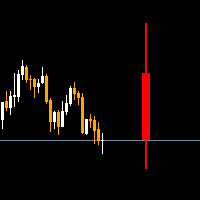
The Higher timeframe candle tracker is used to get a glimpse of what the selected higher time frame candle is like. It plot the candle after the current price. It can come in handy for day traders and short term traders that often worry about how the current higher timeframe candle may look like. You can select the higher time frame or lower time frame from the options provided: By default the color for bears is red and for bulls is green. You are able to change the width of the candle, its wick
FREE

Daily POC 是一款高性能的成交量分布(Volume Profile)指标,专门用于提取每日交易时段(D1)的数据。它非常轻量级,可以在多个资产上同时运行而不会导致 MetaTrader 5 卡顿,并且在更改时间周期或应用模板时,绝不会在图表上留下“幽灵”对象或框。 它用于通过数学方法识别当天最大的机构流动性区域。该指标会自动绘制: POC(控制点):交易量最大的价格水平(实线)。 VAH(价值区域高点)和 VAL(价值区域低点):集中了当天70%成交量的极端位置(虚线)。 会话框:一个低调的视觉背景,界定了交易日的开始和结束。 这些水平可作为日内交易和波段交易的强大支撑、阻力和磁性目标。 该指标专为“即插即用”理念而设计,专注于保持图表尽可能整洁: 键盘控制(快捷键):该指标默认配置在“B”键上。只需在键盘上按下字母“B”,POC 和会话框就会立即显示。再次按下“B”即可隐藏所有内容并清理屏幕。 历史限制器:在参数中,您可以定义想要查看过去多少天的数据。这将您的分析集中在近期价格上,并节省 CPU 资源。
FREE

Çoklu zaman dilimi desteği, özelleştirilebilir görsel sinyaller ve yapılandırılabilir uyarı sistemi ile Bollinger Bands göstergesi.
Freelance programlama hizmetleri, güncellemeler ve diğer TrueTL ürünleri MQL5 profilimde mevcuttur.
Geri bildirim ve değerlendirmeler çok memnuniyetle karşılanır!
Bollinger Bands Nedir? Bollinger Bantları, üç çizgiden oluşan bir teknik analiz aracıdır: orta bant (hareketli ortalama), üst bant ve alt bant. Üst ve alt bantlar, orta banttan standart sapmalar olarak
FREE

WaveMaster Oscilloscope
transforms your MT5 chart into a professional-grade oscilloscope - a precision instrument that converts market behavior into a live, multi-channel waveform. Instead of guessing what price is "doing," you simply watch it happen in real time. Inspired by the signal-analysis tools used in advanced electronics laboratories, WaveMaster oscilloscope reads the pulse of the market and renders it as a beautiful, animated waveform directly on your chart. This is not another lin
FREE

The "Support Resistance Dynamic" indicator is a powerful technical analysis tool for the MetaTrader 5 platform, designed to automatically identify and plot dynamic Support and Resistance zones on price charts. This indicator helps traders easily recognize important price levels, potential reversal points, or breakout areas, thereby enabling more informed trading decisions. 2. Key Features Dynamic S/R Identification : Automatically identifies support and resistance zones based on an advanced Pivo
FREE

Artemis Scalp X Pro MT5 指标 一款专业、无重绘的多重共振剥头皮指标,专为不满足于简单箭头信号的交易者而设计。 Artemis Scalp X Pro 适用于外汇、加密货币、黄金及其他贵金属和指数市场,主要用于较低时间周期,将复杂的市场信息转化为清晰、结构化的交易决策。 Artemis Scalp X Pro 不依赖单一指标或僵化的过滤器链,而是将趋势、动量、波动率、市场参与度、市场结构和多时间周期背景整合到一个自适应评分引擎中。其结果是一套更加清晰、智能的信号系统,能够适应快速变化的市场,同时避免让图表充斥过多噪音。 所有主要信号均在蜡烛图收盘后生成。高时间周期确认也只使用已完成的蜡烛图,从而帮助历史信号在刷新或重新计算后保持稳定。 这不是一个普通的买入/卖出指标。 Artemis Scalp X Pro 会围绕每个符合条件的交易设置创建完整的交易地图,包括入场价、止损、TP1、TP2 和 TP3。原始交易地图会始终与信号绑定,并可在切换时间周期、切换交易品种或重启 MT5 后继续保留。 从 M5 切换到 M15 时,原始交易计划不会改变。切换到其他市场后再返回
FREE
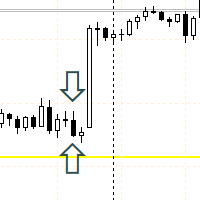
This is a simple order block locator. Searched for the existence of order blocks only at extremums. If you want multi criteria order block location check my other indicator which is more powerful here These order blocks are ICT order blocks without any buttering.
The indicator can be a useful tool for detecting reversals, continuations. You can also use the indicator as confluence with your other tools
FREE

If you love this indicator, please leave a positive rating and comment, it will be a source of motivation to help me create more products <3 Key Takeaways The Zig Zag Advanced indicator plot points on a chart whenever prices reverse by the percentage the trader sets in the input section. The Zig Zag Advanced indicator lowers the impact of random price fluctuations and is used to identify trends and changes in trends. The indicator lowers noise levels, highlighting trends higher and lower. Th
FREE

VWAP Volume Profile Pro 专业市场结构分析工具 VWAP Volume Profile Pro 是一款专业级市场分析指标,将 VWAP(成交量加权平均价) 、 Volume Profile(成交量分布) 、 Point of Control (POC) 、 Value Area High (VAH) 和 Value Area Low (VAL) 集成于一个强大的分析工具中。 该指标基于成交量分布与市场公平价格(Fair Value)进行客观的市场结构分析,帮助交易者识别关键支撑与阻力位、主力资金成交区域、买卖双方力量平衡,并寻找高概率交易机会。 适用于: 外汇(Forex) 差价合约(CFD) 股票 指数 期货 贵金属 原油 加密货币 为什么选择 VWAP Volume Profile Pro? 大多数交易者需要分别使用 VWAP 和 Volume Profile 两种工具进行分析。 VWAP Volume Profile Pro 将二者完美结合,让您能够同时分析: 市场公平价格(Fair Value) 成交量分布 主力资金关注区域 市场平衡状态 关键支撑与阻力位
FREE

AI Round Number Psychological Levels Indicator automatically plots the "00" and "50" round-number price levels around current price - the same psychological price zones where institutional orders, stop clusters, and retail reactions consistently pile up, on every symbol and every timeframe. KEY FEATURES
- Automatically calculates and draws round-number levels above and below the current price based on a configurable step distance (in points), adapting to any symbol's price scale.
- Distinguishes
FREE

Makito Buy and Sell Indicator 是一款适用于MT5平台的技术分析指标。它结合价格行为、市场结构以及内部确认条件,帮助交易者识别潜在的买入和卖出机会。 当市场条件符合内部信号模型时,指标会直接在价格图表上显示清晰的 BUY 或 SELL 箭头。用户还可以选择显示风险与收益区域,从而直观地查看可作为止损和目标价格参考的范围。 主要功能 清晰易读的BUY和SELL箭头 价格行为与市场结构分析 盘整行情过滤功能 信号冷却机制,减少短时间内重复出现的信号 可视化风险与收益区域 支持弹窗、声音、推送和电子邮件提醒 K线收盘后确认交易信号 适用于不同交易品种和时间周期 仅作为分析指标使用,不会自动开仓或执行交易 绿色向上箭头表示潜在的 买入机会 ,红色向下箭头表示潜在的 卖出机会 。建议将指标信号与当前市场趋势、重要价格区域、支撑与阻力以及个人交易规则结合使用,不应仅依靠单一箭头决定是否进入市场。 本指标可以用于短线交易、日内交易、波段分析、趋势确认以及手动交易入场参考。不同品种和时间周期可能产生不同的信号表现,因此用户应根据自己的交易方式进行测试和调整。 免责声明:
FREE

Master Market Trends with the Hilo Flow Indicator Stop trying to predict the market and let the colors guide your decisions. Hilo Flow is the visual evolution of the classic HiLo Activator. Designed for traders who seek extreme clarity , it eliminates chart clutter and translates market flow strength directly into candle colors. Forget confusing lines and hesitation when aking decisions. With Hilo Flow, you can clearly identify potential moments to enter, hold a position, or exit a trade. Ho
FREE

PROMETHEUS TECHNICAN VERSION Free | By THE SONS A gift from The Sons — no strings, no trial, no expiry. Every trader deserves access to professional-grade market intelligence. That belief is why Prometheus Technical Version exists, and why it costs nothing. Consider it our handshake to the trading community. What You're Getting This is not a simplified tool dressed up as a gift. Prometheus Technican Version is a fully built, institutional-quality technical analysis indicator running a dual-model
FREE

Pivot Point Shift Supertrend 指标是用于 MetaTrader 5 的 无重绘 跟踪型 Supertrend 系统。与经典 SuperTrend 将带宽锚定在动态 hl2 中点不同,本指标将带宽锚定在已确认枢轴点的加权平均价上。其结果是一条在普通波动中保持稳定、只在市场结构真正发生变化时才翻转的跟踪线。 指标使用可配置回溯周期(默认:两侧各 2 根 K 线)检测枢轴高点与枢轴低点,按 2:1 加权公式更新一条平滑的中心线,在该中心线之上和之下放置 ATR 倍数通道,并应用标准 SuperTrend 跟踪规则,生成具有方向性的 Supertrend 线。趋势翻转时,会在图表上以文字标签形式给出买入和卖出信号,并通过弹窗、声音、推送通知或电子邮件发出提醒。 MT4 版本地址: Pivot Point Shift Supertrend MT4 更多产品请见: 所有产 品 如需查看真实账户示例和最新工具,请访问我的个人主页并发送好友请求,以免错过更新!
工作原理 枢轴识别。 当第 N 根 K 线的最高价高于其左右各 Pivot Point Period 根
FREE

一次点击规划每笔交易:Entry、Take Profit 和 Stop Loss 自动画出。不重绘。
任何品种,任何时间周期。2 分钟加到图表。免费下载。
Get more indicators here
Baselines, volatility filters and oscillators. No repaint.
为什么需要它 你手动按平均真实波幅(ATR)规划交易。你读取 ATR,做乘法,换算成价格,再计算手数。每一步都可能出错,而且每笔交易的数字都不同。 放错的 stop loss 或算错的手数,比你省下的几分钟代价更大。 你将获得 Fabii NNFX Atr Levels 在图表上画出完整的交易计划,所以你不必手动计算水平。 点击任意K线,得到 Entry、Take Profit 和 Stop Loss 线,让你一次点击就有完整计划。 两个独立的 ATR 设置,一个用于 Take Profit,一个用于 Stop Loss,让你分别控制每个距离。 根据你的风险百分比计算手数,在角落显示为 LOT,让你入场前就知道仓位大小。 标签可显示价格或距入场点的点数,让你用喜
FREE
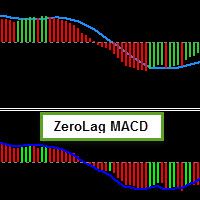
It is the MQL5 version of zero lag MACD that was available for MT4 here: https://www.mql5.com/en/code/9993 Also there was a colored version of it here but it had some problems: https://www.mql5.com/en/code/8703 I fixed the MT4 version which has 95 lines of code. It took me 5 days to write the MT5 version.(reading the logs and testing multiple times and finding out the difference of MT5 and MT4!) My first MQL5 version of this indicator had 400 lines of code but I optimized my own code again and n
FREE

Easily get all relevant economic events of the current day right into your chart, as markers. Filter what kind of markers do you want: by country (selected individually) and by Importance (High relevance, Medium, Low or any combination of these). Configure the visual cues to your liking. If there is more than one event set to the very same time, their Names will be stacked and you will see the messages merged with the plus (+) sign on the marker. Obviously that long or too much events on the sam
FREE

ICT Asian London NY Sessions Killzones is an essential visual framework designed for Forex, Gold (XAUUSD), Indices, and Crypto traders following Inner Circle Trader (ICT) concepts, Smart Money Concepts (SMC), and session breakout strategies.
Key Features: - Asian Range (00:00 - 08:00 GMT) - London Open Killzone (06:00 - 09:00 GMT) - New York Open Killzone (11:00 - 14:00 GMT) - London Close Killzone (15:00 - 17:00 GMT) - Automatic Broker GMT Offset Detection - Session High and Low Breakout Lines
FREE

### RECOMMENDED SETTINGS & PAIR - **Primary Instrument:** XAUUSD (Gold) - **Timeframe:** M1 (1-Minute Scalping) - **Trading Style:** Smart Money Concepts (SMC) & Order Block Scalping - **Account Type:** ECN / Raw Spread / Low Spread Broker (Recommended for M1 execution) - **Recommended Sessions:** London & New York Sessions (Peak Liquidity & High Volatility) # XAUUSD M1 Precision Order Block Scalper Dashboard
Unlock high-probability scalping entries on Gold (XAUUSD) with this advanced real-t
FREE

This indicator plots the volume profile by Price on the chart
There are 5 ways to view it:
By Total Volume Traded (Premium Version); Volume Ticks(Forex) Separated by Buyers and Sellers (Premium Version); Buyers Only (Premium Version); Sellers Only (Premium Version); Business balance (Buyers - Sellers) (Premium Version); .
It is possible to select how many days the profiles will be calculated.( Premium Version)
On the current day it recalculates the histogram data for each new candlestick.
FREE

RSI Assistant MT5 – 高级RSI交易工具 主要功能 智能RSI可视化 – 使用平滑的颜色填充区域清晰显示超买和超卖区间 高级信号检测 – 根据RSI区域强度(70、80、90 / 30、20、10)以不同颜色显示多头和空头箭头 基于区域的提醒 – 根据不同RSI区域的信号强度接收不同提醒 多周期RSI面板 – 使用交互按钮监控M15、M30、H1和H4的RSI数值 动态状态按钮 – 按钮会自动变色以显示超买(红色)和超卖(绿色)状态 提供专业版本 – 解锁 16+交易策略 -> Strategy Assistant 立即体验 保持更新 – 加入我们的MQL5社区 @hdtradinglab频道 获取最新更新和免费交易工具 简介 RSI Assistant MT5 是一款功能强大且完全免费的指标,旨在增强传统RSI的使用体验。通过先进的可视化、智能提醒和多周期分析,帮助交易者轻松理解RSI行为并识别高质量交易机会。 完整描述 RSI Assistant MT5 不仅仅是一个标准的RSI指标,而是一个升级后的专业工具,使RSI分析更加清晰、智能且适用于真实
FREE

The idea of a Value Chart indicator was presented in the very good book I read back in 2020 , " Dynamic Trading Indicators: Winning with Value Charts and Price Action Profile ", from the authors Mark Helweg and David Stendahl. The idea is simple and the result is pure genius: Present candlestick Price analysis in a detrended way!
HOW TO READ THIS INDICATOR
Look for Overbought and Oversold levels. Of course, you will need to test the settings a lot to find the "correct" one for your approach. It
FREE

MT4 版本: https://www.mql5.com/en/market/product/183369
MT5 版本: https://www.mql5.com/en/market/product/183370
平滑 Heikin Ashi 指标
平滑 Heikin Ashi 指标是一款专业的趋势跟踪指标,旨在通过改进的 Heikin Ashi 平滑方法,帮助交易者识别市场方向、趋势转换以及潜在的入场或出场区域。
与标准 Heikin Ashi 指标不同,该指标采用两阶段平滑处理,以减少市场噪音,使趋势可视化更加清晰。它适用于希望获得更简洁的图表、更平滑的趋势信号以及多时间框架确认的交易者。
该指标直接在主图表上显示平滑后的 Heikin Ashi 蜡烛图,并提供可选的箭头、警报、多时间框架模式以及图表开关按钮,以提高易用性。
主要功能
直接在主图表上显示平滑后的 Heikin Ashi 蜡烛图。
支持多时间框架,用于更高时间框架的趋势确认。
趋势转换箭头指示潜在的看涨和看跌转换。
可选的趋势转换警报。
警报选项包括消息、声音、推送通知和电子邮件。
图表开
FREE

枢轴点是市场上相当一部分人每个交易时段都在看的支撑与阻力位,在任何图表上算法都一样。这款 Pivot Points 会用上一根已收盘的 K 线替你算好并画出来:中枢、阻力和支撑各自标注价格,并给出与当前价的距离。 三种计算方式 Classic ,经典枢轴:中枢,R1 到 R3,S1 到 S3。 Fibonacci :以前一段波幅的 0.382、0.618、1.000 比例投射出阻力与支撑。 Camarilla :基于收盘价的价位,包含反转位 R3 与 S3、突破位 R4 与 S4。 日线、周线或月线 选择枢轴的取值周期。看当日行情用日线,需要整周或整月有效的高级别价位就用周线和月线。一次只画一个周期,图表才不会乱。 一眼看清每个价位 每个价位都是带价格标注的线,紧凑的面板会把它们按 Resistance、Pivot、Support 的顺序分组,每组之内从最外侧的价位开始排。每一行都写着该价位的价格,以及当前价距它多远。这个距离要按点数、价格差还是百分比显示,由你自己选。百分比是唯一在任何品种上含义都相同的一种。 价格到了就提醒你 可选功能,不打开就不会动。弹窗、声音、推送到手机
FREE

### Donchian Channels Trend v1.0 基于突破的趋势跟踪指标,它将价格行为封装在基于历史高点和低点的动态包络线中。该工具最初为TradingView设计,通过使用状态记忆提供方向偏差的清晰可视化。
**工作原理** 该算法计算指定回溯期内的绝对最大值和最小值。它利用有限状态机 (FSM) 根据结构性价格突破来维持当前的趋势方向: * **看涨状态** :当当前价格高点向上突破前一期的上轨时激活。 * **看跌状态** :当当前价格低点向下突破前一期的下轨时激活。
**视觉特征** * 动态的上下阈值通道线。 * 代表中点的中心基准线。 * 基于当前活动趋势状态改变整个通道颜色的动态颜色路由。 * 趋势转换时生成信号。
**参数**
| 参数 | 默认值 | 描述 | | :--- | :--- | :--- | | `InpLength` | 20 | 用于计算高点和低点的回溯期。 | | `InpEnableAlerts` | false | 启用或禁用所有警报的主开关。 | | `InpAlertPopup` | true | 启用终端弹出警报
FREE

AI Multi Timeframe Trend Dashboard shows the trend direction of six timeframes at once - M15, M30, H1, H4, D1 and W1 - in a single, always-on-chart panel, so you never have to flip through charts to check higher-timeframe alignment before entering a trade. The indicator compares a fast and slow EMA on each of the six timeframes independently and displays a clear UP, DOWN or FLAT reading for every one of them, color-coded for instant recognition. Trading with the trend across multiple timeframes
FREE

The CV Stochastic RSI Divergence Indicator is a professional trading tool designed to detect bullish and bearish divergences with precision and clarity. By combining a customizable StochRSI engine, intelligent swing analysis and advanced divergence filtering, the indicator helps traders identify potential market reversals before major price movements occur. Features: Automatic bullish & bearish divergence detection Adjustable RSI, Stochastic and smoothing settings Overbought / Oversold zone filt
FREE

This indicator uses the Zigzag indicator to identify swing highs and swing lows in the price chart. Once it has identified the swing highs and swing lows, it can use them to determine potential support and resistance levels. A support level is formed when the price drops and bounces back up from a swing low, indicating that there is buying pressure at that level. A resistance level is formed when the price rises and reverses downward from a swing high, suggesting selling pressure at that level.
FREE

概述
公允价值缺口 (FVG) 指标 v3.0 是一款适用于 MetaTrader 5 的专业工具,旨在实时检测和可视化市场失衡(低效)情况。该指标可识别价格留下的流动性缺口区域,这些缺口通常会形成价格磁石或支撑/阻力区域。
主要功能
自动检测:准确识别看涨和看跌的公允价值缺口。
多时间框架 (MTF):可在单个图表上同时监控多达 8 个时间框架。
反向公允价值缺口 (IFVG):检测公允价值缺口区域何时被突破并转变为反向区域(支撑位变为阻力位,反之亦然)。
高级缓解逻辑:可定义何时将区域视为“已缓解”(影线、实体或 50%)。
全面的警报:当价格触及某个区域或检测到汇合点时,会弹出窗口、推送通知(移动设备)和声音通知。
优化性能:高性能图形渲染系统,不会降低平台速度或导致闪烁。
视觉解读
1. 实心矩形(活跃 FVG)
这些矩形代表尚未完全缓解或消除的不平衡区域。
蓝色(可配置):看涨 FVG。潜在需求区。预期价格将反弹。
红色(可配置):看跌 FVG。潜在供给区。预期价格将下跌。
2. 虚线
矩形中心的虚线标记了该区域的 50%(连续突破),这是机构
FREE

Tension Flow Trend — 带有历史盈亏比回测 Dynmaic HMA 带状指标 Tension Flow Trend 是一款用于 MetaTrader 5 的高级趋势 shadow 指标,它将 赫尔移动平均线 (HMA) 趋势带、Z-Score 动量分析以及内置的直观风险回报比 (Risk:Reward) 回测引擎完美融合于单个图表叠加层中。该指标旨在识别高概率的趋势延续机会,通过要求斜率确认的 HMA 交叉以及可配置的信号冷却时间来过滤市场噪音,从而生成交易设置。 当有效的买入 (BUY) 或卖出 (SELL) 信号出现时,指标会自动计算并在图表上直接绘制出完整的交易结构,包括入场价、基于 ATR(200) 的止损位以及基于风险回报比的止盈位。动态的止盈 (TP) 和止损 (SL) 框会随着 K 线逐根向前延伸,直到触及其中一个级别,从而为每笔完成的交易创建清晰的视觉历史记录。 核心功能 动态赫尔移动平均线 (HMA) 带: 凭借响应迅速的 HMA 计算实现平滑的趋势检测。带状宽度根据市场波动性自动扩展和收缩。牛市和熊市趋势状态通过颜色编码,以便进行快速的视觉 cru
FREE

NAD RSI Cross NAD RSI Cross is a simple RSI-based signal indicator that provides clear BUY and SELL signals directly on the chart. How It Works BUY — RSI 14 crosses above 30 after the candle closes. SELL — RSI 14 crosses below 70 after the candle closes. Features RSI 14 BUY level: 30 SELL level: 70 Closed-candle confirmation Clean chart with simple arrows No RSI panel Suitable for XAUUSD M1 Can also be used on other instruments and timeframes SL & TP Set your own SL and TP according to you
FREE

The Swing High Low and Fibonacci Retracement Indicator is a powerful technical analysis tool designed to identify key price levels and potential reversal zones in the market. It automatically detects recent swing highs and swing lows on the chart and overlays Fibonacci retracement levels based on these points. This indicator helps traders: Visualize market structure by highlighting recent swing points. Identify support and resistance zones using Fibonacci ratios (e.g., 38.2%, 50%, 61.8%). Adapt
FREE
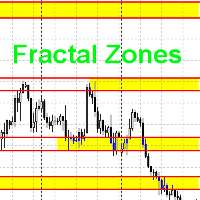
This indicator draws trading zones based on fractals from higher periods, which simplifies trading by levels.
This indicator draws two types of trading zones on one chart.
For example, if the current period is H1, then trading zones will be searched for by fractals from H4 and D1.
In the standard settings, fractal zones from H4 will be drawn in yellow, and from D1 - in green.
When zones are superimposed, colors are mixed at the intersection of zones. I don’t know how to fix this at the mome
FREE

The XR Gartley Pattern MT5 is an indicator which displays and alerts Gartley pattern detected on the candlestick chart. It also displays potential trade with calculated Take Profit and Stop Loss. After purchasing XR Gartley Pattern Indicator, you can immediately download this indicator from the MT4-MT5 Market and start using it because all features are set to default, is not necessary to change any parameter. List of all our available tools for Traders: https://www.mql5.com/en/users/mqlblue/sell
FREE

Range Filter Signals is a free indicator for MetaTrader 5. Its range filter line moves only when price travels further than its smoothed average range, so it stays flat in choppy price action and follows a real move. Buy and sell arrows mark the turns, with alerts. It places no orders. Everything comes from closed bars, so an arrow never appears and then disappears. Standalone: everything is built in. You do not need to buy or install any other product named on this page. Quick start Attach it t
FREE

Supply Demand KPG – 供需区域指标 for MetaTrader 5 Supply Demand KPG 基于价格行为和成交量自动识别供应区(阻力)和需求区(支撑)。无需手动绘制区域,指标直接在图表上显示,帮助交易者快速找到价格可能反转或突破的关键区域。
主要优势
1. 智能供需区域识别 - 供应区域显示为橙色 – 潜在阻力区。 - 需求区域显示为蓝色 – 潜在支撑区。 - 指标自动扫描图表,仅保留有效区域,删除已被突破或重叠的区域。
2. 基于成交量的区域强度评估 - 每个区域显示累积成交量及其占总量的百分比。 - 粗边框 = 高可靠性区域。 - 细边框 = 较低可靠性区域(需额外确认)。
3. 动态更新与自动删除区域 - 被突破的区域自动消失,保持图表整洁。 - 超出限制的老旧区域自动删除,聚焦最近的有效区域。
4. 总供应 / 总需求显示 - 图表左角显示两行文字(Total Supply 和 Total Demand),展示所有活跃区域的累积强度。 - 可自定义位置和字体大小。
5. 使用指南面板 - 简洁面板解释区域颜色、边框粗细及其含义。 -
FREE

======================================================== OFX DELTA — MQL5 MARKET PRODUCT DESCRIPTION (formatting notes: **bold** = editor Bold button; lines starting with "•" = bullet-list button; UPPERCASE lines = section headings) ========================================================
SHORT TITLE (product name field): OFX Delta — Per-Bar Volume Delta / Order-Flow Imbalance for XAUUSD (Gold)
------------------------------------------------------- OVERVIEW -------------------------------
FREE

AI Divergence Scanner Multi Symbol continuously scans an entire watchlist of symbols for RSI divergence at the same time, so you never have to manually flip through charts looking for a setup - the scanner brings the divergences to you on a single panel. KEY FEATURES
- Monitors a fully customizable list of symbols simultaneously (default: EURUSD, GBPUSD, USDJPY, XAUUSD, AUDUSD) - add or remove any symbols your broker offers.
- Detects both bullish divergence (price makes a lower low while RSI ma
FREE
Multi Timeframe Average True Range 可在您所操作的图表上显示任意周期的波动率(ATR),例如在 M1 图表上显示 M15 或 H1 的 ATR。您可以根据实际交易所用周期的波动率来设置止损、目标和过滤条件。 功能特点 在任意图表上显示所选周期的波动率(M1 至 MN1) 标准 ATR 或 NATR (截尾 ATR):在求平均之前舍弃最大的 True Range(或两端极值),因此单根新闻 K 线不会抬高数值 可选的第二条线显示标准 ATR,便于与 NATR 对比 “Closed bar only”模式:所选周期最后一根已收盘 K 线的值。该值在 K 线内部不会变化,也不会重绘 数值以价格单位(与标准 ATR 相同)或点数显示 防“拉伸”保护:如果图表周期大于所选周期,指标将按图表周期计算(可关闭) 自动加载所选周期的历史数据:在终端尚未使用过的品种上,窗口可能短暂为空,随后线条会自动出现,无需切换周期 轻量快速:数值按高周期 K 线缓存,计算的 K 线数量由参数限制 不进行交易,不使用 DLL、文件或网络请求 输入参数 Timeframe - 显示其波
FREE

DMSL Pro Ultra is a professional MetaTrader 5 (MT5) trading indicator that helps traders understand market structure and identify high-probability trading zones. It automatically detects important support and resistance levels, highlights major swing highs and lows, and displays market structure changes in real time. The indicator is designed to reduce chart clutter while providing clear, actionable trading information. Key Features Automatic Support & Resistance Detection Identifies strong supp
FREE

Backed by volume , this is a professional-grade VWAP tool anchored to swing points rather than time sessions. Provides directional bias through cyan/magenta color-coding and standard deviation bands for high-probability entries. How It Works Bullish : Close above Depth period high → VWAP anchors to swing low, color = Cyan Bearish : Close below Depth period low → VWAP anchors to swing high, color = Magenta On structure break, VWAP re-anchors to previous swing extreme automatically Key Features N
FREE

### Impulse MACD [ LazyBear ] v1.0
本指标是LazyBear于2015年在TradingView发布的开源指标的移植版本,已累计超过8,700个收藏。它通过平滑移动平均通道过滤MACD的虚假信号,仅在价格突破通道时才生成动量读数。
#### 计算原理
指标对最高价和最低价分别应用平滑移动平均(SMMA)构建价格通道,对典型价格(HLC3)计算零延迟EMA(数学上等同于DEMA)。ImpulseMACD的值定义如下:
- **正值** :ZLEMA高于通道上轨时(多头冲量) - **负值** :ZLEMA低于通道下轨时(空头冲量) - **零值** :ZLEMA处于通道内时(横盘市场,无信号)
信号线(ImpulseMACD的SMA)和差值柱状图构成完整的显示界面。
#### 视觉元素
- 彩色柱状图(4种状态):酸橙色、绿色、橙色、红色,根据价格相对于ZLEMA和SMMA通道的位置确定 - 深红色信号线(ImpulseMACD的SMA) - 蓝色差值柱状图(ImpulseMACD − 信号线) - 零轴参考线 - 多渠道警报:弹窗、声音
FREE
MetaTrader市场是您可以下载免费模拟自动交易,用历史数据进行测试和优化的唯一商店。
阅读应用程序的概述和其他客户的评论,直接下载程序到您的程序端并且在购买之前测试一个自动交易。只有在MetaTrader市场可以完全免费测试应用程序。
