XFibo Auto Fibonacci
- 指标
- 版本: 2.6
- 激活: 10

Use with disciplined risk management.

Use with disciplined risk management.
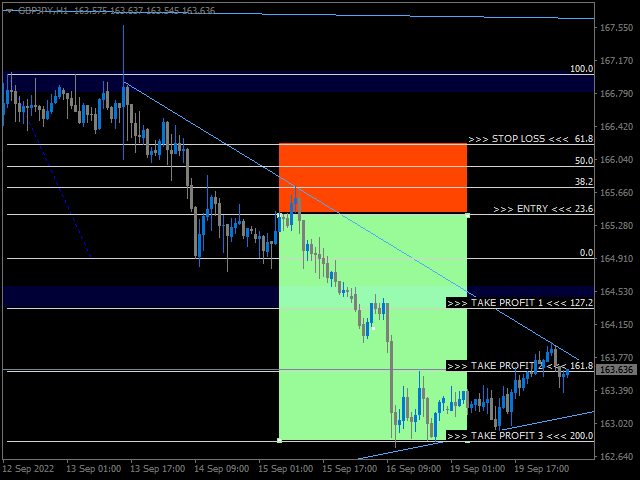
Great product. This tool helps my trading alot. I combina this tools with a other tool i use to make great chooses. The only thing i dont like about this product is that it's extending his range, but i understand why because when the trend is going more down or up the fib also extents. Besides that its great!
Great product. This tool helps my trading alot. I combina this tools with a other tool i use to make great chooses. The only thing i dont like about this product is that it's extending his range, but i understand why because when the trend is going more down or up the fib also extents. Besides that its great!