适用于MetaTrader 4的付费技术指标 - 6

"Sentiments of traders" in the financial markets is a topic that has been of interest to us for a long time. In time, we could not find the right formula to define these sentiments. We went through many stages in the search for the right methodology - from taking data from external sources to calculate open positions of buyers and sellers to calculating tick volumes, but still we were not satisfied with the results. The calculation of open positions of buyers and sellers from external sources ha
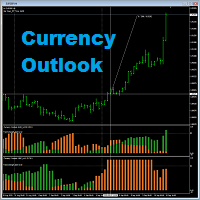
Currency Outlook is an indicator that can help us "Trade the right pair in the right direction and at the right time". This indicator analyzes prices of all cross currency pairs of the selected currency and report the result to us in form of double colours histogram diagram. The maximum height of the histogram diagram of the indicator is 100. The indicator is exclusively programming for AUD, CAD, CHF, EUR, GBP, JPY, NZD and USD. It can work in any timeframe in MT4. A feature for calculating trad

The most crucial price level in any "Volume Profile" is the "Point of Control" . Is the price level with the highest traded volume. And mainly, is the level where the big guys start there their positions, so it's an accumulation/distribution level for smart money.
The idea of the indicator arose after the "MR Volume Profile Rectangles" indicator was made. When creating the "MR Volume Profile Rectangles" indicator, we spent a lot of time comparing the volumes with those from the volume profile

** All Symbols x All Time frames scan just by pressing scanner button ** *** Contact me to send you instruction and add you in "Divergence group" for sharing or seeing experiences with other users. Introduction MACD divergence is a main technique used to determine trend reversing when it’s time to sell or buy because prices are likely to drop or pick in the charts. The MACD Divergence indicator can help you locate the top and bottom of the market. This indicator finds Regular divergence for pul
Volume Profile Pro 指标 该指标是 Volume Profile Pro 工具,用于分析“在哪个价格水平交易最活跃”。它具有以下增强功能: 显示模式 (Display Modes) Volume Profile (标准): 显示每个价格区间的总交易量 (Total Volume),以识别关键的支撑和阻力区域。 Delta / Money Flow: 显示买卖压力 (Buy vs Sell) 之间的“差值”,以判断谁在该价格控制市场。可选择显示成交量或资金流 (Money Flow)。 计算模式 (Calculation Modes) Pro 版本的一大亮点是选择时间范围的灵活性: Fixed Mode (固定模式): 设置固定的回溯蜡烛数量(例如最近 100 根)。 Dynamic Mode (动态模式 - 特色功能): 图表上会出现一条垂直线。您可以用鼠标将其 拖动 到图表上的任何位置,指标将立即计算从该点到现在的分布图。这使得分析特定的波段或趋势变得非常容易。 关键水平 (Key Levels) POC (Point of Control - 控制点): 延伸的红
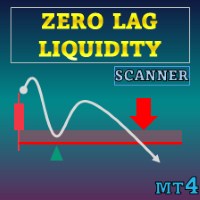
特别优惠 : ALL TOOLS ,每个仅 $35 ! 新工具 在 第一周 或 前 3 笔购买 期间为 $30 ! MQL5 上的 Trading Tools 频道 :加入我的 MQL5 频道以获取我的最新消息 Zero Lag Liquidity 基于较低时间框架的影线剖面和高成交量影线绘制流动性区域。对于每根异常K线,指标会在影线内部构建成交量直方图,找到局部控制点(POC),并将该价格渲染为水平。随后与这些水平的交互可触发标签、突破信号,以及基于价格对此等水平反应的简易趋势状态。
查看更多 MT5 版本: Zero Lag Liquidity MT5 Scanner 查看更多 MT4 版本: Zero Lag Liquidity MT4 Scanner 查看更多产品: All P roducts 概念 高成交量长影线:具有异常长的上/下影线且成交量激增的蜡烛,被选为潜在的对向流动性事件。 影线内直方图:在所选低时间框架上对影线进行分段;按分箱汇总成交量以定位 POC,该点成为流动性水平。 交互与状态:指标跟踪对水平的上破/下破与拒绝,随后相应

Did You Have A Profitable Trade But Suddenly Reversed? In a solid strategy, exiting a trade is equally important as entering.
Exit EDGE helps maximize your current trade profit and avoid turning winning trades to losers.
Never Miss An Exit Signal Again
Monitor all pairs and timeframes in just 1 chart www.mql5.com/en/blogs/post/726558
How To Trade You can close your open trades as soon as you receive a signal
Close your Buy orders if you receive an Exit Buy Signal. Close your Sell orders if

Quantum Arrow is a powerful Non-Repainting indicator specifically designed for the XAUUSD M15 timeframe, though it works effectively on any symbol and any timeframe. The indicator includes many useful features such as alerts, popups, and push notifications, offering flexibility for traders to adjust its values according to their preferences. Its price is highly affordable compared to the value and quality of the signals it provides. For any questions or support, please feel free to contact. Than

"IF YOU'RE LOOKING UNIQUE TRADING INDICATOR… AT AN AFFORDABLE PRICE… YOU'VE COME TO THE RIGHT PLACE!" Additional bonus: You get the Forex Trend Commander Indicator absolutely free! Successful traders can turn any not-so-good trading system into a profitable one by using proper money management! With two built-in systems DayTradingArrow v1 generates a high percentage of successful trades. The indicator gives an incredible advantage to stay on the safe side of the market by anyone who uses it.
B

50% off. Original price: $60 Support and Resistance zones indicator for MT4 is a multi-timeframe panel and alert that finds support and resistance zones and pivot points for all timeframes of MetaTrader 4 and gives alert when price has interaction with them. Download demo version (works on GBPUSD, EURJPY and NZDUSD symbols) Read the full description of scanner parameters in the blog page . Many unique features in one indicator:
Integrating support and resistance zones and pivot points in one i

2 copies left at $65, next price is $120
Scalper System is a user-friendly indicator designed to detect market consolidation zones and anticipate breakout movements. Optimized for the M1 or M15 timeframe, it performs best on highly volatile assets like gold (XAUUSD). Although originally designed for the M1 or M15 timeframe, this system performs well across all timeframes thanks to its robust, price action-based strategy.
You can visually backtest the indicator to evaluate the accuracy of its si

After your purchase, feel free to contact me for more details on how to receive a bonus indicator called VFI, which pairs perfectly with Easy Breakout for enhanced confluence!
Easy Breakout is a powerful price action trading system built on one of the most popular and widely trusted strategies among traders: the Breakout strategy ! This indicator delivers crystal-clear Buy and Sell signals based on breakouts from key support and resistance zones. Unlike typical breakout indicators, it levera

Huge 70% Halloween Sale for 24 hours only!
After purchase, please contact me to get your trading tips + more information for a great bonus!
Lux Trend is a professional strategy based on using Higher Highs and Lower Highs to identify and draw Trendline Breakouts! Lux Trend utilizes two Moving Averages to confirm the overall trend direction before scanning the market for high-quality breakout opportunities, ensuring more accurate and reliable trade signals. This is a proven trading system u

** All Symbols x All Timeframes scan just by pressing scanner button ** *** Contact me to send you instruction and add you in "M W Scanner group" for sharing or seeing experiences with other users. Introduction: Double Top(M) and Double Bottom(W) is a very repetitive common type of price reversal patterns. Double Top resembles M pattern and indicates bearish reversal whereas Double Bottom resembles W pattern and indicates a bullish reversal that they have high win rate. The M W Scanne
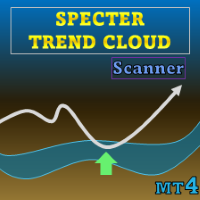
特别优惠 : ALL TOOLS ,每个仅 $35 ! 新工具 将以 $30 的价格提供 第一周 或 前 3 笔购买 ! Trading Tools Channel on MQL5 :加入我的 MQL5 频道以获取我的最新消息 Specter Trend Cloud 是一款基于移动平均的趋势可视化工具,用于突出市场方向和关键回测机会。通过将自适应平均线与波动率调整结合,它会生成一个随趋势变化而翻转的彩色“云”,并跟踪价格在趋势进行中与短期平均线的互动。
查看更多 MT5 版本: Specter Trend Cloud MT5 Scanner 查看更多 MT4 版本: Specter Trend Cloud MT4 Scanner 查看更多产品: All P roducts Key Features 多均线核心引擎
可选 SMA、EMA、SMMA (RMA)、WMA 或 VWMA。指标使用两条均线:一条短期均线(用户自定义长度)和一条长度为其两倍的长期均线。 波动率调整偏移 两条均线都会根据趋势方向按 ATR(200) 进行偏移。此调整使云层反映更

Read detailed blogpost with screenshots here: https://www.mql5.com/en/blogs/post/764306 Note: This is the MT4 only version. Get the MT5 version here: https://www.mql5.com/en/market/product/150789
Features Kalman smoothing to reduce market noise. Supertrend bands for trend direction. Color-coded dots and arrows for quick reading. Arrow signals for trend continuation. Custom Timeframe for drawing bands Alerts for trend changes. Adjustable inputs for different styles.
How to Use
Green dots = bul

或者 ( BD% ) 这是一个波动率指数,以百分比而不是点来衡量波动率。 BD% 的想法是根据在 0% 和 100% 之间移动的经典标准偏差 (CSD) 创建一个索引。
您可以使用 BD% 来比较同一证券在不同时间段或不同时间范围内的波动率。此外,您可以使用 BD% 以百分比而非点数来比较不同市场中不同证券之间的波动率。
如何使用“BD%”
如果 BD% 低于 90%,然后向上越过该水平,则表明价格可能在区间内波动。 如果 BD% 高于 90%,然后向下穿过该水平,并且价格已经高于其简单移动平均线,则这是新的上升趋势开始的迹象。随着 BD% 进一步下行,波动性和趋势强度正在增加。当 BD% 为 0% 时,这意味着波动率处于最高值。 如果 BD% 高于 90%,然后向下穿过该水平,并且价格已经低于其简单移动平均线,则这是新的下降趋势开始的迹象。随着 BD% 进一步下行,波动性和趋势强度正在增加。当 BD% 为 0% 时,这意味着波动率处于最高值。
要了解有关 BD% 的更多信息,请从此处阅读用户手册: https://www.mql5.com/en/blogs/post/718

Introducing Order Blocks Breaker , a brand-new way to identify and leverage order blocks in your trading strategy. After developing multiple order block tools with unique concepts, I’m proud to present this tool that takes things to the next level. Unlike previous tools, Order Blocks Breaker not only identifies order blocks but also highlights Breaker Order Blocks —key areas where the price is likely to retest after a breakout. MT5 - https://www.mql5.com/en/market/product/124102/ This tool inco

FutureForecast is one of the few indicators looking into the future, or rather calculating the current candle's High and Low price values.
Advantages of the indicator no repainting works on any timeframes works with any trading instruments perfectly suitable for scalping and trading binary options
Parameters alert - enable/disable alerts about signals. Enabled by default.
Parameters (Colors) FutureHigh - estimated High price line color. FutureLow - estimated Low price line color.
Recommendat

Turbo Trend technical analysis indicator, which determines the direction and strength of the trend, and also signals a trend change. The indicator shows potential market reversal points. The indicator's intelligent algorithm accurately determines the trend. Uses only one parameter for settings. The indicator is built for simple and effective visual trend detection with an additional smoothing filter. The indicator does not redraw and does not lag. Take profit is 9-10 times larger than stop loss

KT Asian Breakout 指标分析亚洲交易时段的关键部分,以生成双向买卖信号,并基于价格突破的方向进行交易。当价格突破该交易时段的最高点时,会出现买入信号;当价格突破最低点时,会出现卖出信号。
注意事项
如果交易时段的范围过大,建议避免新交易,因为大部分价格走势已在该时段内完成。 如果突破K线过大,价格通常会在继续沿信号方向运行之前发生短暂回调。
功能特点 买入/卖出信号包含止损和盈利目标。 KT Asian Breakout 指标持续监测其表现,并使用第一、第二或第三盈利目标作为成功标准。 显示三个关键性能指标,包括盈亏信号、成功率和每个信号的平均点数。 如果突破K线过大,图表上会显示警告信息。
推荐设置 时间周期: 15分钟。 交易货币对: 所有 JPY 货币对。
输入参数 绘制交易时段框 : true/false 绘制止损和盈利目标 : true/false 性能分析 : true/false 显示文本分析(左上角) : true/false 成功率标准 : 第一目标 | 第二目标 | 第三目标 颜色和样式设置 : 可自定义 警报设置 : 可自定义

Multi Anchor VWAP Pro MT4 – Pure Anchored VWAP | Adaptive σ-Bands | Smart Alerts Precision VWAP anchoring, purpose-built for MetaTrader 4. One-click anchors, dynamic σ-bands or %-bands and instant multi-channel alerts—ideal for scalpers, intraday and swing traders who need institutional-grade fair-value mapping. Full User Guide – Need MT5? Click here WHY PROFESSIONAL TRADERS CHOOSE MULTI ANCHOR VWAP PRO VWAP is the institutional benchmark for fair value. This MT4 edition removes every non-anch

** All Symbols x All Timeframes scan just by pressing scanner button ** *** Contact me to send you instruction and add you in "All Divergences scanner group" for sharing or seeing experiences with other users. Introduction Divergence is a main technique used to determine trend reversing when it’s time to sell or buy because prices are likely to drop or pick in the charts. All Divergence indicator can help you locate the top and bottom of the market. This indicator finds Regular divergences for

Nas100 killer V2 (See video of how we test the indicator live) 1000% non-repaint indicator appears on current candlestick. Timeframes: M5, M15, M30, H1, H4. Works on pairs such as (NAS100, US30, SPX500, and Gold) The indicator is strictly for scalping do not hold trades for too long. Orange arrows look for selling opportunities. Light Blue arrows look for buying opportunities.

UR 成交量趨勢
UR VolumeTrend 是顯示交易量持續趨勢的最清晰的交易量指標。 與 UR TrendExhaustion 等其他指標完美配合,以發出局部頂部和底部信號。
僅限於 2 個參數 - 值越高,顯示的趨勢越長。 梯度極端顯示成交量可能耗盡以捕捉潛在的逆轉。 兩條線 - 成交量趨勢和平均值。 最大優勢:簡單且可適應所有資產。 有一個特殊的電報聊天,您可以在其中了解最新的工具更新,如果您覺得缺少什麼,也可以發送請求!
為什麼選擇 UR VolumeTrend?
所有人都會同意,成交量是把握趨勢的關鍵。 這個震盪指標是我所有交易量工具的總和,壓縮成一個易於使用的指標。 它以易於查看的方式顯示正/負音量。 後面的界面顯示音量與過去相比是否可能會耗盡 - 或者它是否會推到新的水平。
如何使用 UR VolumeTrend?
請參閱下面的描述以更熟悉它:
設置 Volume Period:值越高,它會嘗試捕捉的趨勢越大 交易量趨勢:此附加行顯示僅基於交易量的潛在反轉條目 展示
漸變界面:顯示基於過去的極值水平。 成交量主線:顯示成交量是看漲*高於 0*

Sniper Flip Zones – 精准的买卖信号系统
我设计了 Sniper Flip Zones,以在趋势或震荡市场中识别动量急剧转变的时刻,从而生成极其精准的买入和卖出信号。该系统在 XAUUSD 的 M1/M5 时间框架上表现出色,但通过可配置的参数,也可应用于任何货币对和时间框架。
加入频道以获取最新信息: https://www.mql5.com/en/channels/forexnewadvisor
核心逻辑包括:
– 在极端水平(10/90)处的随机指标反转 – 可选的 %K 和 %D 交叉 – 使用短期和长期简单移动平均线的动态趋势检测 – 避免连续同方向信号的交替逻辑
信号生成方式:
– 超买/超卖退出: 指标检测快速随机指标何时退出极端区域(高于90或低于10),通常标志着短期反转。 – 交叉过滤器: 可启用 %K/%D 交叉以获得更强的确认(可选)。 – 趋势对齐: 系统使用双移动平均线过滤器(可配置)检测看涨或看跌趋势偏差,有助于避免逆势信号。 – 交替逻辑: 为减少过度交易,一旦发出买入或卖出信号,下一个信号必须是相反方向。 – 所有计算均基

Note : The slow loading of the indicator issue has been addressed . This new version loads fast and does not slow the platform.
Version 1.3 : We have updated the indicator to include an historical bar scanning option . So instead of scanning all bars in the history (which can make the indicator slow sometimes ) , you can select the maximum number of bars it can scan which can increase the performance and make the indicator faster.
This indicator scans the 1-3 Trendline pattern . The indicato
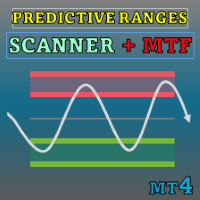
Special offer : ALL TOOLS , just $35 each! New tools will be $30 for the first week or the first 3 purchases ! Trading Tools Channel on MQL5 : Join my MQL5 channel to update the latest news from me 在当今动荡的金融交易环境中,准确识别支撑位和阻力位对于交易者做出明智决策至关重要。 Predictive Ranges Scanner Multi-TF 是一款高级工具,旨在帮助交易者对多种货币对和不同时间周期进行扫描并预测未来交易区间,从而有效且精准地识别市场趋势。 See more MT5 version at: Predictive Ranges MT5 Scanner Multi TF See more products at: All P roducts 主要特点 1. 识别潜在支撑和阻力位 Predictive Ranges Scanner利用预测性的

棘手的发现和频率稀缺是最可靠的交易方案之一。该指标使用您喜欢的振荡器自动查找并扫描常规和隐藏的发散。 [ 安装指南 | 更新指南 | 故障排除 | 常见问题 | 所有产品 ]
容易交易
发现常规和隐藏的分歧 支持许多知名的振荡器 根据突破实现交易信号 显示适当的止损和获利水平
可配置的振荡器参数 可自定义的颜色和尺寸 按条形过滤大小差异 实现绩效统计 它实现了电子邮件/声音/视觉警报 为了提供广阔的市场前景,可以使用不同的振荡器在同一张图表中多次加载该指标,而不会产生干扰。该指标支持以下振荡器: RSI CCI MACD OSMA 随机 动量 很棒的振荡器 加速器振荡器 威廉姆斯百分比范围 相对活力指数 由于差异可能会扩大很多,尤其是在外汇市场中,因此该指标产生了转折:它在等待交易突破之前等待donchian突破确认差异。最终结果是带有非常可靠的交易信号的重新粉刷指示器。
输入参数
幅度:用于寻找差异的之字形周期
振荡器-选择要加载到图表的振荡器。 突破期-交易信号的突破期,以柱为单位。 发散类型-启用或禁用发散类型:隐藏,常规或两者。 最小散度单位为条形-最小散度单位为条形

Currency Strength Gauge incicator
The currency strength gauge is an indicator to measure of the strength or weakness of currencies in the Forex market. Comparing the strength of currencies in a graphic representation will lead to a good overview of the market and its future trends. You will see in a graphic chart both the strength of the currencies and their correlation, and this will help you in your decisions to get better trades. -To easy detection of over Overbought and Oversold points,

Discount: It will be $39 for a week or for 2 purchases! Contact me to send you instruction and add you in group.
QM (Quasimodo) Pattern is based on Read The Market(RTM) concepts. The purpose of this model is to face the big players of the market (financial institutions and banks), As you know in financial markets, big traders try to fool small traders, but RTM prevent traders from getting trapped. This style is formed in terms of price candles and presented according to market supply and dem

目前8折优惠!
对任何新手或专家交易者来说都是最好的解决方案!
这个指标是一个经济实惠的交易工具,因为我们结合了一些专有功能和新的公式。
高级累积货币量指标专门针对主要的28个外汇对,并在所有的时间框架内工作。它是一个新的公式,在一个图表上提取澳元、加元、瑞士法郎、欧元、英镑、日元、新西兰元和美元的所有货币量(C-Volume)。这在交易中是一个很大的优势。成交量交易者会知道如何使用它。如果你是新手,那么学习如何阅读极端值,并将其加入你的交易武库。
把C-Volume看作是一个盾牌,而不是一把枪。
在主图上会显示一个警告标志,警告你进入错误的交易。
这不是常用的简单的交易量。外汇市场被扫描,每个货币的交易量被提取并累积到C-Volume。我们现在可以看到哪些货币有最高或最低的交易量。我们可以在一张图表上看到所有28个外汇对的情况。如果欧元有一个强大的峰值,检查欧元对的可能交易。如果英镑有一个强大的峰值,那么检查英镑对。
建立在新的基础算法上,它使识别潜在的转折点更加容易。这是因为它以图形方式显示货币的C-Volume峰值。这些功能的设计是为了帮助并使你远离不良交易,指导
The AX Forex Indicator MT4 is a sophisticated trading tool designed to provide traders with a comprehensive analysis of multiple currency pairs. This powerful indicator simplifies the complex nature of the forex market, making it accessible for both novice and experienced traders. AX Forex Indicator uses advanced algorithms to detect trends, patterns and is an essential tool for traders aiming to enhance their forex trading performance. With its robust features, ease of use, and reliabl

Scalpetronix 指标 — Scalpetronix 机器人的信号核心 该指标实现了 Scalpetronix 智能交易系统所依赖的算法和信号。机器人的所有入场点都是基于这些计算生成的:指数移动平均线 (EMA) 的组合、通过 ADX 的趋势过滤、通过 ATR 的波动率归一化以及K线结构分析。 指标优势 基于多层 EMA 系统(快线和慢线)并带有动态阈值; 通过 ADX 过滤去除弱信号; 通过 ATR 考虑市场波动性,使灵敏度适应不同市场阶段; 分析 K 线结构(买入时使用 HH/HL 模型,卖出时使用 LH/LL 模型); 通过多层线条和区域填充可视化信号,并在入场点绘制箭头。 工作算法 EMA 与动态阈值计算
sep(t) = max(Point, 0.1 * ATR(t))
— 买入条件: EMA_fast(t) > EMA_slow(t) + sep(t)
— 卖出条件: EMA_fast(t) < EMA_slow(t) - sep(t) K线结构验证
— 买入: High(t-1) > High(t-2) 且 Low(t-1) > Low(t-2)
— 卖出: H

该指标是一款多功能技术分析工具,基于自适应指数移动平均线(EMA)与通过真实波动幅度均值(ATR)计算的波动率过滤器相结合而构建。其设计目的是精确识别当前价格方向,突出潜在趋势转折的关键区域,并直观显示可能的反转区域。 算法的核心是通过两层波动率构建动态趋势带:外层和内层。外层边界起到强突破信号的作用,而内层水平则在指数均线斜率发生变化时捕捉价格结构的温和反转。这种组合确保了指标在保持对市场噪音抗干扰性的同时,也具有较高的灵敏度。 图形表现中加入了对比鲜明的箭头标记,用于提示趋势的变化。该指标不会重绘信号,这使其在交易策略和风险管理系统中成为可靠的过滤工具。 优势 多层波动率分析 —— 通过使用内外ATR通道,既能捕捉剧烈突破,也能识别趋势的逐渐转向。 自适应平滑 —— 内置可调系数的EMA平滑算法,能够适应不同的市场环境。 无重绘 —— 信号在出现时固定不变,确保历史分析的可靠性。 清晰可视化 —— 明确的趋势线与箭头标记,可即时评估市场状态。 灵活配置 —— 广泛的参数设置,可适配各种时间周期和金融工具。 通用应用 —— 既可用于趋势跟随策略,也可作为逆势过滤器。 指标参数 算法

ZigZag 指标的多货币和多时间框架修改。 显示市场的当前方向、上次走势的高度、本次走势中的柱数以及锯齿形调整浪(水平线)的前一个点的突破。 这是 MTF 扫描仪。
您可以在参数中指定任何所需的货币和时间范围。 此外,当之字折线改变方向或突破前一点时,面板可以发送通知。 通过单击带有句点的单元格,将打开该符号和句点. 指标——连接关键低点和高点以显示趋势线
参数 Depth — 如果最后一根蜡烛的偏差小于(或大于)前一根,则 Zigzag 将不会绘制第二个最大值(或最小值)的烛台的最小数量; Deviation — 锯齿形形成局部顶部/底部的两个相邻烛台的最高点/最低点之间的最小点数; Backstep — 局部高点/低点之间的最小烛台数量; Bars to calculate ZZ — 历史中用于查找 ZigZag 点的柱的数量. ZZ-wave info — 表格中显示有关波形的哪些信息 — 仅当前波形或当前波形 + 上一个波形; Highlight the symbol when all periods are in the same direction — 方向时突出显

The Missing Edge You Need To Catch Breakouts Like A Pro. Follow a step-by-step system that detects the most powerful breakouts!
Discover market patterns that generate massive rewards based on a proven and tested strategy.
Unlock Your Serious Edge
Important information here www.mql5.com/en/blogs/post/723208
The Reliable Expert Advisor Version
Automate Breakout EDGE signals using "EA Breakout EDGE" Click Here Have access to the game changing strategy that will take your trading to the next l

The only one of its kind square 9 indicator that corresponds to the real situation on Gannzilla! The indicator calculates price levels by Square 9 and dates by Square 9. All price and time levels are 100% consistent with the location on Square 9 (Gannzila). This tool will be a great solution for determining the price and time levels using the methods of the legendary trader William Delbert Gann.

指标在指定区域显示水平音量分布 (BOX) 和最大音量 (POC).
产品特点 。 1. 您可以使用刻度或仅使用价格。 2. 自适应网格间距 (M1-MN) 。 3. 自适应大容量(Median)搜索步骤取决于框大小。 4. 框线和按钮的自动变色龙颜色。 5. 多个框,易于创建和删除 。 6. 70% 体积区域(在设置中启用) 。 7. 触碰最大水平音量线有提示 (POC) 。 8. VWAP 。 9. 控制面板 。
使用成交量配置指标探索市场。 我是为自己做的,但现在你也可以使用它。
主要设置 。 Calc Histo Mode – 直方图计算方法 (Market Profile – 按价格计算, Tick Volume Profile – 按刻度计算) 。 Mode Step In Pips – 按点计算中线 。 Vertical Step – 直方图的垂直步长(以点为单位的线之间的距离) 。 Data Source – 自动选择报价时间范围(最多 H1 从 M1 获取报价) 。 Touch First Bar - 打开以使扩展 POC 线在第一次触摸时停止 。 Hide B
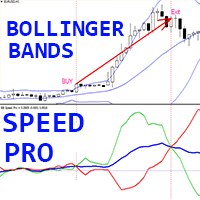
独特的趋势加密货币外汇指标“布林带速度专业版”,适用于 MT4,无需重绘。
- 该指标基于物理方程计算。 - 速度是标准布林带的一阶导数。 - 布林带速度专业版指标显示布林带中线和布林带边界方向变化的速度。 - 默认情况下:蓝线表示布林带中线速度,红线表示下边界速度,绿线表示上边界速度。 - 建议在趋势策略中使用 BB Speed Pro,如果 BB 中线速度值小于 0:趋势下降,如果值大于 0:趋势上升。 - 您可以考虑以下交易入场点: - 当蓝线高于 0 且绿线向上穿过蓝线时,开仓买入。 - 当蓝线低于 0 且红线向下穿过蓝线时,开仓卖出。 - 指标内置手机和电脑端警报。 - 指标包含信息点差掉期显示 - 它显示与其关联的外汇对的当前点差和掉期。 - 显示屏还显示账户余额、净值和保证金。 - 信息点差掉期显示可放置在图表的任意位置: 0 - 左上角,1 - 右上角,2 - 左下角,3 - 右下角。
点击这里查看高质量的交易机器人和指标! 这是仅在 MQL5 网站上提供的原创产品。

---- Brand New Strategy. Three Month Rent is $30. ONE YEAR RENT ONLY $50. FREE EURUSD VERSION AVAILABLE UNDER << Forecast System Gift >>. NO NEED FOR BACKTEST! Link to the FREE version --> https://www.mql5.com/en/market/product/110085?source=Site --- This is a simple strategy based on BREAKOUT and FIBONACCI levels. After a breakout, either, the market: - continues the move directly to the 161, 261 and 423 levels, or - retraces to the 50% level (also called a correction) and thereafter continues

CS ATR FIBO CHANNELS MULTI TIMEFRAME
Additional tool to trade with Cycle Sniper Indicator.
Cycle Sniper : https://www.mql5.com/en/market/product/51950 Indicator Draws Channels based on: - Cycle Sniper Price and Moving Averages - ATR Deviations - Fibonacci Retracement and Extensions
Features: - Multi TimeFrame - Full alert and Notification options. - Simple Settings - Finds the trend change or extreme reversals.
Inputs: - Arrow Mode: ATR Levels or Median Line If Median Line is selected ind

此指标适用于实时图表,不适用于测试器。 PRO Trend Divergence 指标是一款先进的技术分析工具,专注于检测 趋势延续背离 ,这是一种表明当前趋势可能会持续的信号。与传统指标强调趋势反转不同,这款工具帮助交易者识别趋势依然强劲的市场状态,即使在短暂回调或小幅调整时也是如此。 趋势延续背离 出现在价格沿趋势方向移动时(上升趋势中的更高低点或下降趋势中的更低高点),但所选指标却出现背离,确认趋势可能继续。 PRO Trend Divergence 指标使交易者能够自信地跟随趋势,减少过早退出的风险。 特点与优势 多指标支持
支持 MACD、RSI、Stochastic、CCI、Momentum、OBV、VW-MACD、CMF 和 MFI。 图表上的可视信号
显示背离线条,并支持颜色和样式的自定义。 关键枢轴点集成
利用关键的高点和低点来优化信号,减少噪音。 灵活高效
提供信号确认、筛选和时间周期选择的自定义参数。

"The Squeeze indicator attempts to identify periods of consolidation in a market. In general the market is either in a period of quiet consolidation or vertical price discovery. By identifying these calm periods, we have a better opportunity of getting into trades with the potential for larger moves. Once a market enters into a "squeeze," we watch the overall market momentum to help forecast the market direction and await a release of market energy." Modified TTM Squeeze Indicator is a modifica

该指标检查不同时期分形的价格结构,以确定市场中可能的反转点,从而为已经具有基本或技术估值模型的仓位交易者提供时机。与它的弟弟 Reversal Fractals不同 ,该指标不会因为所选时期而错过反转,并且会以之字形方式找到反转分形,而忽略那些没有足够动量来引发持续价格波动的反转。 [ 安装指南 | 更新指南 | 故障排除 | 常见问题 | 所有产品 ] 转折点可以开始长期趋势 指示器不重涂
它实现了各种警报 可自定义的颜色和尺寸 该指示符是无功或滞后信号,因为分形是奇数个条形的地层,是中间地带中最高或最低的条形,并且指示符在分形中的所有条形都闭合时绘制。但是,具有预先设定的方向偏差的交易者会发现该指标非常有用,可以提早进入切入点。 该指标既不是下探信号指标,也不是完整的交易系统。请不要这样评价或审查它。
输入参数 最小分形数:分形上的最小条形数。必须为奇数,例如3、5、7、9、11、13,... 最大分形:分形上的最大条形数量。必须为奇数,例如3、5、7、9、11、13 ...
最大历史柱数:指标加载时评估的过去柱数。
颜色:自定义箭头和线条的颜色和大小。 警报:启用或禁用各

Think of the rarest pair you can think of. And I assure you that this indicator can compute it's strength. This Currency Meter will literally calculate any currency pairs, either it is the Major Pairs, Metals, CFD's, Commodities, Crypto Currency like Bitcoin/BTC or Ethereum/ETH and even stocks. Just name it and you will get it! There is no currency pair this Currency Meter can solve. No matter how rare or exotic is that currency, it will always be solved by this Currency meter which on a real-ti

"Breakout Buy-Sell" 指标旨在根据不同市场交易时段(东京、伦敦和纽约)的价格突破,识别并突出潜在的买卖机会。该指标帮助交易者清晰地可视化买卖区域,以及止盈(TP)和止损(SL)水平。 使用策略 该指标可以按以下方式使用: 初始设置 :选择交易时段并调整 GMT 偏移。 市场可视化 :观察每个交易时段开始时绘制的突破箱。这些箱子表示该期间的最高点和最低点。 买卖信号 :价格突破箱子的最高点被认为是买入信号。价格突破最低点被认为是卖出信号。 风险管理 :使用 TP1、TP2、TP3 和 SL 水平来管理头寸。TP 水平设计用于不同的利润目标,而 SL 确保对不利走势的保护。 应用策略 为了最大限度地利用此指标,建议采用以下策略: 伦敦时段 :选择伦敦时段,并根据您的经纪商位置调整 GMT 偏移。 目标设置 :根据当前市场波动性定义 TP 和 SL,或允许每个货币对的特定建议。 主动监控 :观察突破箱,等待市场条件下的买入或卖出信号。 警报管理 :设置警报,当价格达到关键水平时通知您,这样就不需要不断监控图表。 外部参数说明 Margin :在突破水平上添加的点数空间,以建

这是一个交易时段指标,可以显示四个交易时段的所有级别(开盘价-最高价-最低价-收盘价)。 该指标还可以预测会话级别。 会话可以用线条或矩形(空的或填充的)绘制,线条可以延伸到下一个会话。 您可以通过按热键(默认为“1”、“2”、“3”、“4”)轻松隐藏/显示每个会话.
您可以看到 ASR(平均会话范围)线(默认热键“A”) 。 这与 ADR 计算类似,只是它是根据最后一个 X 交易时段计算的,这使您可以看到当前(和之前)交易时段的潜在范围(今天价格可以移动多远)。 平均值的计算方式为之前会话的总和除以会话数(参数“ASR 周期(计算平均值的会话数)”),每个会话都有自己的 ASR 值。
该指标计算并绘制未来的会话及其大小。 正确识别报价历史记录中的漏洞。 它还可以在每个会话开始时绘制垂直分隔符。
指标自动确定图表的配色方案。
当价格触及会话水平或价格突破已关闭会话指定距离时,它还会发送警报。 可以禁用每个会话的警报。
参数“如果其他会话启动则停止会话”(热键“S”)允许您停止过时的会话,并在新会话中断时接收警报。
该指标可以绘制枢轴水平并就其发送警报。 这些级别是根据之前

MT5版本 | FAQ Owl Smart Levels Indicator 是一個完整的交易系統,包含 Bill Williams 的高級分形、構建正確的市場波浪結構的 Valable ZigZag 以及標記準確入場水平的斐波那契水平等流行的市場分析工具 進入市場和地方獲利。 策略的详细说明 指示灯使用说明 顾问-贸易猫头鹰助手助理 私人用户聊天 ->购买后写信给我,我会将您添加到私人聊天中,您可以在那里下载所有奖金 力量在於簡單!
Owl Smart Levels 交易系統非常易於使用,因此適合專業人士和剛開始研究市場並為自己選擇交易策略的人。 策略和指標中沒有隱藏的秘密公式和計算方法,所有策略指標都是公開的。 Owl Smart Levels 允許您快速查看進入交易的信號,突出顯示下訂單的水平並向您發送有關已出現信號的通知。 優點很明顯: 清楚地顯示主要和更高時間框架的趨勢方向。 指示儀器信號的出現。 標記開單、止損設置和固定利潤的水平。 沒有多餘的,只有必要的結構! ZigZag 表示全球趨勢的方向,因此也表示貿易方向。 市場反轉點的短線清楚地表明在什

VeMAs 是一款创新型交易工具,旨在通过分析交易量动态和市场结构来改进您的交易策略。 无论您是初学者还是经验丰富的交易者,VeMAs 都能为您提供优势。 VeMAs 指示器仅售 50 美元。指示器原价为 299 美元
限时优惠。 购买后请联系我获取个性化奖励!您可以获得完全免费的超酷实用工具( VeMAs Utility MTF ),该工具可使 VeMAs 指标具有多重时间框架,请私信我!
Version MT5
Here are some blogs on the VeMAs indicator
市场容量和结构是需要关注的几个主要方面。
VeMAs 使用先进的算法评估交易量变化和价格走势。它专为追求准确性和效率的交易者设计。
该指标分析资产交易量的价格行为,并确定理想的入市点。
有了准确的切入点,您就能领先于潜在的变化。
VeMAs 应用选项和一些观察结果。这将帮助您了解如何使用该指标,即使您是第一次使用。--- https://www.mql5.com/zh/blogs/post/761144
主要功能:
成交量动量计算: 通过评估价格变化与成交量之间的关系,该
G-Labs Market Maker Dashboard - Exclusive Seasonal Offer Elevate your trading with the original G-Labs Market Maker Dashboard, available for a limited time at just $70 USD. Ideal for starter traders, this dashboard has been enhanced with new features and now includes a comprehensive training video. This indicator is for people trading the market makers method and is the entry level dashboard for that strategy is available for both mt4 and mt5. its a market scanner in real time showing peak

What is the Volume Weighted Average Price (VWAP)? The volume weighted average price (VWAP) is a trading benchmark used by traders that gives the average price an instrument has traded at throughout the day, based on both volume and price. It is important because it provides traders with insight into both the trend and value of the instrument.
What is the Difference between VWAP and AVWAP? While VWAP is having as starting point the beggining of the day,week,month etc. in the AVWAP you can plac
If you can’t beat them, join them. Trade where institutions seek liquidity. Bank Levels Tracker identifies institutional price zones where stop-hunts commonly occur. These zones sit just beyond obvious swing highs and lows where retail stops cluster.
Levels are plotted in real time and never repaint. Instant alerts notify when price reaches a bank level. Built for traders who trade bank levels directly, or use them as confluence to time trade entries at better prices in regular strategies.
How

MonsterDash Harmonic Indicator is a harmonic pattern dashboard. It recognizes all major patterns. MonsterDash is a dashboard that displays all detected patterns for all symbols and (almost) all timeframes in sortable and scrollable format. Users can add their own user defined patterns . MonsterDash can open and update charts with the pattern found.
Settings MonsterDash's default settings are good enough most of the time. Feel free to fine tune them to your needs. The color settings are for thos


该指标背后的想法是在所有时间范围内找到穆雷水平并将它们组合成组合水平,其中包括基于强穆雷水平 (+2, +1, 8, 4, 0, -1, -2). 时间范围越短,您立即看到组合级别的机会就越大。 它将以颜色突出显示。 当您将光标悬停在任何数字上时,将显示该级别所属的时间范围的提示。 但您将始终将当前时间范围视为最左边的时间范围。 智能警报可帮助您传达与信号组合级别相关的价格。
视频中的仪表板不是声明的功能,也不包含在此处! 仍在开发中。
交易建议。 不建议在没有额外技术分析的情况下交易组合水平的反弹。 从蓝色和红色水平反弹的概率较高。 价格被磁力吸引至组合水平,但价格尚未对其进行测试(128 根蜡烛前)。在这种情况下,建议使用趋势策略,并采取水平取向(高/低一个水平)。 当价格向红色或蓝色水平移动时,不要在沿途反弹时交易黄色(这会破坏势头)。 强烈建议初学者在组合水平反弹时进行交易,除非有相反的组合水平。 最好在趋势方向反弹时进行交易。
在博客链接阅读更多内容 - Murrey Math Trading with UPD1 .
设置说明。
主要设置。 Period

PowerBall 信号是基于使用支撑/阻力区域理念的买入/卖出信号指标。该指标根据支撑/阻力区域检测特殊反转模式,并在图表上提供这些信号。该指标的主要思想是使用 MTF(多时间框架)分析,并根据当前和下一个更高时间框架的水平提供信号。这种方法可以预测任何市场上可能的价格逆转,无论是货币、金属、指数甚至加密货币。 事实上,您绝对可以在任何市场进行交易。 除了反转信号之外,该指标还提供趋势延续信号,让您在交易过程中紧跟趋势。该指标对外汇和二元期权交易者都有帮助。您可以选择是否要在 NON-MTF 或 MTF 模式下使用该指标。您还可以选择要从中获取数据以生成信号的源时间范围。 购买后请联系我以获得我的交易提示和丰厚奖金! 祝您交易愉快、盈利!

THE ONLY CURRENCY STRENGTH INDICATOR THAT IS BASED ON PRICE ACTION. DESIGNED FOR TREND, MOMENTUM & REVERSAL TRADERS
This indicator reads price action to confirm trend and strength . Advanced multi-currency and multi-time frame indicator that shows you simply by looking at one chart, every currency pair that is trending and the strongest and weakest currencies driving those trends.
For full details on how to use this indicator, and also how to get a FREE chart tool, please see user manual HERE

The Renko_Bars_3in1 is designed for plotting 3 types of Offline Renko charts. Standard Renko Bar (the reversal bar is twice the size of the bar). Renko Range Bar (the size of all bars is the same). Renko Bars with the ability to adjust the size of the reversal bar. Attention : The demo version for review and testing can be downloaded here . Note . A chart with the M1 period is necessary to build an offline chart. When the indicator is attached to a chart, the offline chart is opened automaticall

ADR 警報儀表板一目了然地向您顯示當前價格相對於其正常平均每日範圍的交易位置。當價格超過您選擇的平均範圍和高於它的水平時,您將通過彈出窗口、電子郵件或推送獲得即時警報,以便您可以快速跳入回調和反轉。破折號旨在放置在空白圖表上,只需坐在背景中並在達到水平時提醒您,因此您無需坐下來觀看甚至看! 此處提供 MT5 版本: https://www.mql5.com/en/market/product/66316
新:現在還向您顯示平均每周和每月範圍,並提醒他們!
獲取在您的圖表上繪製水平的 ADR 反轉指標: https://www.mql5.com/en/market/product/62757
大約 60% 的時間價格在其正常的平均每日範圍 (ADR) 內交易並推高這些水平通常是價格急劇波動的指標,通常會出現回調(獲利了結)走勢。您可以通過交易從每日範圍的頂部或底部回落到最近的支撐位或阻力位來利用這些急劇波動。
收集了超過 20 年的歷史數據,以找出主要外匯對和一系列交叉盤的價格超出特定 ADR 水平的平均百分比。該數據表明價格僅在 3% 的時間內超過其 ADR 的 200%,

Gold Flux Signal – 针对 XAUUSD 的非重绘信号指标
专为清晰信号执行而设计 – Gold Flux Signal 专为在 XAUUSD 上提供清晰、稳定的进场信号而开发
– 专注于趋势跟随和突破策略,避免图表杂乱和误信号
– 此指标仅基于 已收盘的蜡烛图 生成信号,确保信号真实可靠
– 最适用于 M1、M5 和 H1 时间周期
稳定的可视化信号 – 一旦信号生成,它将固定在图表上,不会闪烁或消失
– 箭头直接绘制在图表上:
• 洋红箭头 = 买入信号
• 青色箭头 = 卖出信号
– 所有箭头 不会重绘 ,只基于确认后的市场行为,而非预测
基于自适应价格行为的逻辑
– 信号逻辑基于以下内容生成:
• 实时波动范围测量
• 使用修改后的 WPR 指标确认动量变化
– 可识别趋势延续或反转点
– 信号 不会连续频繁生成 ,而是通过过滤减少噪音,强调高概率交易时机
– 特别适用于活跃市场阶段,尤其在 M1 与 M5 时间框架中表现出色
智能警报系统
– 每个信号生成时将同步触发警报
– 通过弹出窗口提示交易者及时反应,即使在
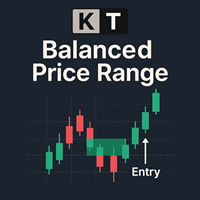
KT Balanced Price Range 指标会高亮显示两个连续相反的 公平价值缺口 (FVG) 的重叠区域。这个概念被称为平衡价格区(BPR),在价格行为交易者中非常受欢迎,尤其是使用聪明资金理念(SMC)和内部圈交易者(ICT)方法的交易者。 交易者通常使用这些 BPR 区域来寻找高概率的交易机会,特别是在回调或趋势延续过程中。BPR 区域往往是市场可能反转、继续或突破的关键点,是把握进出场时机的重要位置。
功能特点
从零开始开发,仅基于经过验证的 FVG 重叠来识别 BPR 区域,确保交易信号质量。 可自定义的 BPR 百分比阈值,用于过滤无效区域,专注于高价值交易点位。 为每个交易机会明确设定止损与盈利目标,基于风险回报比,避免猜测。 内置“最大利润”线,可直观显示每个信号的最高收益,便于绩效跟踪。 完全可定制的视觉外观,包括颜色与线条粗细,可完美融合任意图表样式。 支持所有标准的 MetaTrader 警报方式,确保不错过任何交易信号。
多头 BPR 当一个空头 FVG 之后迅速出现多头 FVG,并且价格保持在重叠区域附近时,就形成了多头 BPR。
空头 BPR

TDI Multi Timeframe Scanner:
This Dashboard indicator uses the TDI (Trader's Dynamic Index) Indicator to find best trades. Read detailed How to Use Guide: https://www.mql5.com/en/blogs/post/758252
Extra indicators also available in above post.
Checks for: - SharkFin Pattern Free indicator for SharkFin: https://www.mql5.com/en/market/product/42405/ - TDI Trend: Strong/Weak Trend Up/Down - TDI Signal: Strong/Medium/Weak Signal for Buy/Sell - Consolidation - Overbought/Oversold - Volatility Ban

BUY INDICATOR AND GET EA FOR FREE AS A BONUS + SOME OTHER GIFTS! ITALO TRIANGLE INDICATOR is the best triangle indicator ever created, and why is that? Using Geometry and Fibonacci the Indicator works on all time-frames and assets, indicator built after 7 years of experience on forex and many other markets. You know many triangle indicators around the internet are not complete, does not help, and it's difficult to trade, but the Italo Triangle Indicator is different , the Italo Triangle Indi

每位购买 Scalping signals M1 指标的用户,都将免费获赠一款基于该指标信号自动交易的EA机器人。 Scalping signals M1 — M1趋势剥头皮完整进场系统 Scalping signals M1 将图表变成清晰的操作地图:
彩色趋势通道显示市场方向,箭头提示潜在进场点。
只需跟随通道方向和箭头即可,即使是新手也能轻松使用。 该指标在 M1 上表现最佳,也适用于几乎所有货币对,包括黄金(XAUUSD)、英镑、美元主要货币对和交叉盘。
内置弹窗提醒和电子邮件通知,确保您不会错过任何信号。 核心概念 Scalping signals M1 外观简单,但内部算法复杂。
视觉元素仅包括: – 趋势通道方向
– Buy/Sell 方向箭头 内部算法结合: – 线性回归趋势分析
– 自适应波动率通道
– 通道边缘的反转形态检测
– 振荡指标与趋势强度过滤
– 动态跟随市场节奏的参数调整 简而言之:
先确定趋势 → 等待价格回调至通道边缘并出现反转结构 → 箭头在符合条件时出现。 如何使用 将指标应用于图表(推荐 M1,可用于 M5 以上)。 根据通道判断趋势方向:
–

World Trend is a hybrid trend indicator, as it is based on the signals of elementary indicators and a special algorithm for analysis. The indicator shows favorable moments for entering the market. The intelligent algorithm of the indicator determines the trend, filters out market noise and generates entry signals.
You can use the indicator as the main one to determine the trend. The indicator can work both for entry points and as a filter. Uses two options for settings. The indicator uses colo

我们创新的基本烛台形态仪表盘专为自动识别图表上的盈利烛台形态而设计。该仪表盘使用先进的算法实时扫描价格图表,并检测从经典到复杂的各种烛台形态。此外,它还有一个易于使用的界面,允许您在不同的时间框架上对检测到的形态进行可视化,从而轻松做出明智的决策/ MT5 版本
免费指标: Basic Candlestick Patterns
包括谐波形态 看涨形态 Hammer Inverse hammer Bullish engulfing Morning star 3 White soldiers 看跌形态 Hanging man Shooting star Bearish engulfing Evening star 3 Black crows
指标列 Symbol: 将显示所选符号 Pattern: 形态类型(锤子型、反向锤子型、看涨吞没型......) Bar: 自检测到该形态以来所经过的柱状图数量 Age (in minutes): 自检测到该形态以来的年龄
主要输入 Symbols : 从 "28 种主要货币对 "或 "选定符号 "中选择。 Selected Symb

UR伽瑪 (由機器學習系統中的類似計算提供支持)
UR Gamma 是一種尖端的金融分析工具,它對經典的 WaveTrend 指標進行了全新改進。 通過結合先進的數字信號處理技術,UR Gamma 解決了傳統 WaveTrend 算法的一些局限性,並提供了一種更準確、穩健和動態的方法來識別和衡量價格行為的趨勢。
使用 UR Gamma 的優勢:
簡約設置 所有數據都在後台計算 - 用戶只有 1 個輸出 - 清晰整潔。 表明疲憊的背景水平 適應各種資產。 有一個特殊的電報聊天,您可以在其中了解最新的工具更新,如果您覺得缺少什麼,也可以發送請求!
為什麼選擇 UR Gamma?
目標是讓概率分佈在 -1 和 1 之間振盪,中間點為 0。 為實現這一目標,使用機器學習中稱為激活函數的技術來轉換數據。 一個這樣的函數是雙曲正切函數,它經常用於神經網絡,因為它保持 -1 和 1 之間的值。通過對輸入數據進行一階導數並使用二次均值對其進行歸一化,tanh 函數有效地重新分配輸入 信號進入 -1 到 1 的所需範圍。
UR Gamma 是交易者和投資者的強大工具,為他們提供對市場趨勢
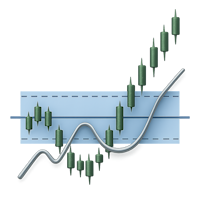
PriceDensity – Professional Price Density Indicator for Accurate Market Level Detection PriceDensity is a smart, non-volume-based indicator that analyzes historical price action to determine key price levels with the highest frequency of occurrence . It automatically detects where the market has spent the most time – revealing hidden areas of support and resistance based on actual market behavior, not subjective drawing. This tool is ideal for traders using price action, support/resistance conce

This is a powerful indicator that groups multiple Expert Advisors (EAs) by strategy and displays aggregated performance results directly on the chart. Grouping is optional — you can use it even without organizing EAs into groups. It automatically calculates and visualizes performance within a specified aggregation period. You can exclude specific magic numbers or aggregate results across multiple magic numbers as a group. Additionally, by using partial string matching based on EA names, you can
MetaTrader市场提供了一个方便,安全的购买MetaTrader平台应用程序的场所。直接从您的程序端免费下载EA交易和指标的试用版在测试策略中进行测试。
在不同模式下测试应用程序来监视性能和为您想要使用MQL5.community支付系统的产品进行付款。
您错过了交易机会:
- 免费交易应用程序
- 8,000+信号可供复制
- 探索金融市场的经济新闻
注册
登录