适用于MetaTrader 4的付费技术指标 - 7
G-Labs Market Maker Dashboard - Exclusive Seasonal Offer Elevate your trading with the original G-Labs Market Maker Dashboard, available for a limited time at just $70 USD. Ideal for starter traders, this dashboard has been enhanced with new features and now includes a comprehensive training video. This indicator is for people trading the market makers method and is the entry level dashboard for that strategy is available for both mt4 and mt5. its a market scanner in real time showing peak

The indicator determines the state of the market (trend or flat) using the upgraded Bollinger Bands of higher timeframes and colors the bars in trend/flat colors. The indicator also gives signals (arrow on the chart + Sound and notification to Mail, Push):
signal at the beginning of every new trend; signal inside the trend (entry at the end of the correction) Signals are never redrawn!
How to use the indicator? The indicator works very well intraday. When using the indicator for intraday (TF M

构建图表并识别周期性价格变动的技术指标。
可以在任何图表上工作。
几种类型的通知。
图表本身还有额外的箭头。
无需重新绘制历史记录,只需关闭蜡烛即可。
建议使用 M5 及以上的 TF。
易于使用和配置参数。
当使用 2 个具有不同参数的指标时,您可以单独使用它们,而无需其他指标。
有 2 个输入参数
周期性和信号持续时间
这两个参数处理图表结构的处理。
Cyclicity 调节反转周期的变化频率,平滑周期。 Signal duration 为最小数字,检测价格变动中的脉冲,最大长期趋势变动。 ---------------------------------------------------------------------------------------

This dashboard shows you the 3MA Cross Overs current status for Multi-currency multi-timeframes. Works for Metatrader 4 (MT4) platform. Detailed Post:
https://www.mql5.com/en/blogs/post/759238
How it Works:
MA Cross Signals It will show “S” Green/Red Strong Signals and “M” or “W” Green/Red Medium or Weak signals. We have 3 types of MA: Faster, Medium and Slower MA. A strong signal is when FasterMA and MediumMA are both above/below SlowerMA. A medium signal is when only FasterMA is above/below

多时间框架锯齿形调整浪指标。 它显示支撑/阻力水平线及其突破,并绘制当前的市场目标。 它还可以显示分形指标的线条和其他时期(最多季度)的蜡烛。
该指标重新绘制最后一个(当前)点,并且在某些情况下可以更改最后 2-3 个点。
所有线条均绘制为对象(不是指标缓冲区,但有可能接收 EA 的数据)。 在 Expert Advisor 中使用时,您可以使用 iCustom 读取 ZigZag 点。
设置 Mode — 根据以下因素绘制支撑位和阻力位: — Zig Zag — ZigZag 指标; — ZigZag Close — 之字折线收盘指标; — Fractals — 分形指标; — High-Low of the period — 通过高低水平构建指标。 时间范围在Period参数中指定; — Candles only — 仅绘制蜡烛; Depth — 如果最后一根蜡烛的偏差小于(或大于)前一根,则 Zigzag 将不会绘制第二个最大值(或最小值)的烛台的最小数量; Deviation — 锯齿形形成局部顶部/底部的两个相邻烛台的最高点/最低点之间的最小点数; Back

订单块的个人实现,一种简单而有效的头寸交易策略。如果价格范围没有在与突破相反的方向被突破,则交易者应进入市场或在最后一个订单块的方向上寻找交易。为清楚起见,未绘制开放块。
[ 安装指南 | 更新指南 | 故障排除 | 常见问题 | 所有产品 ] 一个看涨的开盘是在一个新的市场低点之后的第一个看涨柱 看跌的开盘是在新的市场高点之后的第一个看跌柱 当打开的块被破坏时出现信号,成为订单块 当一个订单块被打破到相反的一侧时,它就变成了一个反转块 该指标实施各种警报 它不会重新粉刷或重新粉刷
输入参数 周期:创建新高或新低所需的柱线数量。较小的值会产生更多的信号。
最小 ATR 过滤器:订单块栏的最小主体尺寸,表示为 ATR 的乘数。 Max ATR Filter:订单块的最大主体尺寸,表示为 ATR 的乘数。
颜色:设置线条和箭头的颜色和大小。
警报:启用显示/电子邮件/推送/声音警报。
支持和问题
使用帮助台解决问题或及时获得支持。写一封电子邮件至:help@pointzero-trading.com。
作者 Arturo López Pérez,私人投资者和投机者、软件工程师和 P
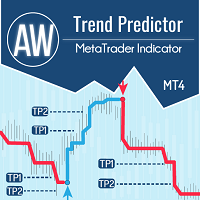
一个系统中趋势和故障水平的组合。先进的指标算法过滤市场噪音,确定趋势、进入点以及可能的退出水平。指标信号记录在统计模块中,您可以选择最合适的工具,显示信号历史的有效性。该指标计算获利和止损标记。 手册和说明 -> 这里 / MT5 版本 -> 这里 如何使用指标进行交易: 使用趋势预测器进行交易只需三个简单的步骤: 第 1 步 - 开仓 收到买入信号,成功率超过 70% 第 2 步 - 确定止损 通过相反的信号选择中继线 第 3 步 - 定义止盈策略 策略一:达到 TP1 时平仓 策略 2:达到 TP1 时平仓 50%,达到 TP2 时平仓剩余 50% 策略三:在趋势反转时平仓 好处: 从不重绘结果,信号严格位于蜡烛收盘时 它可以在顾问中使用 获利和止损标记 对交易策略或独立策略的重要补充 市场噪音过滤算法 适用于任何工具 统计模块: 为了更好地选择配对,请使用内置的统计计算。 计算交易 - 给出统计数据的信号总数 成功评级 - 达到 TP1 的信号百分比,或反转那些正获利的信号时的百分比 TakeProfit1 Hit - 达到 TP1 的信号百分比 TakeProfit2

The MarketPrice Indicator is designed to provide a quick, one-glance visualization of the trend direction for a currency pair across all time frames (Time Frames), streamlining decision-making. MarketPrice Indicator is based on daily levels and trading signals derived from moving average crossovers and market strength according to various technical indicators. It comes fully configured, though you can, of course, modify any parameters as desired. Indicator Logic The indicator uses a combination

Vondereich MTF Strength Indicator Description: Overview: The Vondereich MTF Strength Indicator is a powerful yet user-friendly multi-timeframe analysis tool designed to simplify market insights for traders of all experience levels. By evaluating currency pairs across various timeframes using a combination of technical indicators such as the Stochastic Oscillator, Relative Strength Index (RSI), Exponential Moving Average (EMA), and Average True Range (ATR), this indicator delivers clear buy, sell

KDJ Index 4 交易实用必备工具指标 波浪自动计算指标,通道趋势交易 完美的趋势-波浪自动计算通道计算 , MT4版本 完美的趋势-波浪自动计算通道计算 , MT5版本 本地跟单复制交易 Easy And Fast Copy , MT4版本 Easy And Fast Copy , MT5版本 本地跟单复制交易 模拟试用 Easy And Fast Copy , MT4 模拟账号运行 Easy And Fast Copy , MT5 模拟账号运行 "Cooperative QQ:556024 " "Cooperation wechat:556024" "Cooperative email:556024@qq.com" 强烈推荐趋势指标, 波浪的标准自动计算 和 波浪的标准自动计算MT5版本
KDJ指标又叫 随机指标 ,是一种相当新颖、实用的技术分析指标,它起先用于期货市场的分析,后被广泛用于股市的中短期趋势分析,是期货和股票市场上最常用的技术分析工具。 随机指标KDJ一般是用于股票分析的统计体系,根据统计学原理,通过一个特定的周期(常为9日、9周等)
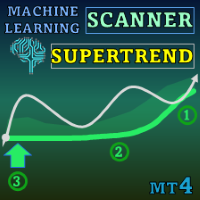
Special offer : ALL TOOLS , just $35 each! New tools will be $30 for the first week or the first 3 purchases ! Trading Tools Channel on MQL5 : Join my MQL5 channel to update the latest news from me 利用先进的机器学习技术,体验 Machine Learning Adaptive SuperTrend 的强大功能,这是一款创新的指标,能够无缝适应市场变化。通过将k-means聚类与SuperTrend方法结合,该指标能够精准识别趋势并评估波动性,为交易者在动态市场中提供宝贵的优势。 查看更多MT5版本: Machine Learning Adaptive SuperTrend MT5 查看更多产品: 所有产品 精准的机器学习与自适应SuperTrend 此指标基于实时市场数据进行调整,将波动性分为高、中、低三个等级。利用k-means聚类,它将ATR(平均真实范
Advanced Indicator Scanner is a multi-symbol multi-timeframe scanner that works with hundreds of custom indicators available across the web including mql5 website market and codebase indicators.
Advanced Indicator Scanner features:
Scans your indicator in 28 customizable instruments and 9 timeframes. Monitors up to 2 lines(buffers) of an indicator. Showing of indicator value on buttons. You can choose between 3 alert modes: Single symbol and timeframe Multiple timeframes of a symbol Multiple

精密指数振荡器(Pi-Osc)由Precision Trading Systems的Roger Medcalf开发
版本2经过精心重新编码,以在您的图表上加载速度非常快,还加入了一些其他技术改进,以提高体验。
Pi-Osc旨在提供准确的交易定时信号,旨在找到极端的耗尽点,这些点是市场被迫去触及,以清理每个人的止损单。
该产品解决了一个古老的问题,即知道极端点在哪里,这使得交易员的生活变得更加简单。
这是一个高度复杂的共识指标,与行业标准的振荡器相比,具有一些强大的区别。
它使用的一些特征包括需求指数、资金流动、RSI、随机指标、模式识别、成交量分析、标准偏差极端点以及不同长度上述各种变化的分歧。
乍一看,对于未经培训的人来说,它似乎与任何其他振荡器没有什么不同,但当与其他振荡器(如RSI或动量等)相对比时,这个指标的真正威力开始显现。
据我所知,没有其他振荡器可以频繁地精确指出顶部和底部,具有相同的定期效率。
精密指数振荡器由许多不同的数学方程组成,用于测量多个时间框架采样中的价格和成交量变动,从而高度准确地预测趋势可能发生转折的位置。
PTS Pi-Osc V2非

True Choppiness Direction determines if the market is choppy (trading sideways) or if it is trending, as well as the trend direction and strength (green=up, red=down, grey=no trend) . The underlying algorithm is designed to detect trend movements even in the presence of noisy market data, please see screenshots. Trend strength is indicated by taller or shorter red/green fill. Choppiness index is range-bound between -50 (very trendy) and +50 (very choppy). This is a custom algorithm designed by u

Special offer! https://www.mql5.com/ru/users/bossik2810
Smart Level Pro is a very powerful indicator based on the concept of order blocks and set entries with the right fvg and breakouts to create a very good entry level like a professional trader. Very easy to use interface and easy to enter on buy and sell signals. The indicator does not repaint and does not change its data! Works best on M5-M15 timeframe for gold, bitcoin and currency pairs. 4-5 deals daily for each pair. Trading with this

Please send me Direct message on MQL5 CHAT after purchasing the Indicator for Training and Installation Support There are some additional files that is important to use with the Indicator . So be sure to contact me after purchasing the Indicator So that I can add you for training and support .
If you find any difficulty with installation then send me Direct message here So that I can connect with you via Anydesk or Teamview for the product installation. " Smart Order Block Indicator " to find m

这个强大的工具会自动识别趋势线,帮助您简化交易策略并做出更明智的决策。 mt5版本
关键功能 自动趋势线检测 :“基本趋势线”指标扫描了市场的潜在趋势线,并立即在图表上显示它们。这样可以节省您的宝贵时间,并确保您永远不会错过重要的趋势。 用户友好的面板 :我们的指示器配有美丽,直观的面板,可让您轻松绘制各种趋势线。该面板专为所有经验级别的交易者而设计,仅需单击几下即可添加,编辑或删除趋势线。 保存和管理您喜欢的趋势线 :跟踪对您最重要的趋势线。我们的指标使您可以保存首选的趋势线,并在您重新访问图表时始终可用。 多功能应用程序 :无论您是交易外汇,股票还是加密货币,“基本趋势线”指标适应各个市场,为您提供可靠的工具来增强交易策略。 输入 Number of Reactions :您可以确定价格对趋势线反应的次数。 Reaction Strength :一个较高的数字意味着只考虑了更强的反应。 Price Mode :趋势线可以在高/低价格上或关闭/关闭。 Max Length of Trend Line :使用此条目,您可以确定趋势线的最大长度。根据酒吧的数量。 Extend Bars
Apollo Binary Options Indicator 这是二元期权交易的信号指标。该信号在当前蜡烛的开盘时出现,并且在它关闭之前一直有效。信号伴随着箭头以及图表上的信号消息。推荐的期权到期时间是一根蜡烛。也就是说,如果图表是 H1,那么到期时间将是 1 小时。如果图表为 M5,则期权到期时间为 5 分钟。但事实上,您可以随意使用信号,如果您愿意,您可以自由地遵循自己的交易规则。 我建议将此指标与我的其他用作过滤器的指标结合使用。我将完全免费向所有买家提供第二个指标。我还将与您分享有关如何使用该指标来获得最佳结果的建议。该系统适用于二元期权交易者和外汇交易者。 购买后联系我!我将免费向您发送一个额外的指标!我还将与您分享使用该系统进行交易的建议。
Candlestick Patterns MT4 is a simple and convenient indicator able to define 29 candle patterns.
Advantages Defines and highlights 29 candle patterns; Estimated trading direction is shown as an arrow; Each candlestick pattern can be disabled in the settings; The indicator can be used as an arrow indicator in EAs.
Parameters TextSize - chart text size; TextColor - chart text color; Alert - enable/disable alerts; ---------- Candlestick Patterns ------------- - settings separator; AdvanceBlock ;
Special offer : ALL TOOLS , just $35 each! New tools will be $30 for the first week or the first 3 purchases ! Trading Tools Channel on MQL5 : Join my MQL5 channel to update the latest news from me Supply Demand Retest and Break Multi Timeframe ,此工具基于强劲的动量蜡烛绘制供需区,允许您使用 timeframe selector 功能在多个时间框架中识别这些区域。通过重新测试和突破标签,以及可自定义的验证和样式选项,此工具支持有效的交易分析。 查看更多 MT5 版本请访问: Supply Demand Retest and Break MT5 Multi Timeframe 查看更多产品请访问: All Products 主要功能 灵活的时间框架选择: 利用时间框架选择器,根据您的交易需求在不同的时
Special offer : ALL TOOLS , just $35 each! New tools will be $30 for the first week or the first 3 purchases ! Trading Tools Channel on MQL5 : Join my MQL5 channel to update the latest news from me I. 介绍
Market Structure Trend Targets Scanner 是一个强大的工具,用于分析市场趋势、识别突破点,并通过动态止损管理风险。通过跟踪之前的高点和低点以确定突破点,这个工具帮助交易者以直观的方式快速识别市场趋势和潜在的反转。 查看更多MT5版本: Market Structure Trend Targets MT5 Scanner 查看更多产品: 所有 产品 II. 主要特点 通过顺序编号识别突破点 清晰区分上升趋势 当价格突破之前的高点,以及下降趋势当价格突破之前的低点。 用入场价标记初始突破 ,而后续的突破标记为(1, 2,

Scalping Indicator Pro is a powerful indicator that works in trend as well as non trending market conditions. This indicator is perfect for scalp trades as well as swing trades. Scalping Indicator Pro is not just an indicator, but a trading strategy itself. It doesn't requires any additional indicators for the trading setup.
Check out the indicator in action. [Video demonstration below]
Why use Scalping Indicator Pro? Great for novice traders as well as experienced traders. Low risk entries.

This is Multiple Timeframe of Malaysia SNR Levels and Storyline. The single timeframe version here Features: + Display level on multiple timeframe (higher or lower) + Turn on/off level on timeframe + Alert when price touch level 1. if high > resistance level but close of candle < resistance level , this level become unfresh - Name of level will have "(m)" meaning mitigated if close of candle > resistance level , this level become invalid and can be removed in chart (there is setting for keep

Universal Swing Arrows 是一种基于箭头的指标,旨在提供波段交易信号。它可用于任何交易对和任何交易时间范围。 箭头出现在当前 (0) 根蜡烛上。信号不要重绘! 该指标可用作独立交易系统或作为您个人交易策略的一部分。该指标的箭头不仅是一个信号,也是您可能的止损水平。该指标会自动为您计算最佳止损位,并在您的止损位准确绘制箭头。它使用保护性止损类型,为价格提供一些空间,以避免错误的止损触发。 该交易系统非常易于使用。您只需要选择交易对和交易时间范围即可。然后只需按照指示器信号操作即可。 购买后请与我联系。我将与您分享我的交易建议,并免费为您提供丰厚的红利指标! 祝您交易愉快,获利丰厚!感谢您的关注!

MetaForecast能够根据价格数据中的谐波来预测和可视化任何市场的未来走势。虽然市场不总是可预测的,但如果价格中存在模式,MetaForecast可以尽可能准确地预测未来。与其他类似产品相比,MetaForecast通过分析市场趋势可以生成更精确的结果。
输入参数 Past size (过去的尺寸) 指定MetaForecast用于创建生成未来预测模型的柱数量。该模型以一条黄色线绘制在所选柱上。 Future size (未来的尺寸) 指定应预测的未来柱数量。预测的未来以粉色线表示,并在其上绘制了蓝色回归线。 Degree (程度) 此输入确定了MetaForecast将在市场上进行的分析级别。 Degree 描述 0 对于程度0,建议使用较大的值来设置“过去的尺寸”输入,以覆盖价格中的所有高峰、低谷和细节。 1 (建议的) 对于程度1,MetaForecast可以理解趋势,并通过较小的“过去的尺寸”生成更好的结果。 2 对于程度2,除了趋势,MetaForecast还可以识别反转点。对于大于1的程度,必须使用较高的“细节”和“噪音减少”输入值。 大于2 不建议使用大于

作为外汇交易员,您了解 斐波那契 交易策略在技术分析中的价值。然而,手动绘制和调整斐波那契水平线可能非常耗时。这就是 Fibonacci Of Yesterday Ultimate 指标的用武之地。它专为使用基于前一天价格行为的 Fibonacci 策略的交易者而设计,可为您节省时间和精力。 这一创新指标根据斐波那契水平自动识别入场、止损和获利水平。它还包括一个用户友好的斐波那契工具,可以轻松定制以满足您的喜好。它的与众不同之处在于它能够识别图表上的真实趋势通道,帮助您轻松发现反转、回撤和趋势机会。 使用 Fibonacci Of Yesterday Ultimate 指标非常简单。等待重大新闻发布,确定趋势,并相应地绘制斐波那契水平。在 50% 和 38.2% 水平之间进行交易,将止损设置在 23.6% 回撤水平。该指标简化了该策略的实施。 用户友好的界面和快速访问按钮使其适合所有级别的交易者。当价格进入斐波那契水平时,通过手机、电子邮件和弹出式警报随时通知您。您可以自定义每个警报并查看其他时间范围内保存的信息。 告别手动调整和趋势通道分析。 Fibonacci Of Yesterd
特别优惠 : ALL TOOLS ,每款仅 $35 ! New tools will be $30 for the first week or the first 3 purchases ! Trading Tools Channel on MQL5 : Join my MQL5 channel to update the latest news from me 在波动剧烈的交易环境中,一款功能强大且直观的分析工具可以帮助您迅速抓住机会。Fibonacci Trend Scanner不仅结合了传统Fibonacci指标与SuperTrend功能,而且通过货币对扫描、多周期监控以及当趋势在多头与空头之间转换时的智能提醒,进一步扩大了其应用范围。 See more MT5 version at: Fibonacci Trend MT5 Scanner See more products at: All Products 1. 结合SuperTrend技术的趋势分析 Fibonacci Trend Scanner采用 SuperTrend 算法,可快速准确

This indicator presents an alternative approach to identify Market Structure. The logic used is derived from learning material created by DaveTeaches (on X) Upgrade v1.10: add option to put protected high/low value to buffer (figure 11, 12)
When quantifying Market Structure, it is common to use fractal highs and lows to identify "significant" swing pivots. When price closes through these pivots, we may identify a Market Structure Shift (MSS) for reversals or a Break of Structure (BOS) for co

KT Price Border 创建了一个由三条带组成的价格通道,用于识别市场中的潜在高点和低点。这些水平还可以用作动态市场支撑和阻力。 中间带还可以用于识别趋势方向,因此它也可以作为趋势跟踪指标。此外,其简单易用的特点以及清晰的交易信号,使新手交易者受益匪浅。
功能特点
适用于大多数外汇货币对。 可用于低时间框架和高时间框架。 适用于剥头皮交易、日内交易和波段交易。 支持趋势交易和逆势交易策略。 当价格突破价格带时,可发送提醒通知。 价格带还可作为动态支撑和阻力水平。
理解价格边界的概念 该指标的工作原理类似于布林带。下轨表示市场超卖区域,同时充当动态支撑。 上轨表示市场超买区域,同时充当动态阻力。中间带用于确定趋势方向。 如果价格收于中间带上方,则表明市场仍处于上升趋势;相反,如果价格收于其下方,则表明市场仍处于下降趋势。
专业建议 使用 KT Price Border 进行交易时,可以自由选择自己偏好的入场、止损和止盈方法。 与任何指标一样,应遵循更广泛的市场趋势,并在模拟账户上进行练习,直到完全掌握。请记住,即使是最好的交易指标,在长期交易中也无法保证 100% 的胜

趋势振荡器:平稳可靠的市场趋势识别 趋势振荡器是一款先进的 MT4 指标,旨在帮助交易者准确识别趋势方向和潜在的反转点。借助直观的视觉呈现,该指标清晰地显示市场处于上升趋势还是下降趋势,从而简化分析并提高图表的可读性。适用于多种市场和时间框架,提供了极大的灵活性以满足不同的交易需求。 趋势振荡器的主要特性和优势 简化的趋势可视化 :趋势振荡器通过颜色变化的线条图形化地展示趋势运动以指示市场方向。蓝色表示上升趋势,黄色表示下降趋势,提供了即时且清晰的趋势读取。 可靠的反转信号 :通过先进算法,指标会生成代表可能反转点的彩色箭头。绿色箭头表示潜在的买入点,而红色箭头表示潜在的卖出点,帮助交易者识别评估进场或出场的关键区域。 适用于任何市场和时间框架 :趋势振荡器在任何市场和不同的时间框架下都能有效运行,提供了适用于所有交易条件的灵活性和多样性。 用户友好,易于使用 :该指标专为易用性而设计,即使是初学者也可以轻松使用。重要信息直接显示在图表上,使得分析更加轻松和即时。 适用于不同的交易风格 :无论您采用的是剥头皮还是短期交易策略,趋势振荡器都能在不同的市场条件下提供支持,适应不同的交易风格
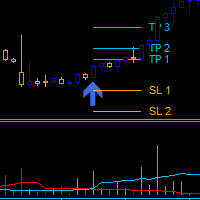
Dark Power is an Indicator for intraday trading. This Indicator is based on Trend Following strategy, also adopting the use of an histogram to determine the right power . We can enter in good price with this Indicator, in order to follow the strong trend on the current instrument. The histogram is calculated based on the size of the bars and two moving averages calculated on the histogram determine the direction of the signal
Key benefits
Easily visible take profit/stop loss lines Intui
该指标根据指定的系数找到一个低,高,极端的体积,并用指定的颜色绘制它们。 它取代了metatrader终端中的标准体积绘制功能。 蜡烛也可以在体积的颜色着色。 在具有极端体积的烛台上,确定最大水平体积(cluster/POC)。 根据它的位置(推动,中立,停止),集群也有自己的颜色。 如果集群在阴影中,并且蜡烛有一个极端的体积,那么我们得到一个逆转的箭头。 您可以在设置中启用警报。 此外,指示器中还有一个单独的选项,以阴影显示群集。
输入参数 。 (一些与颜色和视觉设置相关的跳过) 。
基本设置 。 Bars Count – 指标将工作的历史柱数 。 Data Source - 报价时间范围的选择。 如果您认为您认为过去的历史被截断和不完整,那么为您正在研究的仪器下载更多M1报价。 Vertical Step - 影响密度和垂直精度 。 Calc Bars - 用于体积计算的平均蜡烛数 。 Low Volume Factor - 我们固定最小音量的系数。 如果不需要,请将值设置为0 。 High Volume Factor - 我们固定大体积的系数 。 Extreme Volum
Enjoy a 50% OFF Christmas holiday sale!
This indicator is unstoppable when combined with our other indicator called Katana. After purchase, send us a message and you could get Katana for FREE as a BONUS After purchase, send us a private message for your instructions. The Trend Forecasting indicator is a very unique & easy tool that is able to make prediction about future price movement based on the signals generated by MACD . It helps you have an estimation on the areas that the price ma

许多盈利交易者不仅知道如何识别市场趋势,而且也能把握趋势建立后的交易机会。 Pz 趋势交易 指标设计用来在趋势行情中尽可能的赚取利润。 已建立的趋势提供了一揽子交易机会,但大多数趋势交易指标完全忽视了它们,让交易者在趋势行情时完全不知道该如何做!一般趋势指标只通知有关的趋势变化,但根本不足以得到卓越的回报. Pz 趋势交易 指标比一般趋势指标显示多达 20 倍的交易 , 因为它注重所谓的市场时机。它不仅显示当前的市场趋势,也有回调,内柱线的突破和调整。它令您在趋势回调之后介入,安全的柱线内突破金字塔加仓,以及发现潜在的反转,和已知的调整。
趋势改变 一个趋势改变在市场方向变化时发生。趋势变化在图表上用带数字的彩色圆圈显示。蓝色 (1) 信号为上涨开始, 而红色 (1) 信号为下跌开始。趋势变化并非评估当前价格动作的结果, 它意味着交易设置是不定时地。如果您正确使用本指标, 在趋势变化时, 您将将已经入场 (参看下面的调整)。
回调 但凡趋势在运动中,行情上下抖动,盈利者收割利润,且其它参与者入场。趋势回调代表好的买入机会,通常是由主力获利离场导致。如果行情在回调后回归上行, 指标将

Binary Chronos – MT4 二元期权指标 缓存信号 :图表箭头信号便于进场并支持自动交易。 ️ 到期时间 :默认为 1 根K线。 趋势交易 :识别趋势方向,寻找最佳进场点并发出信号。 当前K线进场 :信号用于当前K线立即入场。 ️ 马丁策略 :首单失败时,在 下一根K线上进行一次马丁补仓 ,不超过一次。 LevelEn :此参数越高,信号质量和准确性越高。 适用于任意周期 :支持所有时间框架。 不重绘 :信号稳定可靠。 提醒功能 :弹窗和声音提示。 Binary Chronos — 精准顺势进场,信号不重绘,风险可控!
**************************************************************************

介绍 Quantum Heiken Ashi PRO 图表 Heiken Ashi 蜡烛旨在提供对市场趋势的清晰洞察,以其过滤噪音和消除虚假信号的能力而闻名。告别令人困惑的价格波动,迎接更流畅、更可靠的图表表示。 Quantum Heiken Ashi PRO 的真正独特之处在于其创新公式,它将传统烛台数据转换为易于阅读的彩色条。红色和绿色条分别优雅地突出了看跌和看涨趋势,让您能够以非凡的精度发现潜在的进入和退出点。
量子 EA 通道: 点击这里
MT5版本: 点击这里
这一卓越的指标具有以下几个关键优势: 增强清晰度:通过平滑价格波动,Heiken Ashi 金条可以更清晰地反映市场趋势,使您更容易识别有利的交易机会。 减少噪音:告别经常导致错误信号的不稳定价格变动。 Quantum Heiken Ashi 指标可过滤噪音,使您能够做出更明智的交易决策 无缝集成:Heiken Ashi 指标专为 MetaTrader 开发,可无缝集成到您的交易平台中。它用户友好、高度可定制,并且与您的其他交易指标和过滤器兼容 无论您是寻求新优势的经验丰富的交易

Trade Invest Pro - Boss in the world of cryptocurrency!
This indicator is ideal for cryptocurrency trading!
Work on Trade Invest Pro took us half a year!
But not in vain! Now only accurate signals near support - resistance levels!
He showed himself well on timeframes m5 m15 for binary options!
Optionally, it can be configured for forex for timeframes m30 and more!
Reacts well to news!
Doesn't paint! and does not disappear from the schedule!
As soon as a red arrow appears, open a deal fo

The Volume Spread Analysis indicator is based on the original Volume Spread Analysis method. It was designed for quick and easy recognition of VSA patterns. Even though this indicator looks very simple, it is the most sophisticated tool we've ever made. It is a really powerful analytical tool that generates very reliable trading signals. Because it is very user-friendly and understandable, it is suitable for every type of trader, regardless of his experience.
What is VSA? VSA - Volume Spre

Did You Have A Profitable Trade But Suddenly Reversed? Exiting a trade is equally important as entering! Exit Scope helps maximize your current trade profit and avoid turning winning trades to losers.
Attention Exit Signals are NOT to be used in entering a trade! Exit means closing your trades to avoid correction/reversal which can wipe out existing profit or haunt break-even orders. Please watch presentation (Click Here)
Features Generates instant exit signals based on price action, volatili
KT Candlestick Patterns 实时识别并标注出 24 种最可靠的日本蜡烛图形态。自18世纪以来,日本交易员便一直使用蜡烛图预测价格走势。 确实,并非所有蜡烛图形态都能可靠地预测价格方向,但如果与支撑阻力等其他技术分析方法结合使用,它们可以更清晰地反映当前市场状况。
该指标涵盖了许多出现在 Steve Nison 所著《日本蜡烛图技术》中的形态。 除书中图形外,还能识别很多较为复杂但不太为人所知的蜡烛图形态。
功能特点
可设置固定点数为目标,输入成功点数后即可看到每个信号的成功率。 准确识别 24 种日本经典蜡烛图形态。 配备实时统计模块,显示每种形态的表现情况。 可设置图形之间最小间隔柱数,优化图表整洁度与信号质量。 结合市场趋势方向,提高识别的准确性。 包含反转、趋势延续与中性形态(如十字星)。 支持所有 MetaTrader 警报类型。
包含图形 ----- 反转形态 ----- 母子形态 锤头/流星 吞没 三只白兵/三只乌鸦 外包三阳/三阴 内包三阳/三阴 晨星/暮星 挤压形态 带腰带形态 乌云盖顶/刺透形态 推进阻挡/下降阻挡 反击线 阶梯底/顶 跳空
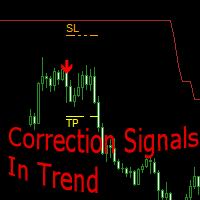
Correction Signals In Trend 一 种分析市场动态的技术指标,帮助交易者确定趋势方向并找到开仓点。
以支撑线和阻力线形式呈现的趋势跟踪指标显示上升或下降趋势。
在趋势方向上,修正结束后,进行信号搜索。箭头表示进行交易操作的潜在时刻。
对于每个信号,都会显示推荐的 SL 和 TP 设置。
指示器功能
信号箭头出现在当前蜡烛上,并且不会重新绘制。 当信号出现时,有几种类型的警报可用。 按照趋势的方向努力。 它是通用的,可以用于任何交易工具和时间范围。 SL 和 TP 级别参数根据市场情况自动计算。 适合短期交易,包括剥头皮交易。 屏幕截图中显示了指标操作的视觉描述。
设置输入参数
Trend line length - 控制支撑和阻力趋势线的长度。 Sensitivity of correction signals - 改变校正信号的灵敏度。数字越高,信号越正确。数字越小,信号越多。

或 M oving 一个 verage 小号 upport [R esistance 带 。
MASR Bands 指标是一条移动平均线,由两条带共同作为支撑位和阻力位。据统计,MASR 波段 93% 的时间都包含价格蜡烛。以下是分步计算的方法: 1. 第一步是计算 X 时间段内的最高价 (HHV) 和最低价 (LLV)。
2. 第二步是用HHV除以LLV,得到它们之间的距离有多宽的百分比。我称这一步的结果为 MASR Filter。
3. MASR 过滤器 = 总和 ((HHV / LLV)-1) / 柱数
4. 我将上带称为 MAR,这是移动平均阻力的捷径。我将下频带 MAS 称为移动平均线支持的捷径。波段之间的移动平均线称为中心线。
5. MAR = MASR 中心 + (75% x MASR 过滤器 x MASR 中心)
6. MASR 中心是移动平均线。
7. MAS = MASR 中心 - (75% x MASR 过滤器 x MASR 中心)
重要链接
MASR 工具手册: https://www.mql5.com/en/blogs/post/721889

Quarterly Cycles
Quarterly Cycles is based on the Quarterly Theory developed by Daye ( traderdaye on X ) T his is an aid to the user to find Cycles and it is NOT automatic detected, user can select AMDX or XAMD in each Cycle and it will be visually draw on the chart. Quarterly Cycles: Yearly, Monthly, Weekly, Daily, 6 Hour (90 minutes)
Yearly Cycle: The year is divided in four sections of three months each Q1 - January, February, March Q2 - April, May, June Q3 - July, August, September Q4 -

比特币预测器是一个基于箭头的指标,旨在预测价格反转。 此工具可与 BTC 和其他加密货币一起使用。它也可以与货币一起使用。但是您需要首先检查哪些配对最有效。一些配对和时间框架可以工作得非常好。您可以自由测试并自己查看。 该指标非常易于使用。所有你需要的是按照箭头。该指标可以作为独立系统工作,也可以作为您已经在使用的任何系统的一部分。购买后我将与您分享我的交易建议和奖金指标! 指示信号可以很容易地调整。您可以使指标算法适应任何时间范围,以及加密货币以外的其他货币对。 信号不要重绘!无论您目前拥有何种级别的交易经验,该交易指标都会对您有所帮助。 购买后请联系我!我将与您分享我的交易建议和奖金! 感谢您对我的指标的关注和兴趣!
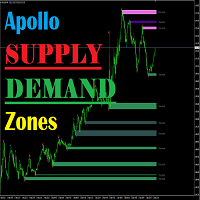
Apollo Supply Demand Zones 是计算支撑位和阻力位的指标。无论他们使用什么策略,该指标绝对对所有交易者都有用。该指标可以成为您交易系统的主要元素之一。该指标计算当前时间范围内的水平,并且可以在 MTF 模式下工作,显示更高时间范围内的水平。该指标绝对可以在任何时间范围内和任何交易工具上使用。该指标显示了各种类型的水平,这些水平实际上显示了市场的画面。该指标提供声音警报,这使得使用该指标非常方便。 可以自定义该指标以选择该指标应为您绘制的支撑位和阻力位。 该指标可用于货币对、金属、股票、指数、加密货币。 购买后,一定要写信给我!我将与您分享使用该指标的建议。还有丰厚的红利等着你! 祝您交易成功!

ICT Silver Bullet
If you are searching for a reliable indicator to trade the ICT Silver Bullet concept, or ICT concepts, Smart Money Concepts, or SMC, this indicator will respond to your need! This indicator will help you identify the following: FVG - fair value gaps Market structure: BOS and CHOCH. It is based on ZIGZAG as it is the most subjective way to do it. ICT Silver Bullet windows and related notifications when it starts and when an FVG appears Swing High and low that are potential bu

Important!! ZO Trend can't work on MN timeframe. /*--------------------------------------------------------------------------------------------------------------------------------------------------------------------------------------------- ZO Trend an indicator used to search for entry point. With the session candle algorithm on many timeframe, ZO Trend creates an area for traders find good Entry Point. ZO SYSTEM BASIC SETUP : https://www.youtube.com/watch?v=qdNOXHWozNw ZO TREND User guide :

MT5 Version
Gaussian Channel MT4 Gaussian Channel MT4 is the first indicator in the market that uses Ehlers Gaussian Filter methods to define trends. Nowadays, this Gaussian Channel is highly known as a method to support HOLD techniques in crypto. If the price is above the channel the trend is strong, if it comes back to the channel this can react as a resistance and indicate the beginning of a bear market (or Winter) if the price breaks below it. Eventhough the use of this channel focuses on h

标准偏差通道的多货币和多时间框架指标。 显示市场的当前方向。 在面板上,您可以看到线性回归通道水平的突破和触及(按价格)。 在参数中,您可以指定任何所需的货币和时间范围。 此外,该指标还可以在触及水平时发送通知。 通过单击单元格,将打开该符号和句点。 这是 MTF 扫描仪。
默认情况下,从图表中隐藏仪表板的键是“D”。 «标准偏差通道建立在线性回归趋势的基础上,代表使用最小二乘法在价格图表上的两点之间构建的常见趋势线。 结果,这条线被证明是价格变化的确切中线。 它可以被视为一条均衡价格线,任何向上或向下的偏转分别表明买家或卖家的超活跃性。
标准偏差通道由两条平行线组成,与线性回归趋势上下等距。 通道框架与回归线之间的距离等于收盘价与回归线的标准差值。 所有价格变化都发生在标准偏差通道内,其中下框作为支撑线,上框作为阻力线。 价格通常会在短时间内超过通道框架。 如果它们在通道框架之外停留的时间比平时更长,则预测趋势转向的可能性»
参数 Show Linear Regression on the chart — 在当前图表上绘制标准偏差通道。
Standard Deviatio

The indicator shows on the chart the accurate market entry points, accurate exit points, maximum possible profit of a deal (for those who take profit according to their own system for exiting deals), points for trailing the open positions, as well as detailed statistics. Statistics allows to choose the most profitable trading instruments, and also to determine the potential profits. The indicator does not redraw its signals! The indicator is simple to set up and manage, and is suitable for begin

地震仪 市场地震探测器。 Description in English :
https://www.mql5.com/en/market/product/113869?source=Site+Market+Product+Page#description How to use the Seismograph :
https://www.mql5.com/en/market/product/113869#!tab=comments&page=2&comment=52806941
Create an EA :
https://www.mql5.com/en/market/product/113869#!tab=comments&page=3&comment=52816509 无论您以何种方式交易,您都绝对希望避免进入低流动性市场。 然而,即使你确保在应该繁忙的市场时间进入,事实是许多人经常被困在流动性低的市场中。 经过几个小时的等待,市场突然变得繁忙起来,但是......事实证明,现在很多人都站在了与市场相反的方向上。
如果人们不得不等待浮动负数需要很长时间,甚至人们不得不止
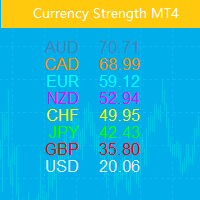
这个指标显示8个主要货币的相对强弱:USD, EUR, GBP, AUD, NZD, CAD, CHF and JPY. 强弱值规范到了 0-100之间 60以上是强。 40以下是弱.
基本原理 八个主要货币 USD,EUR,GBP,AUD,NZD,CAD,CHF,JPY, 他们每两个配对, 一共组成28对货币对, 利用逆向算法从28个货币对中提取到8个货币的强度 EURUSD,GBPUSD,AUDUSD,NZDUSD, USDCAD,USDCHF,USDJPY,EURGBP, EURAUD,EURNZD,EURCAD,EURCHF, EURJPY,GBPAUD,GBPNZD,GBPCAD, GBPCHF,GBPJPY,AUDNZD,AUDCAD, AUDCHF,AUDJPY,NZDCAD,NZDCHF, NZDJPY,CADCHF,CADJPY,CHFJPY
基本用法: 60以上为强, 40以下为弱 买最强的货币, 空做弱的货币 如果所有货币强度曲线位于40到60之间, 意味着市场处于震荡行情中 长线交易者, 最好等到两货币交叉之后 如果货币从60向上穿越60, 意味着它真正走

厌倦了绘制支撑线和阻力线? 支撑阻力 是一个多时间指标,可以自动检测并绘制图表中的支撑线和阻力线,并具有非常有趣的变化:随着时间的推移测试价格水平及其重要性的提高,线变得越来越粗。 [ 安装指南 | 更新指南 | 故障排除 | 常见问题 | 所有产品 ] 一夜之间增强您的技术分析 无需浏览图表即可检测重要的价格水平 一目了然地识别所有价格水平的相对优势 每次交易最多可节省半小时的绘图线 指标显示所有价格水平的期限 指示器不重涂 过去和现在的价格水平因接近程度而崩溃,并根据当前的市场行为进行了调整。在动作发生的地方绘制了线条,而不一定在峰值处绘制了线条。 价格水平随着时间的推移而被拒绝,变得越来越暗 定期清除不重要的价格水平以避免噪音 可自定义的时间范围选择和崩溃因子 它实现了电子邮件/声音/推送警报的突破
输入参数 指标设置:指标将从当前时间段读取价格,但您可以选择另一个。例如,您可以在H4图表中显示D1支撑线和阻力线。您还可以使用 价格水平密度 参数选择在图表上显示多少价格水平。
颜色设置:根据重要性输入所需的支撑线和阻力线颜色。
标签设置:(可选)可以在指示器中显示用于
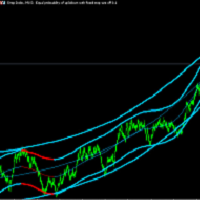
This indicator obeys the popular maxim that: "THE TREND IS YOUR FRIEND" It paints a Blue line for BUY and also paints a RED line for SELL. (you can change the colors). It gives alarms and alerts of all kinds. can be used for all currency pairs and timeframes. Yes, as easy and simple as that. Even a newbie can use it to make great and reliable trades. MetaTrader 5 version
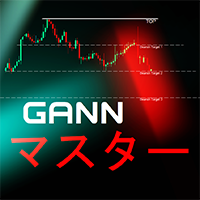
基于甘氏久经考验的方法,甘氏的精确目标呈现在您面前。该工具旨在使交易更加顺畅和直观。通过向上拖动白线或向下拖动绿线,您将立即明白为什么甘氏的技术在交易世界中仍然具有影响力。 甘氏策略围绕着高度准确地预测市场走势,而该工具将这种力量带到了您的指尖。无论您是经验丰富的交易员还是新手,操作这些线条将为您提供深入的见解,了解为什么他的方法经得起时间的考验。 基于甘氏久经考验的方法,甘氏的精确目标呈现在您面前。该工具旨在使交易更加顺畅和直观。通过向上拖动白线或向下拖动绿线,您将立即明白为什么甘氏的技术在交易世界中仍然具有影响力。 甘氏策略围绕着高度准确地预测市场走势,而该工具将这种力量带到了您的指尖。无论您是经验丰富的交易员还是新手,操作这些线条将为您提供深入的见解,了解为什么他的方法经得起时间的考验。

基於江恩理論手動建構修正區域的指標。這些區域是透過數學計算確定的,使用從 M1 開始到 D1 結束的不同時間範圍的特殊係數。此指標適用於貨幣對和金屬,以及加密貨幣甚至股票
利用該指標,您可以根據市場週期輕鬆建立購買/銷售支援區域,並在接近這些區域時做出交易決策。
這將使您了解從買入/賣出支撐區域的價格變動方向。
另外,借助該指標,您可以確定上升/下降週期的中斷並確定切入點。
適合剝頭皮交易、短期交易和中期交易。這完全取決於您的交易風格。
非常容易使用。僅使用四個鍵即可建造區域。
區域是根據圖表上突出的高點/低點手動建立的
若要建立購買支撐區域,您需要將滑鼠遊標放在明確定義的高點上,然後按「2」鍵。 在圖表上安裝兩個指標副本,使用當前時間範圍的設定和下面時間範圍的設定來比較價格走勢,因為 m1 上可能有一個上升週期,而 m5 上可能有一個下降週期,反之亦然
若要建立銷售支撐區域,您需要將滑鼠遊標放在明確定義的低點上,然後按「1」鍵。
為了確定潛在的目標區域,使用鍵“3” - 從低到高表示目標購買區域,使用鍵“4” - 從高到高表示目標銷售區域。
您所需要的只是一個乾

Please follow the "How To Trade" instructions exactly for best results Wycoff theory is vastly used by institutional traders but when it comes to retail traders the concept isn't well understood by most. It is even more difficult to implement in intraday & swing trading. This No REPAINT indicator helps you in analyzing the market cycles and plots buy/sell signals at the start of trending phase. It studies the market strength of bulls and bears and does a effort Vs reward matrix calculation befor

此指标适用于实时图表,不适用于测试器。 PRO Trend Divergence 指标是一款先进的技术分析工具,专注于检测 趋势延续背离 ,这是一种表明当前趋势可能会持续的信号。与传统指标强调趋势反转不同,这款工具帮助交易者识别趋势依然强劲的市场状态,即使在短暂回调或小幅调整时也是如此。 趋势延续背离 出现在价格沿趋势方向移动时(上升趋势中的更高低点或下降趋势中的更低高点),但所选指标却出现背离,确认趋势可能继续。 PRO Trend Divergence 指标使交易者能够自信地跟随趋势,减少过早退出的风险。 特点与优势 多指标支持
支持 MACD、RSI、Stochastic、CCI、Momentum、OBV、VW-MACD、CMF 和 MFI。 图表上的可视信号
显示背离线条,并支持颜色和样式的自定义。 关键枢轴点集成
利用关键的高点和低点来优化信号,减少噪音。 灵活高效
提供信号确认、筛选和时间周期选择的自定义参数。

Dark Oscillator is an Indicator for intraday trading. This Indicator is based on Counter Trend strategy, trying to intercept changes in direction, in advance compared trend following indicators. We can enter in good price with this Indicator, in order to follow the inversion of the trend on the current instrument. It is advised to use low spread ECN brokers. This Indicator does Not repaint and N ot lag . Recommended timeframes are M5, M15 and H1. Recommended working pairs: All. I nst
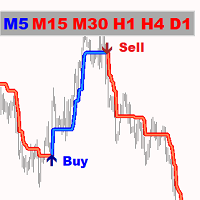
Gold Pointer 是最好的趋势指标。该指标的独特算法分析资产价格走势,考虑技术和数学分析因素,确定最有利可图的入市点,并发出买入或卖出指令信号。
最佳指标信号:
- 卖出 = 红色趋势线 + 红色 TF 指标 + 同方向黄色信号箭头。 - 买入 = 蓝色趋势线 + 蓝色 TF 指标 + 同方向水蓝色信号箭头。
该指标的优点
1. 该指标发出的信号准确度高。 2. 该指标的确认信号不会消失,也不会重新绘制--在确认信号(箭头)后会发出声音警报(警报与信息)。 3. 您可以在任何经纪商的 MetaTrader 4 交易平台上进行交易。 4. 您可以交易任何资产(货币、金属、加密货币、股票、指数等)。 5. 您可以在任何时间框架内进行交易(M5-M15 缩放交易/M30-N1 中期交易/H4-D1 长期交易)。 6. 可在指标设置中更改个别参数(颜色、大小等),以便每位交易者都能轻松调整指标,满足自己的需求。 7. 该指标既可作为交易系统的基本补充,也可作为独立的交易系统使用。 8. 在图表上,无论指标设置在哪个时间框架上,它都会显示六个时间框架(M5 M15 M30

WaveTrend Momentum Oscillator is an upgrade to the popular and easy-to-use WaveTrend Oscillator. The WaveTrend Momentum Oscillator adds a momentum component to the original WaveTrend calculation, in order to provide faster and more accurate entry points during trendy market conditions. Do you prefer the original WaveTrend Oscillator? The WaveTrend Momentum Oscillator allows you to switch between momentum and original WT versions. Both provide valuable information depending on the market conditio

该指标通过忽略突然的波动和市场噪音,以无与伦比的可靠性跟踪市场趋势。它被设计用于趋势交易日内图表和较小的时间范围。其获胜率约为85%。 [ 安装指南 | 更新指南 | 故障排除 | 常见问题 | 所有产品 ] 极易交易 查找超卖/超买情况 随时享受无噪音交易 避免在盘中图表中被鞭打 该指标分析其自身的质量和性能 它实现了一个多时间仪表板 该指标适用于低时限交易,因为它通过降低平均价格周围的市场噪音而忽略了突然的价格飙升或修正。 该指标根本不需要优化 它实现了一个多时间仪表板 它实现了电子邮件/声音/推送警报 指示器为不可重涂和不可重涂 该指标实现了适合于较小时间范围的趋势跟踪方向,该趋势可以渗透到较高时间范围内的非常长的趋势中,从而扩大了您的收益。
指标剖析 指标显示一条彩色的线,周围环绕着一个价格带。彩色线是有价证券的平均价格,而价格带表示超买/超卖水平。如果平均价格为蓝色,则您应该在市场没有超买的情况下寻找多头交易;如果平均价格为红色,则应该在市场没有超卖的情况下寻找空头交易。 指标的趋势变化并不表示立即进行交易或完成相反交易的信号!这些频段用于计时。
技术信息
指标的评估

Description: The Range Breakout Catcher Indicator is a powerful tool known for its non-repainting, non-redrawing, and non-lagging capabilities, making it suitable for both manual and robot trading. This indicator utilizes a smart algorithm to calculate ranges and generate early signals for Buy and Sell positions at the breakout of these ranges, facilitating the capture of trends during ranging consolidations. The range calculation involves a comprehensive system based on various elements, prov

Take Your Trading Experience To the Next Level ! and get the exclusive TFSR-Analyzer for free ! So you have all these outstanding features on up to 20 symbols and all timeframes in a smart and clear Design.
Correct identification of the trends in stock investments are pivotal and TrendFollowerSR ensures this perspective while displaying the correct trend on multiply timeframes to help you go long way as much as possible. The latest technology of the Indicator enables to track whether if a
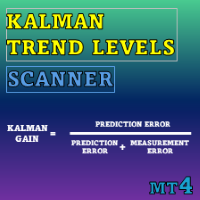
Special offer : ALL TOOLS , just $35 each! New tools will be $30 for the first week or the first 3 purchases ! Trading Tools Channel on MQL5 : Join my MQL5 channel to update the latest news from me Kalman Trend Levels 是一种先进的趋势跟踪指标,利用尖端的卡尔曼滤波技术,为交易者提供强大的分析信号。该工具设计精确且具有适应性,不仅能够识别关键的支撑和阻力区域,还提供全面的市场动量和趋势变化分析方法。 查看 MT5 版本: Kalman Trend Levels MT5 查看更多产品: All Products See more detailed explanation of Kalman Filter logic in this indicator here: Kalman Filter Logic in Trend Detection

Pipfinite creates unique, high quality and affordable trading tools. Our tools may or may not work for you, so we strongly suggest to try the Demo Version for MT4 first. Please test the indicator prior to purchasing to determine if it works for you. We want your good reviews, so hurry up and test it for free...we hope you will find it useful.
Combo Energy Beam with Swing Control Strategy: Confirm swing pullback signals Watch Video: (Click Here) Energy Beam with Trend Laser Strategy: Confirm Tre

Reversal Pattern AI is a groundbreaking advancement in indicator development, combining artificial intelligence algorithms, multi-level market analysis, and classical technical analysis methods. It not only detects reversal patterns but also evaluates market inefficiencies, generating highly accurate trading signals.Thanks to its hybrid model, which utilizes price action analysis, volume, volatility, VWAP, and Volume AVG %, the indicator easily adapts to any market conditions. Reversal Pattern A

The "Nostradamix" indicator is designed to analyze short-term market movements on lower timeframes (e.g., M1), while simultaneously considering trend direction on higher timeframes (e.g., M30). This tool identifies key trend reversal points, displays volatility levels, and generates buy/sell signals based on market dynamics. The indicator automatically plots: Current trend lines. Volatility bands to assess movement strength. Visual markers (arrows) for entry signals. Forecast Accuracy and Mathem

** All Symbols x All Timeframes scan just by pressing scanner button ** *** Contact me to send you instruction and add you in "ABCD scanner group" for sharing or seeing experiences with other users. Introduction This indicator scans AB=CD retracement patterns in all charts. The ABCD is the basic foundation for all harmonic patterns and highly repetitive with a high success rate . The ABCD Scanner indicator is a scanner reversal ABCD pattern that helps you identify when the price is about to ch

The NASDAQ 100 Power Indicator serves with TREND and trend reversals indication using automated arrows that indicates buy or sell at that price and has built-in signal provider across all time frames with alerts and provides also the automated support and resistance that can draw technical analysis patterns like double bottom, double top, head and shoulders etc. using closing and open prices, in assistance for if a trader did not see the pattern sooner for their technical analysis. The indicator
MetaTrader市场是独有的自动交易和技术指标商店。
阅读MQL5.community用户备忘更多地了解我们提供给交易者的独特的服务:复制交易信号,自由职业者开发的自定义应用程序,通过支付系统完成的自动付款和MQL5云网络。
您错过了交易机会:
- 免费交易应用程序
- 8,000+信号可供复制
- 探索金融市场的经济新闻
注册
登录