适用于MetaTrader 4的付费技术指标 - 13

Imbalance / Fair Value Gap (FVG), this is a zone / gap created when the price move with force in a given direction. It identify a zone where the price could potentially go back. This gives perfect targets for your trades.
Imbalance is created from the high and low of 3 candles. When the wicks the of 1st and 3rd candle does not fully overlap the middle one.
This indicator will help you to easily spot mitigated/unmitigated imbalances in your chart.
NEW FEATURE Update: Multi-TimeFrame Feat

Looking for an indicator that identifies high-probability price action patterns? Love counter-trend trading? The Kangaroo Tailz indicator might be just for you. This indicator is meant to be used as a reversal detector. I personally would rather enter a position at the beginning of a trend rather than catch the last couple of moves. This indicator does a good job of alerting when price may reverse by identifying price action patterns that occur frequently in markets. Even though this indicator i

GOLDEN RETRACEMENT POWER indicator draws fibonacci levels automatically. Defines the golden entry buy/sell area, support and resistant lines , signals arrows and strength 'Power Bars Level' based on price action . Some indicators also work behind the chart: Stochastic,RSI,MFI,DeMarker and WPR . Fibonacci retracements are a popular form of technical analysis used by traders in order to predict future potential prices in the financial markets. If used correctly, Fibonacci retracements and ratios c

Title: Best Trend Sniper Indicator - A Custom MQL4 Indicator for Spotting Potential Trends Description: Indicator Name: Best Trend Sniper Indicator Introduction: The "Best Trend Sniper Indicator" is a custom Meta Quotes Language 4 (MQL4) indicator designed to identify potential trends in financial markets. This indicator is intended to be used on Meta Trader 4 (MT4) trading platforms. Key Features: Non Repaint: The Best Trend Sniper Indicator is a non-repaint indicator, which means it does not

Wicks UpDown Target
Choppy movement up and down on the opening range every day. Trading breakouts on London session and New York session is recommended. Wicks UpDown Target is specialized in all forex pairs.
Guideline Entry Strategy Idea:
Step 1 - Breakout Forming (Warning! Trade on London Session and New York Session) Step 2 - Breakout Starting (Take Action on your trading plan) Step 3 - Partial Close your order & set breakeven (no-risk) Step 4 - Target complete Step 5 - Don't trade in
MT5 Version
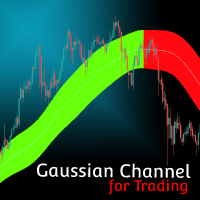
Gaussian Channel MT4 Gaussian Channel MT4 is the first indicator in the market that uses Ehlers Gaussian Filter methods to define trends. Nowadays, this Gaussian Channel is highly known as a method to support HOLD techniques in crypto. If the price is above the channel the trend is strong, if it comes back to the channel this can react as a resistance and indicate the beginning of a bear market (or Winter) if the price breaks below it. Eventhough the use of this channel focuses on
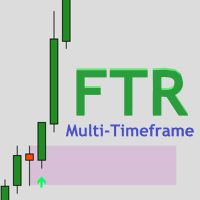
The FTR Multi-Timeframe indicator is a versatile tool that can add great value to your trading arsenal. This indicator is intended to be used to add confluence to your already existing trading strategy, such as, breakout & retest, supply and demand, patterns or continuation trading. FTR Multi-Timeframe is a continuation indicator. Rules are attached as a screenshot.
Settings for Demo/Strategy Tester: Set Server_Time_Filter to false in indicator settings ( IMPORTANT! ). Tick 'Show object desc
30% discounted ONLY 10 COPIES HURRY UP! 5 LEFT COPIES All Features now have in current version. Very precise patterns to detect High Accurate Order Blocks: It Draw zone after market Structure Breakout with a high Accuracy, institutional orders with the potential to change the price’s direction and keep moving towards it, have been placed. Features Auto Order Blocks Draw Market Structure BOS LINE Auto Imbalance Detect Auto Trend Detect MTF Order Blocks Double Signal One Alert Signal Second Lo

Description
Volume Magic is an indicator that shows the value of the relative volume in conjunction with the direction of the current trend. The ratio of the current volume relative to the average volume for a certain period is displayed in the lower window as an oscillator. The direction of the current trend is displayed as two-color trend lines.
How to use?
First, use two-color trend lines to determine the direction of the current trend. Then look for areas of low volume and open positi

This indicator discovers and displays the Supply and Demand zones on the chart. MT5 Version This indicator finds and displays supply and demand zones in both scalping and long-term modes based on your trading strategy. Also, the dashboard scanner mode helps you to check all the desired symbols at a glance and not to miss any suitable position. Some features of this indicator Two modes: Current and Dashboard [input: Indicator Mode] Trading Style: Scalping / Long-Term [i

Chart Patterns Detect 15 patterns (Ascending Triangle, Descending Triangle, Rising Wedge, Falling Wedge, Bullish Flag, Bearish Flag, Bullish Rectangle, Bearish Rectangle Symmetrical triangle, Head and Shoulders, Inverted Head and Shoulders, Triple top, Triple Bottom, Double Top, Double Bottom) Use historical data to calculate the probability of each pattern to succeed (possibility to filter notification according to the chance of success) gives graphic indication about the invalidation level and

Precision Trading Systems的PTS Demand Index代码
Demand Index是James Sibbet的创作,使用复杂的代码来简化对成交量和价格组合的解释工作。
理解成交量从未是一项容易的任务,但这个美丽的编程作品确实让这项工作变得更加轻松。
这个指标有几种方式可以使交易者和投资者受益匪浅。
背离(作为领先指标) 多年来,我研究了许多技术指标,我认为Demand Index是发现有意义的背离的佼佼者之一。
如果市场价格创出新高,而Demand Index没有创出新高,这被称为熊市背离。在我的网站上有几张极端背离案例的照片,可以帮助您理解要寻找什么。背离的差异越大,从趋势变化事件的预测角度来看,它就越重要。
趋势检测(作为滞后指标,带有内置的警报功能) 零线的交叉表示在您指定的长度内进行净卖出或净买入的迹象,必须注意,在这种情况下,该指标充当滞后指标,并且需要更长的长度以及一些平滑来提供有意义的结果。我建议为此目的使用至少>40的长度,添加一些平滑>5以减少虚假信号。
要启用零线交叉的警报,请单击指标属性
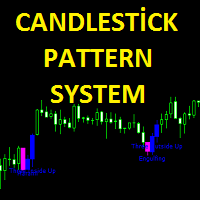
Candlestick pattern system finds 40 candle formations. Features Has the feature to send the notification. It has candlestick patterns feature. Bullish patterns feature. Bearish patterns feature. Trend filter and reliability features.
Parameters Show alert - Send alert Send email - Send alerts to mail address. Look back - Retrospective calculation === PATTERN SETUP === Show bullish patterns - Open close feature Show bearish patterns - Open close feature Trend filter - Open close feature

Supertrend indicator uses a combination of a moving average and average true range to detect the trend of a trading instrument.
Supertrend indicator for MetaTrader 5 easily shows the trend as a line following the price.
USAGE THIS INDICATOR If the closing prices are above Supertrend Line, there is a Bullish sentiment at that moment. The opposite is a Bearish sentiment. Three green lines - Strong Bullish sentiment. Three red lines - Bearish sentiment.
For BUY : - Three green lines and pr
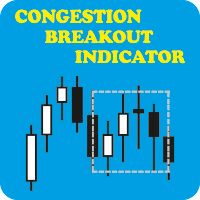
CONGESTION BREAKOUT INDICATOR: When you see a sideways price movement in a meaningless market, what goes through your mind? Is it a danger, an opportunity or completely a vacuum? Let's see if we can avoid the latter and focus on using it to our advantage. The ability to read price action through the display of rectangles on the chart could be the boost you need to achieve your trading goals. What is congestion? Congestion is a market situation where the price is trading around a particular leve

I developed a special algorithm indicator
Indicator EXACTLY-SR-LEVELS looks for confluence of at least two combination algorithm levels (day+week,day+mont,day+year, week+month, week+year,month+year)
LEVELS ARE NOT REDRAWN IF THE NEW HIGH / LOW INDICATOR IS CALCULATING NEW LEVELY AND DRAWS IN THE GRAPH
On a new low/high day - the S/R day is recalculed. On a new low/high week - the S/R week is a recalculed On a new low/high month - the S/R month is a recalculed On a new low/high year - the
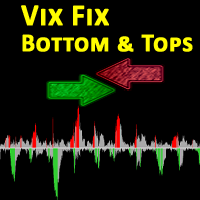
The VIX Fix is a volatility indicator developed by renowned trader Larry Williams. It's designed to measure volatility in assets that don't have options or futures, such as individual stocks and forex markets. Essentially, it acts as a synthetic VIX (Volatility Index) for any asset , providing a gauge of market uncertainty. This modified version of William's indicator helps you to find market bottoms and market tops. It comes with 2 styles: Stochastic and histogram style. Please see screenshot

MT5 Version Kill Zones
Kill Zones allows you to insert up to 3 time zones in the chart. The visual representation of the Kill Zones in the chart together with an alert and notification system helps you to ignore fake trading setups occurring outside the Kill Zones or specific trading sessions. Using Kill Zones in your trading will help you filter higher probability trading setups. You should select time ranges where the market usually reacts with high volatility. Based on EST time zone, followi
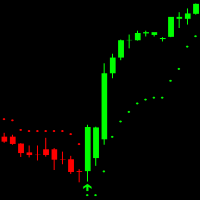
Easy Trend Indicator can be used for all forex pairs, indices and cryptocurrencies. It´s a non rapainting Trend trading indicator and works on all timeframes. GREEN candles show an uptrend and RED candles show a Downtrend. Arrows show when to enter the Market. Indicator has 7 Inputs: Max History Bars = On how many Bars in the Chart the indicator is drawn ATR Period = How many Bars are used for Average True Range calculation ATR Multiplier = Is used for Indicator sensitivity (Higher multiplier =

A trend indicator based on the CCI indicator. ZI Trend PaintBar Indicator is an improved variant of the CCI indicator, which shows the moment of trend following quite accurately. Combination of CCI indicator makes a better use of these advantages: Colored candlesticks showing the trend direction based on CCI indicator. Messages/Sounds (Notifications and sound settings) Mail - enable/disable sending emails. Alerts - enable/disable messages in the terminal when signals occur. Push - enable/disable

The principle of constructing indicator lines . Profit Trade indicator is very effective for trading. Profit Trade is a deep development of the well-known Donchian channel indicator. The upper (BlueViolet color) Dup and the lower (IndianRed) Ddn lines of the indicator are constructed in the same way as in the Donchian channel , based on the highest (high of High) and lowest (low of Low) prices for the previous n1 = 20 periods. The middle line (Gold) Dm is constructed in the sam

The indicator displays a matrix of indicators across multiple timeframes with a sum total and optional alert. Custom indicators can also be added to the matrix, in a highly configurable way. The alert threshold can be set to say what percentage of indicators need to be in agreement for an alert to happen. The alerts can turned on/off via on chart tick boxes and can be set to notify to mobile or sent to email, in addition to pop-up. The product offers a great way to create an alert when multiple

I present an indicator for professionals. ProfitMACD is very similar to classic MACD in appearance and its functions . However, ProfitMACD is based on completely new algorithms (for example, it has only one averaging period) and is more robust, especially on small timeframes, since it filters random price walks. The classic MACD indicator (Moving Average Convergence / Divergence) is a very good indicator following the trend, based on the ratio between two moving averages, namely the EM
Hello dear friend! Here's my story. I'm fast. After many attempts to trade manually, I decided to use expert. I started writing my robot. But testing took a lot of time! In parallel, I tried other people's robots. And again I spent a lot of time testing. Night scalpers, news scalpers, intraday scalpers, and many other classes... you needed to know exactly when the robot was trading, when it was making a profit, and when it Was losing. Some robots have time-based trading features that are not de

The indicator compares quotes of the current symbol and a synthetic quote calculated from two specified referential symbols. The indicator is useful for checking Forex symbol behavior via corresponding stock indices and detecting their convergence/divergence which can forecast future price movements. The main idea is that all stock indices are quoted in particular currencies and therefore demonstrate correlation with Forex pairs where these currencies are used. When market makers decide to "buy"

MultiCurrencyWPR (MCWPR) indicator applies conventional WPR formula to plain Forex currencies (that is their pure strengths extracted from Forex pairs), market indices, CFDs and other groups of tickers. It uses built-in instance of CCFpExtraValue to calculate relative strengths of selected tickers. Unlike standard WPR calculated for specific symbol, this indicator provides a global view of selected part of market and explains which instruments demonstrate maximal gain at the moment. It allows yo

Currency Power Meter shows the power of major currencies against each other. The indicator shows the relative strength of currency/pair at the current moment in a period of time (H4, daily, weekly, monthly). It is useful for day traders, swing traders and position traders with suitable period options. Currency power is the true reason of market trend: The strongest currency against the weakest currency will combine into a most trending pair. As we know, trend makes money and all traders love tre
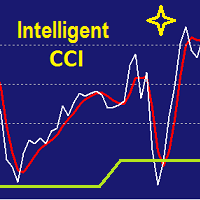
It is CCI indicator with very smooth and noiseless movement that calculates four levels of buy, sell, overbought and oversold dynamically. Professional traders know well that level of 100, 200 or -100 and -200 are not always right and need fine adjustments. This indicator calculates those levels dynamically by using mathematics and statistic methods in addition to shows divergence between indicator and price. Like original CCI, for best result you have better to set proper value for CCI period b

「趨勢反轉ml4」是一個獨特的指標,旨在即時確定價格反轉的時刻。 這是Metatrader4現成的交易系統。 該指標不會重繪其值! 該指標基於先進的演算法和技術分析,為您提供有關可能的市場進入和退出點的清晰訊號,幫助您做出明智的決策。
此指標的優點: 訊號精度高。 指標本身向交易者顯示其配置是否正確。 在零蠟燭附近,指標繪製總計值。 如果該值為負,那麼您需要調整指標設置,如果該值為正,則表示設定選擇正確,您可以開始交易。 此指標不會重繪其值。 此指標可用於所有時間範圍和所有貨幣對。 這是一個現成的交易系統。
特點:
反轉箭頭: 紅色箭頭清楚地表明可能的開倉賣出交易點,警告即將到來的價格下跌。 藍色箭頭突出顯示了開啟買入交易的區域,表明可能出現上漲趨勢。
多時期分析: 此指標支援多個時間間隔的分析,使您能夠考慮不同時間等級的趨勢和反轉。
各種市場條件下的應用: Precision Reversal Pro 策略是基於對波動性和流動性的仔細研究,使其成為平靜和活躍市場條件下的有效工具。
設定的靈活性: 此指標可讓您根據您的喜好和交易風格自訂參數
使用方便: 輕

The EasyTrend is a seemingly simple but quite powerful trend indicator. Everyone has probably come across indicators or Expert Advisors that contain numerous input parameters that are difficult to understand. Here you will not see dozens of input parameters, the purpose of which is only clear to the developer. Instead, an artificial neural network handles the configuration of the parameters.
Input Parameters The indicator is as simple as possible, so there are only 2 input parameters: Alert -

The Professional Signal that A Swing / Daily / Scalping / Binary Options trader MUST HAVE ! Suitable For ALL kind of Financial Instruments (FX Currencies, Commodities, Indices, Stock CFDs and Crytocurrencies) For the last 12 years, Our team has studied on the price action of currency pairs and created an innovation of signal indicator based on the AI technology. Based on know-how of the professionals, we have designed a AI deep-learning model and tuned the model by learning fro

Universal author's strategy, allows to determine the entry points for Buy and Sell both in the direction of the trend, on the reversals of trends and in the flat market. The indicator is equipped with a unique scanner which each tick analyzes the price chart, calculates optimal levels and patterns for finding entry points by one of the 3 strategies. Each of the strategies combines author formulas and algorithms, for optimal trading we recommend using 3 strategies simultaneously as they are compl
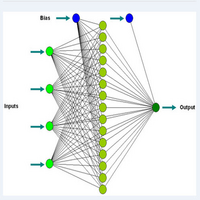
更新!箭头被添加到 100 和 200 级别。
该指标可准确访问极端情况,并主要支持 1 分钟时间范围内的买入头寸。可以使用其他时间范围,但级别不同。它是一个更好的振荡器,并与其他振荡器进行比较以查看差异。
使用神经网络概念的日间交易。该指标使用神经网络的基本形式来生成买卖信号。在 1 分钟图表上使用该指标。指示器不会重新绘制。下载并使用 1 分钟图表或其他使用不同级别的图表在测试仪上运行,分析交易以亲自查看。剥头皮市场的许多机会。可用于更高的时间范围,但应根据您的判断更改水平。较高的时间范围具有较高的范围。
使用此模型要考虑的概念和事项:
使用了多个指标,应用了权重,最大值和最小值为 2 个数据点。该指标主要用于交易上升趋势在振荡器的设置(见图)100 和 200 中添加级别,如果使用不同的时间框架,则添加其他级别。
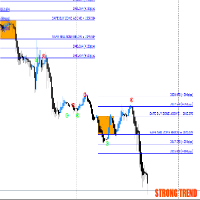
Introducing Breakout scalper system(BSS), an innovative and robust trading solution designed to elevate your trading experience to new heights. This sophisticated MetaTrader 4 compatible system is meticulously crafted to empower traders with precise buy and sell levels, strategic targets, and timely signals, all delivered with utmost accuracy and efficiency. Key Features: Buy and Sell Levels: Gain a competitive edge with carefully calculated buy and sell levels, providing you with clear entry an

Description
SuperCCI is an indicator based on the standard CCI indicator. It identifies and displays convergences/divergences in the market and forms the corresponding entry points. Also, using the trading channel index, it determines the direction of the trend and displays the levels of support and resistance .
Features Not repaint. Shows entry points. Shows the direction of the current trend and support/resistance levels. Has notifications. Recommendations
Use convergence/divergence to

This is first public release of detector code entitled "Enhanced Instantaneous Cycle Period" for PSv4.0 I built many months ago. Be forewarned, this is not an indicator, this is a detector to be used by ADVANCED developers to build futuristic indicators in Pine. The origins of this script come from a document by Dr . John Ehlers entitled "SIGNAL ANALYSIS CONCEPTS". You may find this using the NSA's reverse search engine "goggles", as I call it. John Ehlers' MESA used this measurement to

The Fair Value Gap (FVG) is a price range where one side of the market liquidity is offered, typically confirmed by a liquidity void on the lower time frame charts in the same price range. Price can "gap" to create a literal vacuum in trading, resulting in an actual price gap. Fair Value Gaps are most commonly used by price action traders to identify inefficiencies or imbalances in the market, indicating that buying and selling are not equal. If you're following the ICT Trading Strategy or Smart
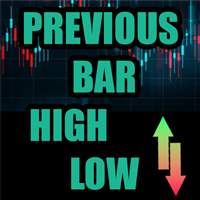
该指标最多绘制 6 个级别,可以根据交易者的要求启用/禁用以使图表更清晰
这 6 个级别分为 2 组:高和低
对于每组,可以选择不同的时间范围
它基于先前高低反转的策略,因为它认为当价格达到每日、每周或每月高低时,价格通常会在更小的时间范围内(如 5 分钟)显示拒绝
特征 :
- 在单个图表中跟踪多达 6 个时间帧高低点
- 在这些级别设置警报,邮件、推送或终端警报,当价格触及这些级别时,您将立即收到警报
- 自定义关卡样式,包括线条样式、宽度、颜色等
- 班次:想要跟踪或研究第 2 天或第 3 天的高低?您可以将 shift 设置为 2 用于 2nd Bar 的 High Low 或 3 设置为 3rd Bar 的 High Low 等等。
该指标最多绘制 6 个级别,可以根据交易者的要求启用/禁用以使图表更清晰
这 6 个级别分为 2 组:高和低
对于每组,可以选择不同的时间范围
它基于先前高低反转的策略,因为它认为当价格达到每日、每周或每月高低时,价格通常会在更小的时间范围内(如 5 分钟)显示拒绝
特征 :
- 在单个图

配备胜率计算系统的指标 【指标特点】 该指标可以让您直观、轻松地通过信号信号确认常规技术分析。 此外,它可以检查当前参数的胜率,并包括自动胜率确定系统,避免在胜率较低时发出信号。 这减少了不必要的入场,并允许您仅在胜率较高时进行交易。
[重要笔记] ・没有重新涂装。 它可以在 1 分钟到每周的时间范围内使用。 ・没有货币限制。 它可以与所有货币对一起使用。 ・可以计算胜率。 ・仅当达到或超过预定义的胜率时才会生成信号。 ・实现轻负载! 适合长期使用和9种货币对同时使用。 ・由于它是众所周知的指标,因此您可以在观察信号的同时进行学习。 ・调试已完成(由调试器验证是否存在任何问题)。
【MACD箭头信号解释】 MACD(移动平均趋同分歧)箭头信号指标对于交易者来说是非常有用的工具。 它衡量市场动力和趋势强度,从而能够识别进入点和退出点。
[特征] 通过观察移动平均线(短期 EMA 和长期 EMA)的交叉,它表明市场方向的变化并指示进入点。 直方图代表市场动量,使您可以评估趋势市场的强度。 箭头信号直观地提供了进入点和退出点。
[优点] ・对市场转折点敏感并确认强劲趋势
TrendLines Plator:利用先进的趋势投影指标优化您的交易策略 探索我们创新指标的潜力!该指标具备在您当前时间段内直接分析和预测更长时间框架的趋势线的能力,为普通交易者提供战略性支持。这些点将成为您交易中强大的支撑或阻力水平,增强您的交易策略。 想象一下拥有这样一款能够与您的价格行动指标完美融合的指标。我们创新指标填补了这一空白!试用它,您将惊叹于其准确性。它可能成为提升您策略并推动您业绩的关键要素。 别错过这个机会!立即抓住将这款令人惊叹的工具纳入您的交易资源中的机会。如果您认识到它的价值和潜力,请毫不犹豫地在今天获取它。提高您的交易准确性,实现新的成功高度,这款高性能指标将助您一臂之力! 关注我们的最新消息 立即订阅以获取我们独家发布的最新产品。将 Francisco Gomes da Silva 添加为好友,独享我们的新品发布。 别再浪费时间! 立即下载我们的 Metatrade指标 ,仅需几秒钟即可获得准确高效的市场分析。 同样适用于您的MT4平台 如果您正在寻找类似于MT5的工具,您可以从以下链接下载: Trendlines Plator MT5 。

Description
The base of this indicator is an ZigZag algorithm based on ATR and Fibo retracement. The ZigZag can be drawn like a classic ZigZag or like Arrows or needn't be drawn at all. This indicator is not redrawing in sense that the ZigZag's last shoulder is formed right after the appropriate conditions occur on the market. The shoulder doesn't change its direction afterwards (can only continue). There are some other possibilities to show advanced information in this indicator: Auto Fibo on

All patterns from Encyclopedia of Chart Patterns by Thomas N. Bulkowski in one indicator. It draws an up or down arrow whenever a pattern is identified. Patterns are selected in the drop-down list of the Pattern variable (located at the beginning of the properties window). The indicator has numerous external parameters, some of them apply to all patterns, while others are selective. To see more information on the parameters used for the selected pattern, enable the ShowHelp variable (located at
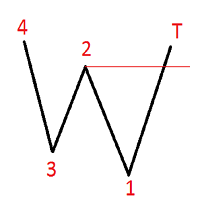
ZigZag Alert 该指标基于标准之字折线。
显示在图表上并表示某种形态的出现。
根据用户的选择,指示信号显示在终端中,或发送电子邮件至该地址,
或向移动终端发送通知。 向上运动信号的形态条件:
第 4 点的价格必须高于第 2 点的价格,T 点的价格必须高于第 2 点的价格。
向下移动时,相反,向上移动。
指标设置说明: InpDepth - 之字折线深度指标的设置 InpDeviation - 设置之字折线偏差指标 InpBackstep - 设置 ZigZag Backstep 指标 _Alert - 在终端中启用或禁用通知 _SendMail - 启用或禁用电子邮件通知 _SendNotification - 在移动端启用或禁用通知 主题 - 电子邮件标题 TextDown - 向下移动信号文本 TextUp - 向上运动信号的文本
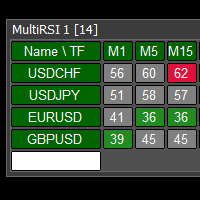
This tool monitors RSI indicators on all time frames in the selected markets. Displays a table with signals to open a BUY trade (green) or SELL trade (red). You can set the conditions for the signal. You can easily add or delete market names / symbols. If the conditions for opening a trade on multiple time frames are met, you can be notified by e-mail or phone message (according to the settings in MT4 menu Tools - Options…) You can also set the conditions for sending notifications. The list of s

使用 WolfeWaveBuilder 指标加入交易! 这是专门为获得最成功和最有利可图的投资决策而创建的独特工具。 它是真实账户的理想选择,并受益于经过全面测试和几乎有保证的交易策略。 不要错过你的机会! 开始使用 WolfeWaveBuilder 指标赚钱交易!
MT5版本 https://www.mql5.com/ru/market/product/82360
指标特点
为 Wolfe Waves 策略提供信号。 显示趋势。 自 1980 年以来一直使用的行之有效的策略! 简单的进入信号。 不重绘也不滞后。 有声音信号,E-Mail 和电话上的通知。
操作说明
等到箭头出现,终端中出现消息或通知邮件,电话。 你打开一个交易。 建议在价格越过 1-4 线时出场。 为了更好地理解策略,建议阅读理论。
基本设置
High_period - 用于计算高周期模型的最小柱数 Low_period - 用于计算低周期模型的最小柱数 Trigger_Sens - 计算
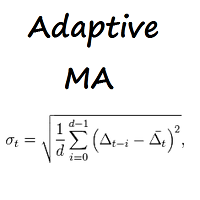
Adaptive MA 移动平均线。计算方法是柱形定义中使用的所有价格的平均值。
指标外部设置说明: MA_period - 计算指标的平均周期。推荐值:5、13、21、34。 ma_method - 平均方法。可以是任何移动平均法值。 0 - (SMA) 简单移动平均线。 1 - (EMA) 指数移动平均线。 SMMA 2 - (SMMA) 平滑移动平均线。 LWMA 3 - (LWMA) 线性加权移动平均线。 移动平均线。计算方法是柱形定义中使用的所有价格的平均值。
指标外部设置说明: MA_period - 计算指标的平均周期。推荐值:5、13、21、34。 ma_method - 平均方法。可以是任何移动平均法值。 0 - (SMA) 简单移动平均线。 1 - (EMA) 指数移动平均线。 SMMA 2 - (SMMA) 平滑移动平均线。 LWMA 3 - (LWMA) 线性加权移动平均线。

这是一个 MTF 指标,它基于 带有价格标签的 Advanced ZigZag Dynamic 和/或 Extended Fractals 指标极值(可以禁用)。可以为 MTF 模式选择更多更高的 TF。默认情况下,级别是基于 ZigZag 指标点生成的。分形指标点也可以与 ZigZag 一起使用或代替它。为了简化使用并节省 CPU 时间,每根柱线在开盘时执行一次计算。 参数: ForcedTF - 水平计算的图表时间范围(可能等于或超过当前时间) MinPipsLevelWidth - 以点为单位的最小关卡宽度(用于非常紧凑的关卡) Use ZigZag Extremums points - 启用/禁用使用 ZigZag 峰值计算支撑/阻力水平 Fixed pips range - 计算 ZigZag 指标的最小值和最大值之间的距离 UseDynamicRange - 启用/禁用 ZigZag 指标最小值和最大值之间距离的动态计算 Dynamic volatility period - 用于计算 ZigZag 指标最小值和最大值之间的动态距离的波动期 Dynamic vola

CHART OBJECTS: Blue box : Bullish Order Blocks (OB) Red box : Bearish OB Orange box : Mitigated OB. Price bounce from this area the made a new high/low Light gray box : Price bounced from this area but did not made a new high/low Dark gray box : Broken OB. Filled boxes : TimeFrame 1 Order Blocks
Unfilled boxes : TimeFrame 2 Order Blocks
INDICATOR SETTINGS: Order Block Required Length: Required number of subsequent candles in the same direction to identify Order Block. Default value: 5 Im

The Moving Average Crossover Dashboard indicator is a technical tool that displays the crossovers of 2 selected moving averages on the price chart indicating whether it is a bullish or bearish crossover. In addition, as its name indicates, it shows a signal dashboard that indicates in which market and time frame a crossover of the two moving averages occurs. In the setting window the user can select the markets and time frames that can be displayed on the dashboard. You also have the option

该指标在图表上显示谐波模式,无需以尽可能小的滞后 重新绘制。 指标顶部的搜索基于价格分析的波动原理。 高级设置允许您为您的交易风格选择参数。在蜡烛(柱)开盘时,当新形态形成时,价格变动可能方向的箭头是固定的,保持不变。 该指标识别以下形态及其品种:ABCD、Gartley(蝴蝶、螃蟹、蝙蝠)、3Drives、5-0、蝙蝠侠、SHS、One2One、骆驼、三角形、WXY、斐波那契、振动。默认情况下,设置中仅显示 ABCD 和 Gartley 数字。许多额外的可配置参数。 主要参数: ShowUpDnArrows - 显示/隐藏可能的方向箭头 ArrowUpCode - 向上箭头代码 ArrowDnCode - 向下箭头代码 Show old history patterns - 启用/禁用过时模式的显示 Enable alert messages, actual if history OFF - 启用/禁用模式出现/更改时的警报(仅在禁用历史记录时) Enable alert notification, actual if alert messages is enabled - 模式出现
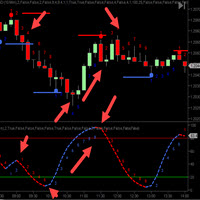
CycleTraderPro电力游戏指标(PPI ) - 是我们最喜欢的指标之一。我们采用所有CT指标并将它们合并为一个指标。 整个指标选择带有开/关功能,这意味着您可以选择自己的指标组合,只绘制这种组合。 我们选择平均混合物。选择5个指标时,PPI会将混合值除以5。 然后,我们绘制每个移动方向的循环计数,以帮助您进入和退出计划的时间。 红色下降,蓝色上升。 它最适合观察趋势和趋势逆转。 输入: 1.首先选择是开启或关闭所有CT指示器 2.显示箭头 - 指示器转动的图表上显示的箭头 - 开/关 3.偏移 - 这告诉图表底池有多远可以绘制转弯箭头。 ----------------- The CycleTraderPro Power Play Indicator (PPI) - is one of our favorite indicators. We take all the CT Indicators and combine them into one indicator.
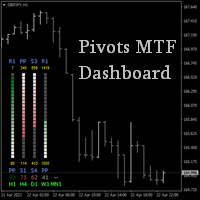
If you trade by levels, then this indicator is for you.
The indicator displays support and resistance levels for the selected timeframes, additionally showing how many points to the nearest levels, as well as between which levels the current price is in the form of a color scale and percentages.
Location anywhere on the chart, the ability to scale, the calculation offset taking into account the hourly difference of your broker, the choice of colors and other parameters will allow you to cus

这个多时间框架和多品种指标识别随机信号线何时与随机主线交叉。作为奖励,它还可以扫描布林带和 RSI 超买/超卖交叉。结合您自己的规则和技术,该指标将允许您创建(或增强)您自己的强大系统。 特征 可以同时监控您的市场报价窗口中可见的所有交易品种。仅将指标应用于一张图表并立即监控整个市场。 可以监控从 M1 到 MN 的每个时间范围,并在识别出交叉时向您发送实时警报。支持所有 Metatrader 原生警报类型。 该指示器包括一个交互式面板。请参阅单独的屏幕截图以进行说明。 指标可以将信号写入一个文件,EA 可以使用该文件进行自动交易。比如 这个产品 。 输入参数
输入参数的描述和解释可以在 这里 找到。 重要的 请注意,由于具有多功能性,既不会在安装指标的图表上绘制买卖建议,也不会绘制线条和箭头。相反,对象将绘制在图表上,当单击图表面板中的信号时会打开图表。 强烈建议将指标放在干净(空)图表上,不要在其上放置任何其他可能干扰扫描仪的指标或智能交易系统。

该指标在图表上显示经济新闻发布的时间表。 新闻是使用免费实用程序加载的,您可以下载 在这里 。 日历在一周开始时加载一次。 您可以自定义所需国家(货币)的列表。新闻分为 4 个重要性类别:高、中、低和其他。默认情况下,该指标显示当周的数据。 指标中有 4 个可用的偏移缓冲区,可在开发“EA 交易”时用作新闻过滤器。 主要参数: Use pure site data - 指标使用原始源数据 Use common folder - 使用公用终端文件夹存放数据文件 Start publication from - 数据显示的开始日期(0 - 当前周),太“远”的日期会导致终端冻结 Currency list - 显示新闻的货币名称,以逗号分隔的货币列表 Create additional text for news - 显示附加信息 Show info before X minutes - 显示 X 分钟前的信息 Show info after X minutes - X 分钟后显示信息 GMT hours offset for broker time - 经纪人时间与 GM

变色K线通道指标 这个指标包括两个部分 部分I : 变色K线标 通过变色K线来指示当前市场状况。如果是青色,则是多头市场,如果是红色则是空头市场。 如果颜色正在交替变化中,最好等它变完后,即等K线收盘。 部分II: 通道指标 通道包括内外两层,内层定义为安全区域,外层用了平仓。 交易策略: 如果是颜色是青色,即多头,等价格位于内层通道时开多,价格触及外层轨道则平仓。 如果颜色是红色,即空头,等价格位于内层通道是开空,价格触及外层轨道则平仓。 提示:当且仅当价格位于内层通道时才入场,这点非常重要。
在EA中调用该指标的参考代码 : https://www.mql5.com/en/blogs/post/730475 参数解释 ShowColorCandle --- true 则画变色K线 BullColor ---Aqua.默认是青色,你也可以选择多头颜色 BearColor --- Tomato.默认是红色,你也可以选择空头颜色 AlertColorChange --- true.当颜色完成变换后会有弹窗报警 EmailColorChange --- true.当颜色完成变换后会

Full Market Dashboard (Multi Pair And Multi Time Frame) : ---LIMITED TIME OFFER: NEXT 25 CLIENTS ONLY ---46% OFF REGULAR PRICE AND 2 FREE BONUSES ---SEE BELOW FOR FULL DETAILS One of the biggest advantages the institutions have, is their access to enormous amounts of data.
And this access to so much data, is one of the reasons they find so many potential trades.
As a retail trader, you will never have access to the same type (or amount) of data as a large institution.
But we created this

Ultimate Divergence Scanner (Multi Pair And Multi Time Frame) : ---LIMITED TIME OFFER: NEXT 25 CLIENTS ONLY ---46% OFF REGULAR PRICE AND 2 FREE BONUSES ---SEE BELOW FOR FULL DETAILS It is a widely known market principle that momentum generally precedes price.
Making divergence patterns a clear indication that price and momentum are not in agreement.
Divergence patterns are widely used by institutional traders around the world. As they allow you to manage
your trades within strictly de

Ultimate Reversal Scanner (Multi Pair And Multi Time Frame) : ---LIMITED TIME OFFER: NEXT 25 CLIENTS ONLY ---46% OFF REGULAR PRICE AND 2 FREE BONUSES ---SEE BELOW FOR FULL DETAILS Reversal patterns are some of the most widely used setups in the institutional trading world.
And the most (statistically) accurate pattern of them all is called the ' Three Line Strike '. According to Thomas Bulkowski ( best selling author and a leading expert on candlestick patterns ),
the ' Three Line Strik

Информационный индикатор, показывающий самые важные торговые уровни для внутридневной торговли, и не только. О понятии уровней «Поддержка» и «Сопротивление».
Всем известно, что исторический ценовой диапазон цен состоит из уровней от которых в прошлом, были значимые движения.
И уровни работающие в прошлом, наверняка будут работать и сейчас. К примеру, уровень, находящийся снизу текущей цены
является уровнем «Поддержки», если от него ранее было значительное движение. К примеру, уровень,

Market Trend Catcher indicator analyzes the duration of trend movements and, with a certain development of the current trend, offers market entry points in the form of arrows with recommended profit targets. The indicator is very easy to use and does not require a lot of information to understand how it works. It has a minimum of settings and is transparent in understanding the principle of its operation, fully displaying the information on the basis of which it makes decisions on recommending e

This is a multi-currency author strategy, designed for trading on the M1, M5, M15, М30, Н1, Н4. Entry points are calculated using custom formulas and algorithms that allow you to effectively determine current trend in the market, obtain the entry points (buy/sell) and the optimal levels to close orders. The Cosmic Diviner Scalper System indicator can be used on any Forex pairs. The detailed guide on how to use the indicator is provided in the blog: https://www.mql5.com/en/blogs/post/719602 A hug
This LEGIT Indicator Can Accurately Predict the Outcome of One Bar.
Imagine adding more filters to further increase your probability!
Unlike other products, Binary Options PRO can analyze past signals giving you the statistical edge.
How Increase Your Probability
Information revealed here www.mql5.com/en/blogs/post/727038 NOTE: The selection of a Good Broker is important for the overall success in trading Binary Options.
Benefits You Get
Unique algorithm that anticipates price weaknes

The indicator (Current Strength) is represented in a separate window by Blue and Pink histogram . The parameter NPeriod represents the number of bars on which we calculate the variation of forces, the recommended value is 5. The Blue histogram measures the buyers force , while the Pink histogram measures the sellers force . The change in color signifies the change in strength which leads t he price . Each drop (especially below 52.8) after touching levels 96.3 or 1.236 must be condidered

隆重推出 Mr. Fibonacci ,这是一个了不起的指标,旨在简化在图表上绘制和调整斐波那契水平的过程。该指标为专业交易者提供特殊的定制选项,使他们能够精确地绘制任何斐波那契水平。此外,它还提供移动通知、电子邮件提醒和价格进入斐波那契水平时的弹出提醒,确保您不会错过潜在的交易机会。 使用此指标,您不再需要持续监控价格走势,直到它触及斐波那契水平。相反,您可以依靠移动通知或电子邮件提醒来随时了解情况。这可以为您节省宝贵的时间,让您可以专注于交易策略的其他方面。此外,斐波那契先生确保斐波那契水平被正确绘制,点对点,这对于准确分析和决策至关重要。 用户友好的界面和快速访问按钮使 Mr. Fibonacci 易于使用和导航。由于其自动调整功能,绘制斐波那契水平变得轻而易举。该指标智能调整每个级别,以适应市场条件的变化。 凭借发送手机、电子邮件和弹出式警报的能力,当价格进入斐波那契水平时,斐波那契先生会通知您。您可以根据自己的喜好和交易风格灵活地激活或停用每种类型的警报。这可确保您以适合您需要的方式接收通知。 斐波那契先生包括技术分析中常用的最重要的斐波那契水平。此外,它还提供自定义选
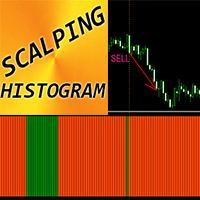
MT4 外汇指标“剥头皮直方图”
倒卖直方图指标可用于在小幅价格调整后寻找进入主方向价格动量的入场信号 倒卖直方图有两种颜色:橙色表示看跌动量,绿色表示看涨动量。 一旦您看到至少 10 个相同颜色的连续直方图条,就意味着出现了强劲的势头 入场信号是直方图中具有相反颜色的一列,下一列具有初始动量颜色(参见图片) 使用倒卖目标 - 图表上最接近的高点/低点 指示器内置移动和 PC 警报 如何使用指标: - 对于买入信号:至少 10 个连续的绿色直方图条(动量)+ 直方图上的 1 个橙色条(修正)+1 个绿色条(在此处打开多头交易) - 对于卖出信号:至少 10 个连续的橙色直方图条(动量)+ 直方图上的 1 个绿色条(修正)+1 个橙色条(在此处打开空头交易)
// 这里提供更多优秀的 EA 交易和指标: https://www.mql5.com/en/users/def1380/seller // 也欢迎您加入盈利、稳定、可靠的信号 https://www.mql5.com/en/signals/1887493 它是仅在该 MQL5 网站上提供的原创产品。

Are you a day/week/month trader, or even a quick scalper? MCTS will show you the best trending currencies to trade on any timeframe. By using a unique algorithm MCTS measures the strengths of individual currencies and then combines them into pairs to show you the best pairs to trade. Monitor all 8 major currencies and all 28 pairs. Monitors the strengths of the following currencies: EUR, USD, GBP, JPY, AUD, NZD, CHF, CAD. Measure the true strength of a currency on any timeframe. Know which curre
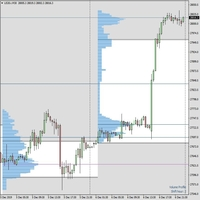
您好亲爱的商人。 我从事交易已有10年了,我认为市场概况是成功进行长期交易的一种方法,并且不会让人头痛。该系统更类似于大型机构的长期交易方式。我广泛使用它来建立标准普尔,纳斯达克,DAX等指数的累积头寸。但这对外汇专业和大宗商品也非常有用。 市场概况最早是由Peter Steidlmayer在芝加哥提出的。他意识到交易量围绕某些价格水平分布,形成了高斯曲线。高斯曲线是数学家高斯引入的,用于研究误差的分布,它是当今使用最广泛的概率模型来预测许多现实生活中的现象,例如天气预报。如果您想进一步研究该主题,我将很乐意向您发送PDF“关于市场的思想”以及其他详细解释“市场概况”的书。如果您购买指标,我也可以只推荐您关于Market Profile的非常好的在线课程。 市场概况将在图表上追踪累计成交量的水平,并将每个最终的成交量峰值标记为“控制量点”,这些价格在将来变得非常合理。观察价格动作如何在这些大交易量形成时发生变化,我们可以预测,如果价格再次回到这些水平,则很有可能至少反弹一些点(例如10至15点)。
市场概况具有自己的时间表,即每日,每周或每月,建议与以下时间表配置一起使用: M30

Smart Awesome Volume 技术指标旨在通过组合蜡烛图交易量数据并用平均值对其进行过滤以提供准确信号来衡量市场动能。它着重于“量确定价”的概念,使交易者能够轻松识别市场势头以及每根蜡烛内买卖双方之间的战斗。凭借其快速警报系统,交易者可以掌握有价值的交易事件,绝不会错过重要的市场动向。 使用实际交易量信息改进策略的一种方法是使用买家和卖家的交易量来确认突破。这有助于交易者验证潜在的突破机会并做出更明智的交易决策。另一个策略增强是使用交易量信息来确认整体趋势。通过分析交易量数据,交易者可以获得对当前趋势方向的额外信心。最后,交易量信息可用于识别市场的潜在逆转,为交易者提供潜在趋势变化的早期信号。 飞碟策略由 Smart Awesome Volume 指标支持。对于买入条目,指标会寻找特定条件,例如 Awesome Oscillator 位于零线上方、连续的红色直方图,第二个比第一个短,以及紧随其后的绿色直方图。然后,交易者可以在第四根烛台上建立买入头寸。同样,对于卖出条目,指标寻找零线下方的真棒震荡指标、连续的绿色直方图,第二个比第一个短,然后是红色直方图。交易者可以在第四根

Ants Lite ATR allows you to enter and manage your trades based on the market volatility, giving you safer entries and better exits. Based on the work by Daryl Guppy.
Features Ability to define the bar the Long and Short calculation starts from. Can be used to generate both entry or exit signals. Customizable ATR period and multiplier. GMMA is a tried and tested indicator with a long pedigree. Volatility based entry and exit signal rather than time based.
How To Use Simply drag the indicator
MetaTrader市场是您可以下载免费模拟自动交易,用历史数据进行测试和优化的唯一商店。
阅读应用程序的概述和其他客户的评论,直接下载程序到您的程序端并且在购买之前测试一个自动交易。只有在MetaTrader市场可以完全免费测试应用程序。
您错过了交易机会:
- 免费交易应用程序
- 8,000+信号可供复制
- 探索金融市场的经济新闻
注册
登录