适用于MetaTrader 4的付费技术指标 - 8

The first currency based indicator to draw a distinction between map and strength. The map shows the currencies in terms of oversold/overbought levels and gives the direction of travel. The currency strength calculates and shows the strength of that move. Alerts are included for changes in currency direction on the map (confirmed over two bars) and also when the strength reached the appropriate level. The currency map is useful for finding currency pairs to trade and in which direction. Look fo

Monster Harmonics Indicator is a harmonic pattern indicator. It recognizes Gartley, Bat, Crab, Butterfly, Cypher, White Swan, Black Swan, Shark and several other patterns. Projected patterns that are not yet completed are recognized, too. Monster even shows the PRZ (Potential Reversal Zone). Users can add their own user defined patterns to Monster. Besides the current pattern, Monster also shows all patterns in the symbols history. Monster will provide alerts for developing patterns. Introduced

RSI Divergence Full +10 other divergence indicators
Contact me after payment to send you the User-Manual PDF File. Download the MT5 version here. Also you can download the >>> Hybrid Trading EA <<< that is designed and implemented based on RSI Divergence Indicator. RSI is a pretty useful indicator in itself but it's even more effective when you trade divergence patterns with that. Because the divergence signal of the RSI indicator is one of the most powerful signals among the indicators. Di
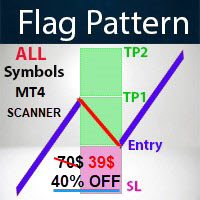
- Real price is 80$ - 50% Discount ( It is 39$ now ) Contact me for instruction, any questions! Related Product: Gold Expert , Professor EA - Non-repaint - Lifetime update free
I just sell my products in Elif Kaya Profile, any other websites are stolen old versions, So no any new updates or support. Introduction Flag patterns are an important tool for technical traders. Flags are generally considered to be a period of consolidation where the price of a security is caught in a range afte
Introducing the Swing Point Model Indicator – A Professional Trading Tool The Swing Point Model Indicator is an innovative tool designed for traders who want to capture market structure and identify potential trading opportunities. With a logical and transparent approach, the Swing Point Model helps you gain deeper market insights and make precise trading decisions. This is multiple Timeframe indicator so you can choose Higher timeframe for detect Swing point model What Is the Swing Point Mo

Contact me after payment to send you the User-Manual PDF File. Divergence detection indicator with a special algorithm. Using divergences is very common in trading strategies. But finding opportunities for trading with the eyes is very difficult and sometimes we lose those opportunities. The indicator finds all the regular and hidden divergences. (RD & HD) It uses an advanced method to specify divergence. This indicator is very functional and can greatly improve the outcome of your trading. Thi
Scalp Arrow Exit Signals (MT4 Indicator) All-in-One MT4 Signals: Precise Entries, Exits & Re-entries for Any Trading Style! The "Scalp Arrow Exit Signals" is a professional-grade trading indicator for MetaTrader 4 (MT4) , engineered to be your comprehensive guide for reliable entry, exit, re-entry, retracement entry, and pull-back entry signals . This powerful forex tool operates as a complete "black-box" system, providing clear, actionable buy and sell signals with robust alerts across any inst

Price Predictor is an indicator that shows precise price reversals taking into account a higher time frame and a lower time frame candle patterns calculations it is great for scalping and swing trading . Buy and sell arrows are shown on the chart as for entry signals. BIG Arrows indicates the trend - SMALL Arrows signal a trade (BUY/SELL) - A Green BIG UP Arrow with a support green line indicates a Bull Market : wait for buy signal - A Green SMALL Up Arrow after a BIG green arrow is

The indicator calculates currency strength of eight major and also can calculate strength of any other currency, metal or CFD. You don't need to look through a lot of charts to determine the strong and weak currencies, as well as their current dynamics. The picture of the whole currency market for any period can be viewed in a single indicator window. Built-in tools for monitoring and controlling the situation will help you not to miss out on profits.
Main Features It is able to display only th
Scalping Explorer is a complete trading system. Our traders have tested and optimized its work for maximum effect. Trading with Scalping Explorer is easy. Open in Metatrader4 windows with currency pairs: EURUSD, GBPJPY, GBPUSD, AUDUSD, USDCHF. We include D1 timeframe on all currency pairs. Add the Scalping Explorer indicator to each window with a currency pair. In the indicator settings, we find the "Signal" parameter and set it to TRUE. Now, as soon as a signal appears on any of the currency p
Features List 1:
FVG->iFVG Order Block High Transaction Line (Personal strategy) Premium Discount 50% and 61% Previous day high low Previous week high low Candle end countdown Feature List 2 : (Implemented based on feedback from community groups) trend identification Hide FVG, Order Block, Large Transaction line below 50% equilibrium. Hide all/Individual texts/features FUTURE Feature List (Will be implemented only if at least 5 people request for it.)
Asia, London, NY lq zones (Implemented) Def

Payne Trend是一个趋势过滤指标,以细彩色线的形式给出可能的市场方向,该指标帮助交易者根据当前的实际趋势做出交易决策,该指标有很多级别表示趋势的强弱,该指标不不重漆或背漆,信号不会延迟。
=================================================================================
参数 :
周期 : 趋势周期 模式:ma的计算模式 价格:收盘价/开盘价/最高价/最低价。 警报
==================================================================================

Dashboard uses Ichimoku Strategy to find best trades.
Get extra Indicators/Template: And read more about detailed Product Description and usage here: https://www.mql5.com/en/blogs/post/747457
Read more about Scanner Common features in detail here: https://www.mql5.com/en/blogs/post/747456
Features:
Price Kumo Breakout Tenkan-Kijun Cross Chikou/CLoud and Chikou/Price Support/Resistance (SR-SS or SR-NRTR) Stochastic OB/OS and back Awesome Oscillator Higher Timeframe Ichimoku Trend Align

"该指标基于Bystra模式理论检测入场点,并提供放置限价单的入场值,带有目标和止损水平。这使您能够计算您的风险百分比。 注意事项: 该指标具有允许在专家顾问(EAs)中使用的缓冲区。 在使用此产品时,务必进行良好的资金管理。 当您更改时间框架时, 指标将保存在上次会话中使用的模板。 如果您需要一本书来学习这种方法,请在购买后与我们联系并分享您的评论。 参数: 使用系统视觉效果 - 启用/禁用此产品的视觉主题。 相对速度 - 启用/禁用仅在最后一波的快速运动中检测模式。 显示最后一根蜡烛计时器 - 启用/禁用蜡烛计时器。 蜡烛计时器颜色 - 蜡烛计时器文本的颜色。 多头模式颜色 - 多头模式的颜色。 空头模式颜色 - 空头模式的颜色。 发送警报 - 启用/禁用警报。 发送通知 - 启用/禁用移动平台的推送通知。 发送电子邮件 - 启用/禁用电子邮件警报。 显示目标 - 启用/禁用在图表上显示目标。 历史条数 - 最大历史条数。" 如果您有更多问题或需要进一步帮助,请随时问我!
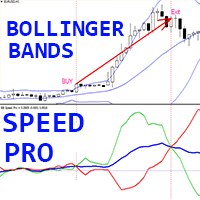
独特的趋势加密货币外汇指标“布林带速度专业版”,适用于 MT4,无需重绘。
- 该指标基于物理方程计算。 - 速度是标准布林带的一阶导数。 - 布林带速度专业版指标显示布林带中线和布林带边界方向变化的速度。 - 默认情况下:蓝线表示布林带中线速度,红线表示下边界速度,绿线表示上边界速度。 - 建议在趋势策略中使用 BB Speed Pro,如果 BB 中线速度值小于 0:趋势下降,如果值大于 0:趋势上升。 - 您可以考虑以下交易入场点: - 当蓝线高于 0 且绿线向上穿过蓝线时,开仓买入。 - 当蓝线低于 0 且红线向下穿过蓝线时,开仓卖出。 - 指标内置手机和电脑端警报。 - 指标包含信息点差掉期显示 - 它显示与其关联的外汇对的当前点差和掉期。 - 显示屏还显示账户余额、净值和保证金。 - 信息点差掉期显示可放置在图表的任意位置: 0 - 左上角,1 - 右上角,2 - 左下角,3 - 右下角。
点击这里查看高质量的交易机器人和指标! 这是仅在 MQL5 网站上提供的原创产品。

This indicator Super Channel Pro Pluss indicator.Indicator displays trend movement. Indicator calculates automatically line. Features
FiltPer - displays indicator channel period. deviation - displays indicator channel deviation. deviation2 - displays indicator channel deviation. deviation3 - displays indicator channel deviation. How to understand the status: If the arrow is up and line color Teal ;trend is up. If the arrow is down and line color Red; trend is down. If the arrow is Yellow close

Universal author's strategy, allows to determine the entry points for Buy and Sell both in the direction of the trend, on the reversals of trends and in the flat market. The indicator is equipped with a unique scanner which each tick analyzes the price chart, calculates optimal levels and patterns for finding entry points by one of the 3 strategies. Each of the strategies combines author formulas and algorithms, for optimal trading we recommend using 3 strategies simultaneously as they are compl

This indicator provides the ability to recognize the SMC pattern, essentially a condensed version of the Wyckoff model. Once the pattern is confirmed by RTO, it represents a significant investment opportunity. There are numerous indicators related to SMC beyond the market, but this is the first indicator to leverage patterns to identify specific actions of BigBoy to navigate the market. Upgrade 2024-03-08: Add TP by RR feature. The SMC (Smart Money Concept) pattern is a market analysis m

发现未来的交易方式 - Easy Entry Points! 由著名的Felipe FX开发,Golden Arrow Scalper 是下一代交易指标,旨在提供直观且高效的交易体验。具有先进功能和用户友好界面,这个指标是所有级别的交易者的完美工具。 主要功能: 简单的入口信号: 通过快速和慢速EMA的交叉来识别理想的入口点,确保交易决策的准确性和及时性。 声音警报: 设置声音警报以实时通知EMA的交叉,让您能够迅速反应市场变化。 完全定制: 调整快速和慢速EMA的设置,以符合您的交易风格和特定策略。 清晰的视觉: 使用不同的颜色(SeaGreen和Red)来轻松识别EMA的交叉,便于快速且有信息的决策。 优化性能: Easy Entry Points经过开发,以确保在任何交易平台上都能快速且高效地运行。 为什么选择Golden Arrow Scalper? 由专家开发: 由Felipe FX开发,这是最受尊敬的交易指标开发者之一。 易于使用: 适合初学者和经验丰富的交易者,配置简单且易于理解。 支持和更新: 跟踪持续开发并定期更新,确保您始终处于市场

Gartley Hunter Multi - An indicator for searching for harmonic patterns simultaneously on dozens of trading instruments and on all classic timeframes: (m1, m5, m15, m30, H1, H4, D1, Wk, Mn). Manual (Be sure to read before purchasing) | Version for MT5 Advantages 1. Patterns: Gartley, Butterfly, Shark, Crab. Bat, Alternate Bat, Deep Crab, Cypher
2. Simultaneous search for patterns on dozens of trading instruments and on all classic timeframes
3. Search for patterns of all possible sizes. From t
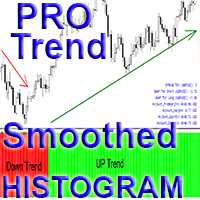
Crypto_Forex MT4 指标“专业平滑趋势直方图”,无需重绘。
- 专业平滑趋势直方图指标比任何标准移动平均线交叉指标都更高效。 - 它尤其适用于大趋势的检测。 - 指标有两种颜色:红色代表看跌下行趋势,绿色代表看涨上行趋势(可在设置中更改颜色)。 - 提供移动端和 PC 端警报。 - 建议将此指标与其他交易方法结合使用:价格行为、剥头皮交易、动量交易及其他指标。 - 指标具有信息价差掉期显示功能 - 显示与其关联的外汇对的当前价差和掉期。 - 显示屏还显示账户余额、净值和保证金。 - 可以将信息价差掉期显示放置在图表的任意位置: 0 - 左上角,1 - 右上角,2 - 左下角,3 - 右下角。
// 优秀的交易机器人和指标可在此处获取: https://www.mql5.com/en/users/def1380/seller 这是仅在 MQL5 网站上提供的原创产品。

“ ZigZag on Trend ”指标有助于判断价格走势方向,并配有K线和点数计算器。它由趋势指标、追踪价格方向的之字形趋势线以及用于计算趋势方向上经过的K线数量和垂直刻度上的点数(计算基于K线的开盘价)的计数器组成。该指标不会重绘。为了方便起见,它以彩色柱状图或线条的形式呈现。该指标适用于所有时间周期,但最适用于M5及以上时间周期。
“ Period ”决定了用于寻找价格方向的K线数量。它计算方向的长度,以获得平滑的单向趋势。
“ Diapason ”调整趋势方向的频率,主要用于针对不同的交易品种调整第一个参数(欧元/美元大约最多10,黄金大约最多100)。
点数计数器有助于针对任何时间周期和交易品种进行调整。
主要指标参数
“ Period ” - 决定趋势持续时间 “ Diapason ” - 用于调整波动性不同的交易品种的趋势(以点数为单位) “ History of the counter ” - 用于计算计数器的K线范围。建议使用较大的值,以便根据历史数据调整参数。在交易模式下,对于新报价,建议使用较小的值(500-1000之间),以避免计算机计算过载。

Was: $249 Now: $99 Market Profile defines a number of day types that can help the trader to determine market behaviour. A key feature is the Value Area, representing the range of price action where 70% of trading took place. Understanding the Value Area can give traders valuable insight into market direction and establish the higher odds trade. It is an excellent addition to any system you may be using. Blahtech Limited presents their Market Profile indicator for the MetaTrader community. Ins

RiskKILLER_AI Navigator 是一款基于人工智能的多时间框架市场方向与策略助手。 交易表现的关键在于像专业人士一样理解市场。这正是 RiskKILLER_AI Navigator 所提供的: 通过 AI 驱动的趋势、情绪和宏观分析( 独立于 MQL5 ),获得机构级别的洞察,并适应您的交易风格。 购买后,如需获取用户手册,请:1. 发布一条 评论 索要 2. 给我发送 私信 。 [ 专属群组 | MT5 版本 - MT4 版本 ]
核心优势 跨多个时间框架和资产的实时市场方向 AI 驱动的宏观指标、新闻和情绪分析 根据您的交易风格(手动或自动)提供定制建议 与 RiskKILLER_AI 专家顾问 (EA) 直接协同工作
主要特性 AI 驱动的全球趋势仪表板 - 即时查看 M1 到 D1 时间框架下主要外汇货币对和 BTCUSD 的市场偏向(盘整、看涨、看跌)。 策略感知型 AI 助手 - RiskKILLER_AI Navigator 适应您的策略并突出机会: 马丁格尔 / 网格 / 均价定投 (DCA) - 提示风险和波动性陷阱 均值回归 - 识别有利的盘整条
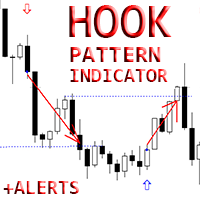
Crypto_Forex 指标“钩形模式”适用于 MT4。
- 指标“钩形模式”是价格行为交易的非常强大的指标:无需重绘,无延迟; - 指标可检测图表上的看涨和看跌钩形模式: - 看涨钩形 - 图表上的蓝色箭头信号(见图片)。 - 看跌钩形 - 图表上的红色箭头信号(见图片)。 - 具有 PC、移动和电子邮件警报。 - 指标“钩形模式”适合与支撑/阻力位结合使用。 .................................................................................................................... 点击这里查看高质量的交易机器人和指标! 这是仅在此 MQL5 网站上提供的原创产品。

精密指数振荡器(Pi-Osc)由Precision Trading Systems的Roger Medcalf开发
版本2经过精心重新编码,以在您的图表上加载速度非常快,还加入了一些其他技术改进,以提高体验。
Pi-Osc旨在提供准确的交易定时信号,旨在找到极端的耗尽点,这些点是市场被迫去触及,以清理每个人的止损单。
该产品解决了一个古老的问题,即知道极端点在哪里,这使得交易员的生活变得更加简单。
这是一个高度复杂的共识指标,与行业标准的振荡器相比,具有一些强大的区别。
它使用的一些特征包括需求指数、资金流动、RSI、随机指标、模式识别、成交量分析、标准偏差极端点以及不同长度上述各种变化的分歧。
乍一看,对于未经培训的人来说,它似乎与任何其他振荡器没有什么不同,但当与其他振荡器(如RSI或动量等)相对比时,这个指标的真正威力开始显现。
据我所知,没有其他振荡器可以频繁地精确指出顶部和底部,具有相同的定期效率。
精密指数振荡器由许多不同的数学方程组成,用于测量多个时间框架采样中的价格和成交量变动,从而高度准确地预测趋势可能发生转折的位置。
PTS Pi-Osc V2非

Breakout Sniper draw trendlines by using improved fractals and plots the breakout and reversal points.
NO REPAINT AUTOMATED TRENDLINES MULTI TIMEFRAME
*** SINCE THE STRATEGY TESTER OF MT4 PALTFORM DOES NOR SUPPORT, YOU NEED TO TEST "CURRENT TIMEFRAME" INPUTS ONLY.*** A trendline is a line drawn over pivot highs or under pivot lows to show the prevailing direction of price . Trend lines are a visual representation of support and resistance in any time frame. They show direction and speed

Renko Trade Alarm is designed to work on chart with Renko and Mean Renko candles. It generate B uy and S ell signals on the chart and send notifications. Visualization of signals: Swing - Formations 123. Pattern - Double Bottom, Double Top, Triple Bottom, Triple Top, Formations 123 Reverse. Scalp - Periodic change in the price direction, plus additional filters in the form of oscillators Stochastic and MACD. Ichi - Signals filtered by the Ichimoku indicator. For correct operation an offl

Huge 70% Halloween Sale for 24 hours only!
Send us a message after your purchase to receive more information on how to get your BONUS for FREE that works in great combination with Bull vs Bear ! Bull versus Bear is an easy-to-use Forex indicator that gives traders clear and accurate signals based on clear trend retests . Forget about lagging indicators or staring at charts for hours because Bull vs Bear provides real-time entries with no lag and no repaint, so you can trade with confiden

With this indicator you'll have a general reading of the market's range using Gann's calculating modes. Gann's swing is used to have a quick reading to the market latest movements at first glance. The foundation of this swing calculation is in the count of candles in relation to the break-up and break-down of the price. When the price breaks-up the last maximum, the swing will get traced if a certain number of candles is exceeded from the last minimum. It can be used a "pure Gann" or not: If set

Introduction to X3 Chart Pattern Scanner X3 Cherart Pattern Scanner is the non-repainting and non-lagging indicator detecting X3 chart patterns including Harmonic pattern, Elliott Wave pattern, X3 patterns, and Japanese Candlestick patterns. Historical patterns match with signal patterns. Hence, you can readily develop the solid trading strategy in your chart. More importantly, this superb pattern scanner can detect the optimal pattern of its kind. In addition, you can switch on and off individu
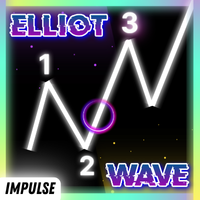
Huge 70% Halloween Sale for 24 hours only!
Manual guide: Click here This indicator is unstoppable when combined with our other indicator called Katana . After purchase, send us a message and you could get it for FREE as a BONUS! The Elliot Wave Impulse is a pattern identified in the Elliott Wave Theory, a form of technical analysis used to analyze financial market cycles. The Impulse Wave is considered the strongest and most powerful part of the Elliott Wave cycle, as it represents t

Pulse Scalping Line - an indicator for identifying potential pivot points. Based on this indicator, you can build an effective Martingale system. According to our statistics, the indicator gives a maximum of 4 erroneous pivot points in a series. On average, these are 2 pivot points. That is, the indicator shows a reversal, it is erroneous. This means that the second signal of the indicator will be highly accurate. Based on this information, you can build a trading system based on the Martingale

** All Symbols x All Timeframes scan just by pressing scanner button ** *** Contact me to send you instruction and add you in "Market Structure group" for sharing or seeing experiences with other users. Introduction: Market structure is important for both new and professional traders since it can influence the liquidity and price action of a market (Breakout and Retest). It’s also one of the most commonly used techniques to understand trends, identify potential reversal points, and get a feel f

FVG - Fair Value Gap The FVG - Fair Value Gap is an advanced MQL4 indicator designed for traders who utilize institutional order flow and Smart Money Concepts to identify market inefficiencies. This indicator automatically detects and highlights Fair Value Gaps (FVGs) on your chart, providing a clear visual representation of potential support and resistance zones, reversal points, and high-probability trading setups. Key Features: Automated FVG Detection: The indicator automatically identifies
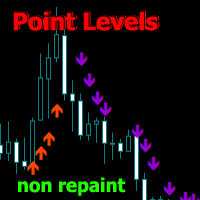
Point Directions - 款显示价格变动期间支撑位和阻力位的指标。箭头指示价格在指定方向的反弹。
箭头不会重绘,且在当前蜡烛图上形成。适用于所有时间框架和交易工具。提供多种警报类型。
它具有高级设置,可用于自定义任何图表的信号。它可以配置用于趋势交易和修正交易。
绘制箭头时,有两种移动平均线类型和一种箭头强度级别。详细设置请参见输入参数。
如有任何使用方面的问题,请发送私信。
输入参数
Method MA - 选择是否使用移动平均线生成箭头(标准或加速) Accelerated MA period/Standard MA period - 更改移动平均线周期 (5-500) Ma Metod - 更改移动平均线方法 Ma Price - 更改移动平均线价格 Arrow Intensity - 箭头强度(随着数值增加而增加) Arrow thickness - 箭头粗细 Sell arrow color/Buy arrow color - 箭头颜色 play sound / display message / send notification / send emai

该指标在指定柱数的工作直方图上找到最大和最低价格量(市场概况)的水平。 复合型材 。 柱状图的高度是全自动的,并适应任何仪器和时间框架。 作者的算法被使用,并且不重复众所周知的类似物。 两个直方图的高度近似等于蜡烛的平均高度。 智能警报将帮助您了解有关交易量水平的价格。
概念Smart Money 。 Low Volume - Imbalance. 用于寻找良好的市场环境,确定市场结构并作为二元期权的过滤器。 它是价格的磁铁。 High Volume - Liquidity. 用于退出累积时的测试。
输入参数 。
基本 。 Bars Count - 要计数和显示的条数 。 Signal Fractal = 5 (对于颜色信号电平)。 水平将在以下条件下成为信号:顶部和底部有五个直方图不超过它 。 Min Candles For High Volume Level - 在水平蜡烛的最小数量,以便它可以成为一个信号 。
按钮设置 。 Visual Button - 按钮显示(启用/禁用) 。 Corner - 按钮的卡角 。 X inden
Apollo Binary Options Indicator 这是二元期权交易的信号指标。该信号在当前蜡烛的开盘时出现,并且在它关闭之前一直有效。信号伴随着箭头以及图表上的信号消息。推荐的期权到期时间是一根蜡烛。也就是说,如果图表是 H1,那么到期时间将是 1 小时。如果图表为 M5,则期权到期时间为 5 分钟。但事实上,您可以随意使用信号,如果您愿意,您可以自由地遵循自己的交易规则。 我建议将此指标与我的其他用作过滤器的指标结合使用。我将完全免费向所有买家提供第二个指标。我还将与您分享有关如何使用该指标来获得最佳结果的建议。该系统适用于二元期权交易者和外汇交易者。 购买后联系我!我将免费向您发送一个额外的指标!我还将与您分享使用该系统进行交易的建议。

Never miss a price breakout again with the Price Alert Line Indicator . This tool is designed for traders who need speed and simplicity. Instead of navigating complex menus to set price alerts, the Price Alert Line Indicator places a button directly on your chart. With a single click, you can deploy a horizontal line that monitors price action and alerts you immediately when the price crosses it.
Key Features: - One-Click Deployment: A convenient button allows you to instantly draw or d

延迟规则指标
清晰信号。快速提示。无重绘。
Delta Trigger 是一款基于 DI+ 和 DI– 线的高精度箭头指标,可即时响应趋势的变化。
它提供清晰的买/卖信号,不重绘,不延迟,也不会消失。
最佳对象:XAUUSD
Delta Trigger 适用于所有外汇对和周期(从 M1 至 H4 以及更高),但在 XAUUSD 上性能最佳,因为其动量变化较快和明显。
Delta Trigger 能立即适应你的交易风格。
核心特性
灵活的周期适配性
适用于任何图表,无论是快速搏利的 M1 小周期还是 H4 的策略性进场。
精确的买/卖信号
基于 ADX 逻辑,当 DI+ 突破 DI– (买入),或 DI– 突破 DI+ (卖出)时产生箭头信号,并有足够趋势强度作支持。
清晰的图表箭头
绿色箭头 = 买入信号。红色箭头 = 卖出信号。箭头很显眼,不会移动或消失。
快速警报系统
当条件被解析成符合时,即时发出提示。支持弹出提示、Push 通知和可选的邮件提示。
极速性能
为快速切换图表和低延迟环境设计,非常适合高频率或新闻操作策略。
确保无重绘
信号箭头

This is a trend indicator without redrawing Developed instead of the binary options strategy (by the color of the Martingale candlestick) Also works well in forex trading When to open trades (binary options) A signal will appear in the place with a candle signaling the current candle It is recommended to open a deal for one candle of the current timeframe M1 and M5 When a blue dot appears, open a deal up When a red dot appears, open a trade down. How to open trades on Forex. When a signal is rec

3 Level ZZ Semafor Scanner:
This is a Dashboard indicator which uses 3LZZ Indicator in the background to find semafors. It will give priority to the semafors3 because they specify a strong signal. So, even if there is a sem1 or 2 on current bar, and if Sem3 was within "Check Previous Bars for Sem 3". Then it will show Sem3 instead. Read about this in detailed post: https://www.mql5.com/en/blogs/post/758250
And get all extra Indicators/Template from above link.
Please note: Number of settings

A unique author's strategy that simultaneously determines the trend reversal, entry points and estimated profit levels for each transaction. The indicator can determine entry points on any trading period, starting with the M5 chart to W1. At the same time, for the convenience of the user, an arrow is always drawn at a certain point and the recommended profit levels (Take Profit1, Take Profit2, Manual Take Profit) the Stop Loss level is also displayed.
A great advantage of the indicator Trend Sw

想象一下:你正处于巨额利润的边缘,但市场突然发生变化,你错过了机会。 或者更糟糕的是,你得到的是损失而不是利润。 如果你有一个可靠的盟友提前低语:"做好准备-海浪来了!"? 遇见 Harbinger,MetaTrader4 的革命性指标,专为厌倦混乱并希望预测市场变化的交易者而设计!
Harbinger 是一种智能算法,可以分析隐藏的趋势波动模式,以令人难以置信的准确性发出即将到来的回调,反转或累积的信号。 Harbinger mt5 version
如何使用Harbinger指标.
当指标 Harbinger 的信号出现在图表上时,这意味着信号之前的价格走势将被停止。 并且会有累积,回滚,或者一起回调的累积,或者趋势反转。 通常这两件事同时发生。 最主要的是要明白,如果一个信号出现,这意味着先前趋势的变化即将到来。 所有这些都让我们明白,我们需要重新考虑我们在这个工具市场上的未平仓头寸。 并采取必要的安全措施。 例如,您可以将其设置为盈亏平衡,或锁定部分利润,甚至完全锁定整个利润。
如果在指标 Harbinger 的信号出现后,市场的积累阶段已经开始,最好等待积累结束,然后

江恩箱(或江恩方)是一种基于 W.D. Gann 的“市场预测的数学公式”文章的市场分析方法。 该指标可以绘制三种正方形模型:90、52(104)、144。有六种网格变体和两种弧形变体。 您可以在一张图表上同时绘制多个方块。
参数 Square — 江恩方格模型的选择: 90 — 90 的平方(或 9 的平方); 52 (104) — 52(或 104)的平方; 144 — 144的万能平方; 144 (full) — 正方形的“完整”版本,结合了其他正方形的线条。 据我们所知,W.D.江恩并没有这样的加价; for Arcs — 圆弧的简化正方形; Grid — 网格的变体: 4x4 (52) — 4 x 4 网格,52 个标记; 5x5 (40); 8x8 (90); 8x8 (104); 8x8 (144); 16x16 (144); 36x36 (144); disable — 禁用网格; Arcs — 弧线的变体: 4x4; 5x5; disable — 禁用弧; 开始时的方形参数: Length of Square, Bars (X-axis) — 正方形的长度(以条
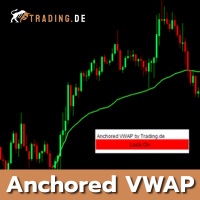
With the Anchored VWAP for MT4 from Trading.de, you can easily calculate and display the volume-based average price starting from a specific point in the chart (anchor). The indicator is ideal for our Trading.de 1-minute chart strategy, but can also be used in all other timeframes. The AVWAP for MetaTrader 4 is calculated using volume or an average period. In the settings, you can specify whether or not to use real trading volume. The indicator also has a "Lock" button in the upper right corner
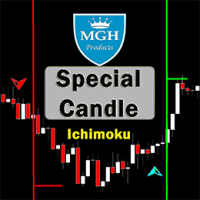
特殊蜡烛
您想使用其中一个最佳的外汇指标和成功的Ichimoku策略吗?您可以使用基于Ichimoku策略的这个令人惊叹的指标。
MT5版本在这里 。
第一策略:
此策略涉及识别很少出现相似强交叉。
此策略的最佳时间框架为30分钟(30M)和1小时(H1)。
适用于30分钟时间框架的合适符号包括:
• CAD/JPY
• CHF/JPY
• USD/JPY
• NZD/JPY
• AUD/JPY
• EUR/USD
• EUR/GBP
对于1小时时间框架,适当的符号包括:
• GBP/USD
• GBP/NZD
• GBP/AUD
• USD/CAD
• USD/CHF
• USD/JPY
• EUR/AUD
第二策略:
此策略涉及识别与趋势方向相同的强大Tenkunsen和Kijunsen交叉。
此策略的最佳时间框架为1分钟(1M)至15分钟(15M)。
此策略可应用于大多数货币和符号。
第三策略:
此策略涉及将第一和第二策略组合起来,它们之间有x个蜡烛的距离。您可以从设置中更改X。默认设置为3。
我们提供支持,无论何时出现问题: https://www.mql5.com/en

Specialized Binary Options Indicator. The name positive zone is inspired by how this indicator ultimately made me feel, which is "Positive". Not only from a emotional stand point but from a financial one. Once you start earning from this indicator it will give you that runners high, or that nice buzz after you finish a warm cup off coffee in the morning and blast on Cumbawamba's on hit wonder Tubthumping. The key to winning Binary Option is patience and controlling your emotion . This is why th
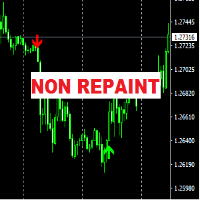
The "FCK Trend Arrow No Repaint" indicator is designed for analyzing market dynamics and determining potential trading signal moments. The main feature of this indicator is the absence of signal repainting, which contributes to more accurate and reliable forecasting of price movements in the market.
Mechanism of Operation: The "FCK Trend Arrow No Repaint" indicator uses several types of graphical elements to indicate trading signals: Up and Down Arrows: The indicator marks possible market entr
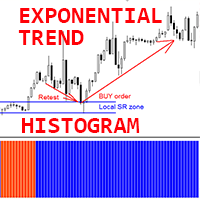
Crypto_Forex MT4 指标“指数趋势直方图”,无需重绘。
- 指数趋势直方图指标对于趋势检测非常有效。 - 最佳使用方法是结合支撑/阻力位和重测技术(见图): - 一旦指标检测到新趋势,找到局部阻力位并在那里设置相应的挂单,等待该区域重测。 - 如果新趋势看涨,则设置买入限价挂单;如果新趋势看跌,则设置卖出限价挂单。 - 指标有两种颜色:红色代表看跌下行趋势,蓝色代表看涨上行趋势(可在设置中更改颜色)。 - 提供手机和电脑端警报。 ................................................................................................................. // 优秀的交易机器人和指标可在此处获取: https://www.mql5.com/en/users/def1380/seller 这是仅在 MQL5 网站上提供的原创产品。

Ever wondered why standard ADX is made unsigned and what if it would be kept signed? This indicator gives the answer, which allows you to trade more efficient. This indicator calculates ADX values using standard formulae, but excludes operation of taking the module of ADX values, which is forcedly added into ADX for some reason. In other words, the indicator preserves natural signs of ADX values, which makes it more consistent, easy to use, and gives signals earlier than standard ADX. Strictly s
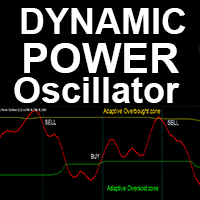
“动态能量震荡指标”是一款高级自定义加密货币外汇指标,是 MT4 平台的高效交易工具!
- 新一代震荡指标 - 请查看图片了解如何使用。 - 这是一款非常实用的技术动量指标。 - 动态能量震荡指标具有自适应超卖/超买区域。 - 震荡指标是一款辅助工具,可帮助您从动态超卖/超买区域找到准确的入场点。 - 超卖值:低于绿线,超买值:高于黄线。 - 该指标也非常适合与价格行为模式结合使用。 - 它比标准震荡指标更精准。适用时间范围:30 分钟、1 小时、4 小时、1 天、1 周。 - 提供电脑端和移动端提醒。
// 优秀的交易机器人和指标可在此处获取: https://www.mql5.com/en/users/def1380/seller 这是仅在 MQL5 网站上提供的原创产品。
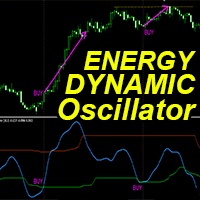
“动态能量震荡指标”是一款高级自定义加密货币外汇指标,适用于 MT4 平台,高效交易!
- 新一代震荡指标 - 请查看图片了解如何使用。 - 动态能量震荡指标具有自适应超卖/超买区域。 - 这是一个技术动量指标,在趋势市场中非常有用。 - 震荡指标是一种辅助工具,可帮助您从超卖/超买区域找到准确的入场点。 - 超卖值:低于绿线,超买值:高于橙线。 - 它比标准震荡指标更精准。适用时间范围:30 分钟、1 小时、4 小时、1 天、1 周。 - 提供 PC 和移动端提醒。 ................................................................................................................. // 优秀的交易机器人和指标可在此处获取: https://www.mql5.com/en/users/def1380/seller 本产品为独家产品,仅在 MQL5 网站上提供。

Indicator for manual trading and technical analysis for Forex.
It consists of a trend indicator with the opening level of the trading day and a arrow indicator for determining entry points.
The indicator does not recolor; it works when the candle closes.
Contains several types of alerts for signal arrows.
Can be configured to work on any chart, trading instrument or time frame.
The work strategy is based on searching for price movements along the trend.
To make " Buy " transactions: The tre

Immediately plots renko bars in an external/indicator window. One of the distinctive advantages Renko charts offer is the fact that they are not time dependent. Therefore, the new Renko blocks are only traced when the price moves higher or lower by the specified number of points.
For example, a 10 pip (100 points) Renko chart would plot the blocks when price moves 10 pips higher in an uptrend or 10 pips lower in a downtrend. Renko charts removes "noises" from the Market and i t helps to identi

Introduction Harmonic Patterns are best used to predict potential turning point. Traditionally, Harmonic Pattern was identified manually connecting peaks and troughs points in the chart. Manual harmonic pattern detection is painfully tedious and not suitable for everyone. You are often exposed under subjective pattern identification with manual pattern detection. To avoid these limitations, Harmonic Pattern Plus was designed to automate your harmonic pattern detection process. The functionality

The ACB Trade Filter indicator provides a solution for filtering out the low probability trading setups in a trading strategy. The indicator uses a sophisticated filtration algorithm based on the market sentiment and trend.
Applications Works great with our indicator " ACB Breakout Arrows ". Filter out low probability signals from any indicator. Avoid overtrading and minimize the losses. Trade in the direction of market sentiment and trend. Avoid the choppiness in the market.
How to use Only L
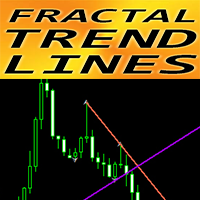
Crypto_Forex 指标“分形趋势线”适用于 MT4。
- 此指标非常适合使用突破图形分析的交易者!!! - “分形趋势线”显示图形上升趋势(紫色)和下降趋势(红色)线。 - 上升趋势和下降趋势线建立在 2 个最接近的对应分形上。 - 指标有几个参数负责趋势线的颜色和宽度。 - 指标内置移动和 PC 突破警报。 ....................................................................................................................... 点击这里查看高质量的交易机器人和指标! 这是仅在此 MQL5 网站上提供的原创产品。
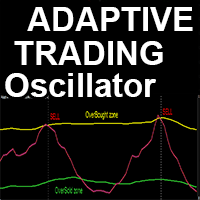
高级自定义加密货币外汇指标“自适应交易震荡指标”——MT4平台的高效辅助交易工具!
- 该指标是新一代震荡指标——请查看图片了解使用方法。 - “自适应交易震荡指标”具有可调节的自适应超卖/超买区域。 - 该震荡指标是一款辅助工具,用于在动态超卖/超买区域的出场点位上寻找精准的交易入场点。 - 超卖区域:绿线下方。 - 超买区域:黄线上方。 - 该指标非常适合与价格行为模式和趋势策略结合使用。 - 它比标准震荡指标更加精准。 - 该指标可用于任何时间周期。 - 内置PC和移动设备警报功能。 .................................................................. 点击这里查看高质量的交易机器人和指标! 本产品为MQL5独家原创产品。

“动态剥头皮震荡指标”是一款高级自定义加密货币外汇指标,适用于 MT4 平台,高效交易!
- 新一代震荡指标 - 参见图片了解如何使用。 - 动态剥头皮震荡指标具有自适应超卖/超买区域。 - 震荡指标是一款辅助工具,可从动态超卖/超买区域找到准确的入场点。 - 超卖值:低于绿线,超买值:高于橙线。 - 该指标也非常适合与价格行为模式结合使用。 - 它比标准震荡指标更精准。适用时间范围:30 分钟、1 小时、4 小时、1 天、1 周。 - 提供 PC 和移动端警报。 ................................................................................................................. 点击这里查看高质量的交易机器人和指标! 本产品为原创,仅在 MQL5 网站上提供。
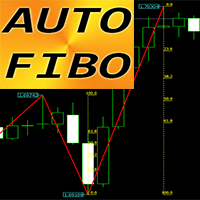
“Auto FIBO” Crypto_Forex 指标 - 是一款出色的交易辅助工具!
- 指标自动计算并绘制斐波那契水平线和局部趋势线(红色)。 - 斐波那契水平线指示价格可能反转的关键区域。 - 最重要的水平线是 23.6%、38.2%、50% 和 61.8%。 - 您可以将其用于反转剥头皮交易或区域网格交易。 - 您还可以使用 Auto FIBO 指标来改进您当前的系统。 ................................................................................................................. 点击这里查看高质量的交易机器人和指标! 这是仅在 MQL5 网站上提供的原创产品。

TW Trend Sniper:最佳趋势策略
TW Trend Sniper 指标利用先进的技术分析技术的智能组合,帮助您准确识别市场趋势并及时接收获利交易信号。Trade Wizards 的专有公式以及价格行为分析、斐波那契水平和其他技术分析工具为您提供精确可靠的交易信号。该指标是专业交易员和熟练程序员共同努力的结果,旨在为交易员提供强大而高效的工具。
您是否正在寻找一种强大的工具来准确预测和识别金融市场的进入和退出点? “TW趋势狙击手”产品采用最先进的技术和人工智能算法,为您提供精准可靠的交易信号。
如果您正在寻找一款专业且强大的金融市场技术分析和盈利工具,那么本产品是您的最佳选择。使用本产品,您可以: 节省时间:依靠精确的信号意味着您不再需要复杂且耗时的分析。 降低交易风险:通过利用安全的盈亏水平以及智能风险管理,您可以防止重大损失。 实现可持续利润:通过准确识别进入点和退出点,您可以充分利用有利可图的市场机会。 增强信心:使用这个强大而可靠的工具可以让您更有信心地在市场上进行交易。 灵活的设置:您可以轻松自定义各种资产类型和时间范围的信号。该产品适用于所有货币和 5

The SPV Volatility indicator is one of the most effective filters. Volatility filter. Shows three volatility options. The so-called limit, real, and the last most effective filter for the filter is the percentage filter. Percentage display of folatility shows the ratio of limit to real volatility. And thus, if we trade in the middle of the channel, then it is necessary to set a condition that the percentage is less than a certain indicator value. If we trade on the channel breakout - following t

Order block hunter indicator is the best indicator for hunt the order blocks that area where there has been a large concentration of limit orders waiting to be executed Order blocks are identified on a chart by observing previous price action and looking for areas where the price experienced significant movement or sudden changes in direction .This indicator does that for you by using very complicated codes and helps you to take the best areas To buy and sell because it make marks at the best a
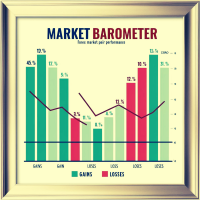
Market Barometer is a cheat code for trading, it acts as a "barometer" for market sentiment across various pairs, showcasing their changes. You can tell right away what to trade. You can trade trends or reversals. MT5 Version: https://www.mql5.com/en/market/product/127467 Market Barometer is a powerful tool designed to track and visualize the percentage changes across multiple currency pairs. By analyzing the price shifts of different forex pairs, it helps you understand how they are correlat

This indicator is designed to detect high probability reversal patterns: Double Tops/Bottoms with fake breakouts . Please read also the blog post " How To Yield Big Winners Consistently! " which explains the concepts behind the ULTIMATE Double Top/Bottom indicator and how you can use a top-down approach to get 15 - 20R winning trades on a regular basis . The provided video shows the maximum performance of the indicator. With maximum performance, I mean that this could have been the profit if you

TMA Currency Meter is the ultimate currency meter. Based on the Triangular Moving Average of all available symbols, this indicator shows which currencies are strong, strengthening, weak or weakening. Experienced as well as novice traders will see the strong and weak currencies in the blink of an eye, and know which trade possibilities to explore further. TMA Currency Meter is a true Multi Timeframe indicator. It is easy to show the currency strengths for a higher timeframe than the chart timefra

该指标从极值开始构建三周期信号和反转形态 123。信号出现在第二根蜡烛的开口处。 该形态可以通过不同方式(测试点 3、突破等)进行交易。退出通道或突破趋势线是寻找入场点的主要触发因素。 图标根据斐波那契水平着色。黄色图标表示对某一水平的测试,在该水平上信号会被放大。 使用多币种仪表盘,您可以跟踪 123 形态是在哪些货币对上发现的,以及有多少个条形图跟随该形态。 基于分形之字形。可重新绘制。因此,请在博客链接 - 123 Fractal Trading With UPD1 中研究该策略。
输入参数。
Bars Count – 显示历史记录。 Tooltip – 将鼠标悬停在对象上时是否显示工具提示。 Show Semaphore – 启用或禁用信号灯。 Show 123 – 启用或禁用显示 123 模式。
Period 1, 2, 3 - 信号周期。 Period 1, 2, 3 Visual – 启用或禁用单独周期的显示。
Arrow Coeff Period – 用于计算的条数。 Arrow Coeff – 平均烛台值的系
该指标根据指定的系数找到一个低,高,极端的体积,并用指定的颜色绘制它们。 它取代了metatrader终端中的标准体积绘制功能。 蜡烛也可以在体积的颜色着色。 在具有极端体积的烛台上,确定最大水平体积(cluster/POC)。 根据它的位置(推动,中立,停止),集群也有自己的颜色。 如果集群在阴影中,并且蜡烛有一个极端的体积,那么我们得到一个逆转的箭头。 您可以在设置中启用警报。 此外,指示器中还有一个单独的选项,以阴影显示群集。
输入参数 。 (一些与颜色和视觉设置相关的跳过) 。
基本设置 。 Bars Count – 指标将工作的历史柱数 。 Data Source - 报价时间范围的选择。 如果您认为您认为过去的历史被截断和不完整,那么为您正在研究的仪器下载更多M1报价。 Vertical Step - 影响密度和垂直精度 。 Calc Bars - 用于体积计算的平均蜡烛数 。 Low Volume Factor - 我们固定最小音量的系数。 如果不需要,请将值设置为0 。 High Volume Factor - 我们固定大体积的系数 。 Extreme Volum
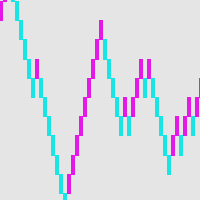
砖块图——一种备用的交易方式 如果你是一个对无数图表中的蜡烛图感到困惑的交易者 ,又或者说并不知道要怎么画线,也不知道支撑线阻力线怎么画,这个时候就应该另找一个适合自己的交易方法了。就像一个司机在反复遇到问题后会停下来进行全面检修一样, 一笔交易也是如此。 砖块图为盘中交易员提供了一种简单的交易方法,实际上这种方法和K线来说,具有同样的历史,并且也是起源于日本。 为了定义一个砖块图,他们只描述了一个设定点或基点的价格趋势。例如,一个10点的砖块图只能描绘出价格变动中10点的上升趋势或10点的下降趋势。 砖块图有一个得天独厚的优势,就是它的价格不和时间挂钩,也就是说只有价格变化达到了设定的数值,才会有一个新的砖块图出现,并且砖块图去掉了价格的毛刺,所以从感官上感觉会非常的舒服。
MetaTrader 市场 - 在您的交易程序端可以直接使用为交易者提供的自动交易和技术指标。
MQL5.community 支付系统 提供给MQL5.com 网站所有已注册用户用于MetaTrade服务方面的事务。您可以使用WebMoney,PayPal 或银行卡进行存取款。
您错过了交易机会:
- 免费交易应用程序
- 8,000+信号可供复制
- 探索金融市场的经济新闻
注册
登录