VWAP Moving Average
- 指标
-
Devy Tanusukma
 I develop custom indicators and expert advisors to backtest, trade and analyze trading algorithm/strategy on MT4 platform. In general it takes about 10 seconds to test a trading strategy over 10 years period with my custom tester. It will record all the trade entries, take profit, stop loss and
 - 版本: 1.0
VWAP and Moving Average
A combination of Supertrend and Moving Average to create a converging trade setup
Input parameters:
- signal mode: set it to true if you want to plug it into STAT (Signal Tester and Trader)
- arrow shift: distance between fast EMA line to arrow on chart
- turn on moving average signal for converging setup
- VWAP period
- MA period
- MA averaging method
- MA pricing method
- upper level limit (VWAP)
- lower level limit (VWAP)
You can find the best setting for 4 hour EURUSD on this video
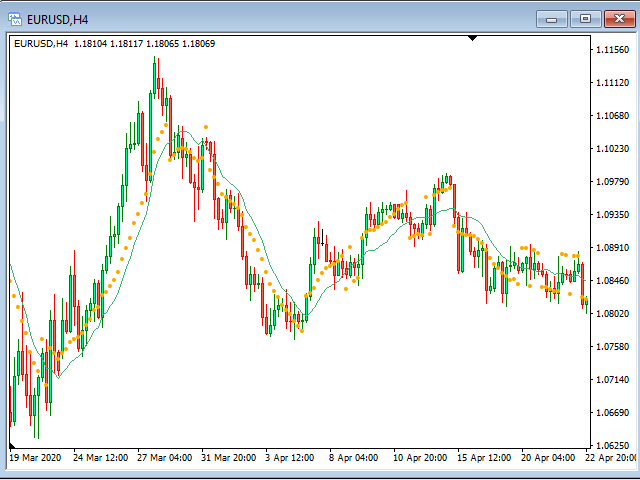

This indicator shows VWAP and a 14 EMA. Long when the price is above both; short when the price is below both.