True Direction Oscillator
- 指标
- 版本: 9.2
- 更新: 22 五月 2020
- 激活: 20

或 (TDO),它是一种使用“ 纯动量”原理衡量价格变化率的指数。
当证券价格从 10 上涨到 15 时,价格变化率为 150%,但当它从 15 回落到 10 时,价格变化率仅为 33.3%。这就是为什么像“价格变化率”(ROC) 或“动量”这样的技术分析指标给出的上升价格走势读数高于下降价格走势读数的原因。 TDO 解决了这个问题,以帮助交易者正确读取动量。
重要信息
TDO 特性
TDO 以百分比计算纯动量,因此它用于比较来自不同市场的不同证券。 (例如:将 EURUSD 与 Gold & Dow Jones Industrial 进行比较)。
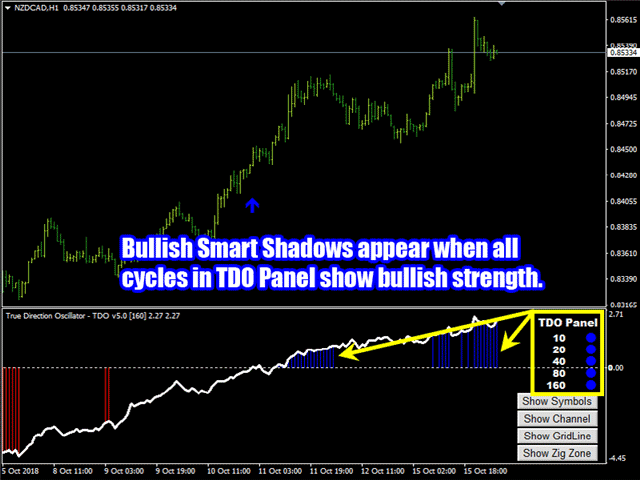
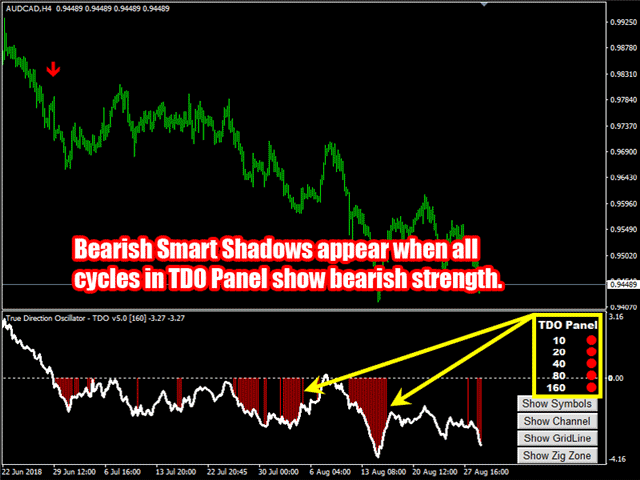
TDO 面板计算取决于五个不同的时期,以涵盖广泛的市场周期,并且可以更有效地捕捉趋势。
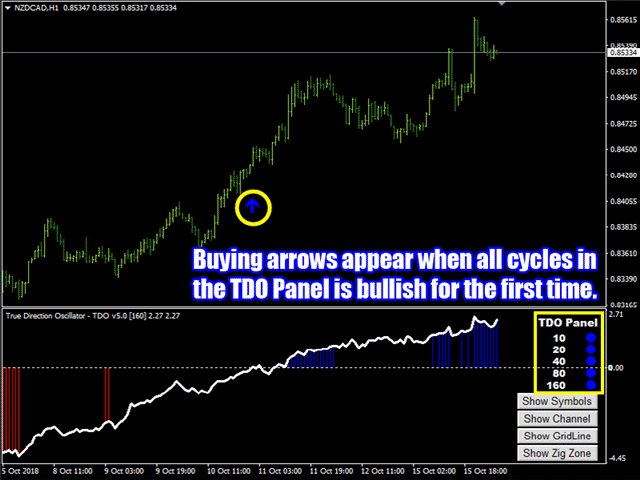
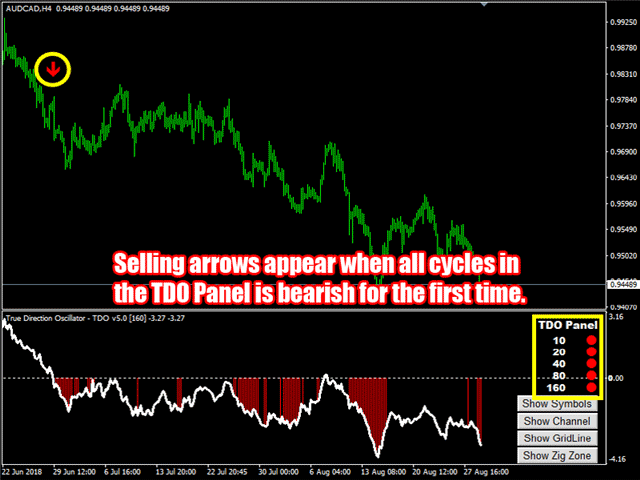
当所有 TDO 面板点第一次对齐时,会出现 TDO 箭头。此功能将错误的零线交叉信号的数量减少到最低数量。
当趋势增强以及新趋势开始时出现箭头信号时,会发出声音、电子邮件警报。
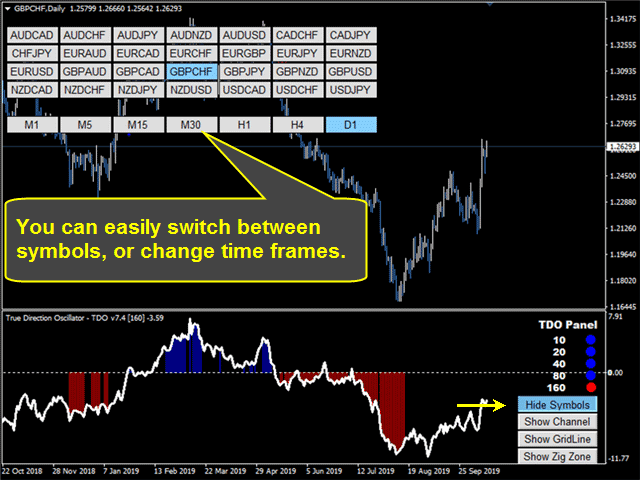
您可以通过按符号按钮在 FX 对之间切换。您可以选择在新窗口中打开图表。
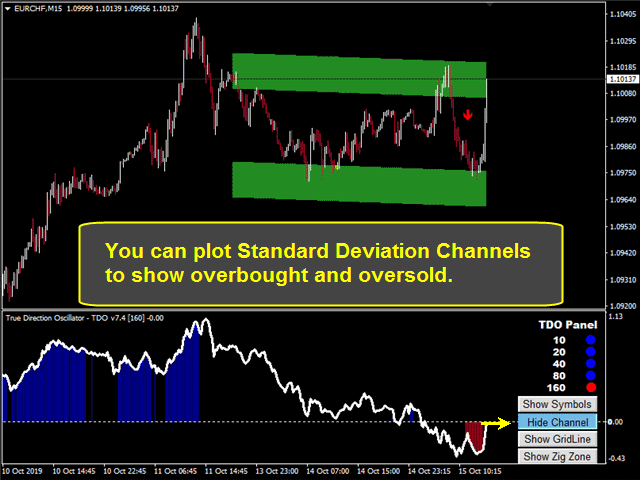
您可以通过按“通道”按钮来添加标准偏差通道或线性回归通道。
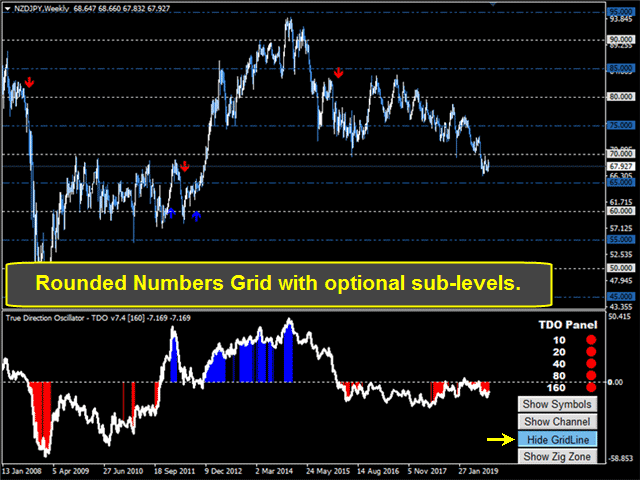
您可以从不同级别的整数添加网格。
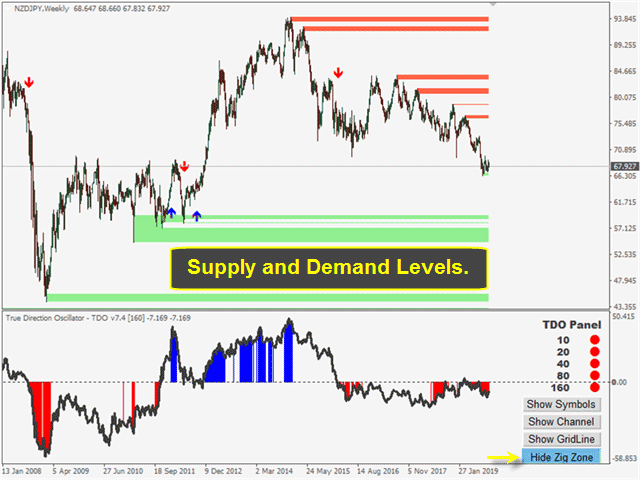
您可以添加支撑和阻力位。
精心设计的参数可帮助用户在它们之间导航。
修改 TDO 代码以确保它不会消耗用户的 PC 内存。
TDO 箭头不会重新绘制或重新计算其结果。
重要的 TDO 参数
1) TDO 设置
- 第一个 TDO 周期 [ Min =1 ]:这是 TDO 面板中的第一个周期。默认值为 10。
2) TDO 颜色列表和按钮
- 图表颜色列表:您可以在四种不同的颜色列表之间进行选择,也可以选择(什么都不做)。
3) TDO 箭头和警报
4) TDO 面板警报
5) TDO 符号按钮
- 显示符号面板的窗口: 在主图表窗口或 TDO 窗口中显示符号按钮。
- 按钮单击操作: 在同一窗口或 新窗口中打开图表。
- 交易品种来源: 从自定义交易品种列表或 市场报价中获取交易品种。
- 符号列表(用“;”分隔):如果您从自定义列表中选择符号,则用“;”分隔符号。
- 水平行中的按钮 [Min=(1)]:要在一行中显示的按钮数。
- 要显示的时间范围 [Min=(1) & Max=(9)]:默认值为 7。
6) TDO 通道
- 通道类型: 在标准偏差通道或 线性回归通道之间进行选择。
- 通道射线:将通道显示为射线。
- 通道长度:通道计算中使用的蜡烛数量。默认值为 160。
7) TDO 网格线
- 子网格级别计数:您可以在主网格级别之间添加零到十个子级别。
8) TDO 之字形区域级别
如果您有任何问题,请通过私信与我联系,或者在评论部分写下它们。
Muhammad Al Bermaui,CMT


UPDATE:
After using it on demo for 12 hours I have gone live.
It is AMAZING and very helpful author!! :-)
--------------------------------------------------------------------
Seems to be a VERY well made indicator with a very helpful author.
I will update after some testing.