
深入了解累积/派发以及它的作用

简介
众所周知,累积/派发 A/D 指标有一个有趣的功能 - 突破此指标图表中绘制的趋势线暗示着一定概率上会即将突破价格图表中的趋势线:
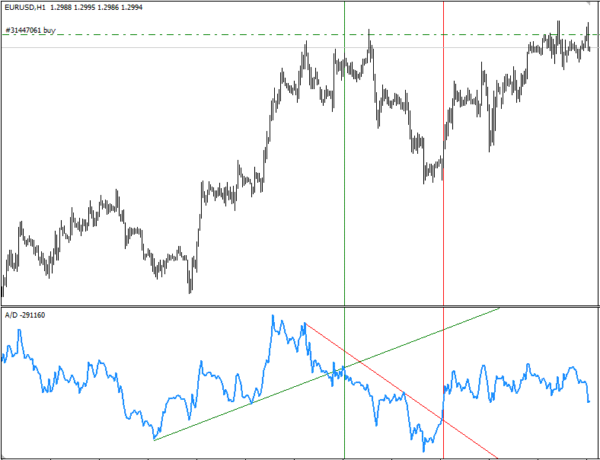
我决定验证这一事实,在 A/D 图表中绘制了所有趋势线,我很快意识到通过手动方法解决这一问题是不明智的。因此,我开发了一个函数,此函数可自动在 A/D 图表中绘制趋势线并在价格图表中设置信号指示符号。我现在想显示一个如何使用 MQL4 实现此函数的分步程序,在交易机器人中将进一步使用此程序。
本文对于那些刚开始在 MQL4 中进行编程的人来说很有帮助和趣味性。为此,我尝试用易于理解的方式呈现信息并使用最简单的代码结构。
1.设置任务
我们首先来定义要设置的任务。
在一般情况下,此函数将找到 A/D 图表中绘制的趋势线与指标本身的线条之间的交点,返回表示相交方向 - 向上或向下- 的值,并在价格图表中设置信号指示符号(向上/向下箭头,取决于相交方向)用于进行说明。
我们现在来将这个常规任务分成更加具体的目标:
- 此函数应能够适用于任何交易品种和任何时间范围;
- 由于此函数设计用作为 EA 的一部分,因此 A/D 指标不需要位于主图表中。
- 信号指示符号不一定需要显示在价格图表中 - 所有计算将在此函数内执行,并且仅显示用于直观监控函数操作。
- 可在不同的方向相交:上升趋势向下相交,上升趋势向上相交,向下趋势向上相交,向下趋势向下相交。此函数将标识每个此类相交。
这就是有关函数功能的说明。我们现在来看看执行任务的方式。
2.用 A/D 指标数据填充数组
调用后,此函数将收到一些值:此时 - 用于存储 A/D 指标数据、标识 A/D 图表极值的历史条柱的数量、工具(交易品种)名称和时间范围的数组。
将基于标识的 A/D 图表极值绘制趋势线,因此,上升趋势线连接下极值,下降趋势线连接上极值。
上升趋势线需要两个下极值,其中,最小极值应位于紧邻当前(零)条柱的极值的左侧。这同样适用于向下趋势:最高极值应位于紧邻当前条柱的极值的左侧。
如果无法识别满足这些要求的极值,将不会在此次价格变动时绘制趋势线。我们打算将这些趋势线称为“全局”趋势线:

此外,我们还将另外两条线添加到了绘制的“全局”趋势线中,这需要使用两个最右侧的极值,因此,
- 向上趋势需要一个较小的下极值(位于较大的下极值的左侧);
- 向下趋势需要一个较大的上极值(位于较小的上极值的左侧);
如果无法识别满足这些要求的极值,将不会在此次价格变动时绘制趋势线。
这些趋势线将被称为“局部”趋势线:
结果,我们可以看到的内容如下:
在大多数情况下,由于识别“全局”极值和连接极值以绘制趋势线比较特别,因此我们不需要“局部”极值。将允许禁用用于搜索并绘制“局部”极值的选项。
函数操作将要求有 EA 的全局变量可用,尤其是用于存储 A/D 数据的数组。我们来将它写入 EA 的全局变量中:
double TempIND[]; // Array for storing A/D indicator data
现在,应读取指标数据以填充数组:
int SignalCrossIND(double &TempIND[], int nBars, string sy, int tf)
{
   if (sy=="" || sy=="0") sy = Symbol();
   ArrayResize(TempIND,nBars);       // Resize the array according to the size passed to the function
   for (int j=0; j<=nBars-1; j++)
      {
         TempIND[j]=iAD(sy,tf,j);    // Write indicator data in the loop into the array
      }
}
让我们分析我们刚才在此编写的内容:
int SignalCrossIND(double &TempIND[], int nBars, string sy, int tf)
按照这种方式定义此函数,其中,要传递的参数为 TempIND[] - 包含指标值的数组名称(通过引用传递)、nBars - 将从中获取值的历史条柱的数量、sy - 工具(交易品种)名称和时间范围 tf。
通常,函数调用可如下所示:
SignalCrossIND(TempIND, 30, NULL, 5);
其中,TempIND 为数组名称,30 为条柱数量,NULL 为图表的当前交易品种,5 为 М5 时间范围。
下一行为:
if (sy=="" || sy=="0") sy = Symbol();
它检查传递给此函数的交易工具的名称,如果值为 NULL 或 0,将使用当前图表交易品种。
然后,我们将根据 nBars 变量中传递给此函数的值调整数组大小,并用循环中的零条柱到 nBars-1 条柱中的指标值填充数组。由于数组单元格从零开始编号,因此,第一个编号将为 0,而不是 1,最后一个编号为 29,而不是 30。因此,我们使用 nBars-1(在我们的示例中,30-1=29)
在这个阶段,我们的函数用 A/D 指标数据填充数组。我们现在需要识别 A/D 图表数据数组中的极值。
3.识别 A/D 指标数据数组中的极值
让我们开始吧。此函数的操作不仅需要全局变量,还需要此函数本身将使用的变量。
在此阶段,我们需要声明将用于编写上极值(波峰)和下极值(波谷)的另外两个(内部)数组,在这两个数组中,我们将保存此函数将需要使用的极值和一些变量的时间:
// ------------------------------------------------------------------------------------------
// -------------------------------- Function variables --------------------------------------
// ------------------------------------------------------------------------------------------

   double   PeakUP[], PeakDN[];     // Declare peak/trough arrays
   datetime TimeDN[], TimeUP[];     // Arrays for storing the time of extrema
   int      i, k;                   // Internal variables of the function
最后,进行它们的识别:
//------------------------------------------------------------------
// Filling arrays with data on peaks and troughs
//------------------------------------------------------------------
    k=0;                                   // Initialize the trough array index
    for (i=2; i<=nBars-1; i++)             // Run through the array of values
       {
          if (TempIND[i]<TempIND[i-1] &&
              TempIND[i+1]>=TempIND[i])    // Trough identified
             {
                ArrayResize(PeakDN, k+1);  // Resize the trough array according to the number of troughs identified
                ArrayResize(TimeDN, k+1);  // Resize the trough time array according to the number of troughs
                PeakDN[k]=TempIND[i];      // Write the trough value into the trough array...
                TimeDN[k]=iTime(sy,tf,i);  // ...and the time array
                k++;                       // Increase the trough array index
             }
        }
// -----------------------------------------------------------------------------------------------------------
    k=0;                                   // Initialize the peak array index
    for (i=2; i<=nBars-1; i++)             // Run through the array of values
       {
          if (TempIND[i]>TempIND[i-1] &&
              TempIND[i+1]<=TempIND[i])    // Peak identified
             {
                ArrayResize(PeakUP, k+1);  // Resize the peak array according to the number of peaks identified
                ArrayResize(TimeUP, k+1);  // Resize the peak time array according to the number of peaks
                PeakUP[k]=TempIND[i];      // Write its value into the peak array...
                TimeUP[k]=iTime(sy,tf,i);  // ...and the time array
                k++;                       // Increase the peak array index
             }
       }
上面需要对进行了什么操作以及操作的方式做出说明。首先,我们安排了两个独立的循环 - 分别用于识别上极值和下极值。
我们来看看用于识别波谷(下极值)的第一个循环的操作:
我们首先将变量 k 初始化为零 - 它将指向将在其中写入已识别波谷的数组的第一个(零)元素。接着,我们循环通过之前填充的 A/D 指标值的数组,起点不是此数组的第一个(零)索引,而是对应于条柱 2 (i=2;) 的第三个索引。
这是为什么?由于极值在指标图表中是一个拐点,在指标图表中,第一个条柱上的值大于第二个的条柱上的值,而第二个条柱上的值小于第三个条柱上的值(波谷),我们设置了此数组的第三个元素上的索引(记住元素从零开始编号),假设它可能是极值。在计算过程中不会使用零条柱来消除误报。
接着,我们开始第一次迭代并检查
- 条柱 2 上的值 TempIND[i] 是否小于条柱 1 上的值 TempIND[i-1],且
- 条柱 3 上的值 TempIND[i+1] 是否大于条柱 2 上的值 TempIND[i]。
如果此条件为真(极值已识别),我们首先将波谷数组和波谷时间数组的大小增加 1:
ArrayResize(PeakDN, k+1); // Resize the trough array according to the number of troughs identified ArrayResize(TimeDN, k+1); // Resize the trough time array according to the number of troughs
然后,将指标值的数组中的数据写入这些数组中,并将波谷数组索引增加 1:
PeakDN[k]=TempIND[i]; // Write the trough value into the trough array...TimeDN[k]=iTime(sy,tf,i); // ...and the time array k++; // Increase the trough array index
现在,波谷数组和波谷时间数组,分别为 PeakDN 和 TimeDN,包含已识别极值的所需数据,同时波谷数组索引指向此数组的下一个单元格。当识别下一个极值时,下一个循环迭代将遵循相同的模式,并且其数据将被写入波谷数组索引 (k) 指向的波谷数组的新单元格。
将用非常类似的方式识别波峰(上极值),除了第一个、第二个和第三个条柱用相反方式以外:小于号和大于号应进行互换。在此阶段,我们的函数可以读取 A/D 指标数据,使用此数据填充数组并识别其中的极值,以及将极值的值和位置保存到四个指定数组中。
这时,我们可以开始在指标图表中显示趋势线,基于识别的极值绘制趋势线。
首先,我们来在指标图表中显示“全局”趋势线。为了通过连接图表极值来绘制这些趋势线,我们应开始识别两个极值 - 作为整个波谷数组中的最小值的极值,以及我们将称为主极值的极值。主极值紧邻波谷数组的开头部分,将被严格设置为等于 2。因此,在指标图表中最接近于当前条柱的前两个极值将不被考虑(以为价格变动保留一定的自由度,而无需对最轻微的价格变动做出响应)。
既然识别了主极值,我们需要在数组中找到位于主极值左侧的最小极值)。此极值在指标图表中将为最小值,用作为最终识别第二个极值的起点。
绘制一条趋势线,使其连接最小极值,同时主极值很可能会导致这样的情况:趋势线与高于识别的最低极值的极值相交。这意味着,在这种情况下,趋势线的开头部分应移至与趋势线相交的极值。下图清楚地显示了此类情况:

可以看出,以最低极值为起点的线条在向主极值延伸时与较高极值相交。因此,在这种情况下,需要仔细分析极值数组,并识别一个极值,当此极值被定义为趋势线的起点时,它不会导致趋势线与任何后续极值相交的情况。
最低极值后面的极值也不合适 - 如果趋势线以此点为起点,它仍会与较高极值相交:
我在这里省去了进一步“尝试”,直接转到识别的“右侧”极值:
现在,是时候开始编码。我们使用较低极值绘制上升趋势线,并使用较高极值绘制下降趋势线。
让我们来查看绘制通过较低极值的上升趋势线的示例。
4.在 A/D 指标极值的数组中识别两个用于绘制趋势线的极值
识别两个需要的极值将要求此函数具有用于存储和传递上最小值、下最小值和主极值以及用于存储和传递上最小值、下最小值和主极值的时间的内部变量,以及一个用于检索数组的变量。
我们打算将它们添加到我们的函数变量中(而不是以后再回到这个问题,我们将立即添加所有需要的函数变量以便立即开始使用它们):
// ------------------------------------------------------------------------------------------
// -------------------------------- Function variables ----------------------------
// ------------------------------------------------------------------------------------------

   double   PeakUP[], PeakDN[],        // Declare peak/trough arrays
            yUP, yDN, yGUP, yGDN,      // Coordinates of the crossing point between the trend line and indicator UP and DN on the 1st bar
            yUP2, yDN2, yGUP2, yGDN2,  // Coordinates of the crossing point between the trend line and indicator UP and DN on the 2nd bar
            CheckCross,
            PreLastVarDN,LastVarDN,    // Values of the last and last but one lower extrema
            PreLastVarUP,LastVarUP,    // Values of the last and last but one upper extrema
            PivotPeakDN,PivotPeakUP,
            LowestPeakDN,HighestPeakDN,// Values of the lower minimum and maximum
            LowestPeakUP,HighestPeakUP,// Values of the upper minimum and maximum

   datetime TimeDN[], TimeUP[],        // Arrays for storing bars of extrema
            PreLastTimeDN, LastTimeDN, // Time of the last and last but one lower extrema
            PreLastTimeUP, LastTimeUP, // Time of the last and last but one upper extrema
            PivotBarDN, PivotTimeDN,   // Bar and time of the lower main extremum
            PivotBarUP, PivotTimeUP,   // Bar and time of the upper main extremum
            LowestBarDN, LowestTimeDN, // Bar and time of the lower minimum
            HighestBarUP, HighestTimeUP;// Bar and time of the upper maximum
   int      i, kup, kdn, pbar=2,
            m, l, t, asize, Index,      // "Internal" variables
            WinID=WindowFind("A/D");    // AD window number
   bool     CrossDN = false,            // Flag indicating the downward crossover of the local trend
            CrossUP = false,            // Flag indicating the upward crossover of the local trend
            CrossGDN = false,           // Flag indicating the downward crossover of the global trend
            CrossGUP = false;           // Flag indicating the upward crossover of the global trend

   double   pt=MarketInfo(Symbol(),MODE_POINT); // Point size in the quote currency
接着,添加用于识别下极值的代码:
//====================================================================================================
// --------------------------- Identification of lower DN minimum and maximum -------------
//====================================================================================================

  PivotTimeDN = TimeDN[pbar];                     // Time of the main extremum
  PivotBarDN  = iBarShift(sy,tf,TimeDN[pbar]);    // Bar of the main extremum
  PivotPeakDN = PeakDN[pbar];                     // Value of the main extremum
  LowestPeakDN  = ArrayMin(PeakDN);               // Get the lower minimum value
  Index = ArraySearchDouble(PeakDN, LowestPeakDN);// Get the index of the lower minimum in the array
  LowestBarDN =iBarShift(sy,tf,TimeDN[Index]);    // Get the bar of the lower minimum
  LowestTimeDN = TimeDN[Index];                   // Get the time of the lower minimum
在变量 pbar 中严格设置主极值的条柱,变量中包含的索引从时间数组中获得主极值的时间。
PivotTimeDN = TimeDN[pbar]; // Time of the main extremum
将从时间数组中获取主极值的条柱,并使用标准函数 int iBarShift( string symbol, int timeframe, datetime time, bool exact=false) 计算它的值。
稍后在考虑识别极值数组中的最小值时将简要地介绍这一点。
将从值数组中获取主极值的值,同时使用变量 pbar 指定所需的值(包含主极值索引):
PivotPeakDN = PeakDN[pbar]; // Value of the main extremum
要识别下最小值,你可以使用标准函数 int ArrayMinimum(double array[], int count=WHOLE_ARRAY, int start=0) ,这就是我们将要使用的功能,仅安排通过调用用户定义的函数来完成计算。此函数将返回极值识别结果。
我们打算使用 Igor Kim 在他的论坛帖子中好意提供的现成函数识别数组中的最小元素,而不是做无谓的重复性工作。它完全符合我们的需要,如果传递给它的数组为空白,则可以向日志发送相关错误报告(这可给调试带来了便利):
//+----------------------------------------------------------------------------+
//|  Author    : Igor B. Kim aka KimIV,  http://www.kimiv.ru                   |
//+----------------------------------------------------------------------------+
//|  Version   : 17.05.2008                                                    |
//|  Description : Returns the value of the minimum element in the array.      |
//+----------------------------------------------------------------------------+
//|  Parameters:                                                               |
//|    x - array of values of numerical series                                 |
//+----------------------------------------------------------------------------+
double ArrayMin(double& x[]) {
  if (ArraySize(x)>0) return(x[ArrayMinimum(x)]);
  else {
    Print("ArrayMin(): Array empty!");
    return(0);
  }
}
可以看出,此函数完全没有任何困难之处 - 它是相同的标准函数 ArrayMinimum(),用于检查传递的数组中的所需数据。将使用从同一个来源中获取的类似函数来根据值获取数组中的最小元素的索引:
//+----------------------------------------------------------------------------+
//|  Author    : Igor B. Kim aka KimIV,  http://www.kimiv.ru                   |
//+----------------------------------------------------------------------------+
//|  Version   : 01.09.2005                                                    |
//|  Description : Finds an array element by its value                         |
//|             and returns the index of the found element or -1.              |
//+----------------------------------------------------------------------------+
//|  Parameters:                                                               |
//|    m - array of elements                                                   |
//|    e - value of the element                                                |
//+----------------------------------------------------------------------------+
int ArraySearchDouble(double& m[], double e) {
  for (int i=0; i<ArraySize(m); i++) {
    if (m[i]==e) return(i);
  }
  return(-1);
}
这里,我们将循环整个数组,搜索传递给函数的值。如果传递给函数的值与数组元素的值匹配,函数将返回变量 i 的值,匹配后,此值将等于数组中的查找值的索引。如果找不到查找值,函数将返回 -1,此值可用于校错程序。
现在,我们需要在图表中找到一个对应于已识别极值的条柱。为此,我们打算使用之前填充的时间数组 TimeDN[] 中的数据以及我们刚刚获取的所需极值的索引 (Index):
// Get the bar of the lower minimum LowestBarDN =iBarShift(sy,tf,TimeDN[Index]);
为了做到这一点,我们需要标准函数 int iBarShift( string symbol, int timeframe, datetime time, bool exact=false)
根据时间查找条柱。函数将返回指定时间的条柱的偏移。如果指定时间没有任何条柱(历史记录中的空白之处),函数将根据 exact 参数返回 -1 或最接近的条柱的偏移量。
在这里,要传递给函数的第一个参数是存储在变量 sy 中的图表当前交易品种;要传递的第二个参数是存储在 tf 变量中的当前时间范围;将时间 datetime time 传递给 iBarShift(),此变量存储在时间数组 TimeDN[] 中并被在上一步中获得的变量 Index 的值索引。
我们保留 bool exact 的默认值,因为在缺少条柱(历史记录中的空白之处)时传递 true 会导致函数返回 -1,以后将使用此值进行进一步计算,进而导致发生错误。如果历史记录中缺少条柱,默认值 false 会导致函数返回最接近的条柱的值,此值虽不够好,但好于完全错误的值。
现在,为了了解整个过程和进一步计算,我们还将保存上面所述已发现的条柱的时间。这非常简单:我们在 TimeDN[] 数组中保存时间。现在,我们来使用相同的索引从此数组中获取它:
// Get the time of the lower minimum LowestTimeDN = TimeDN[Index];
因此,我们识别了主极值和最小值。我们现在需要了解连接这两个已识别图表点的趋势线是否与位于这两个识别点之间的另一个极值相交(正如上文所提到的):
将使用通过最小值到主极值所绘制的虚拟线识别此类相交。我们将循环通过极值数组,从最小值直到主极值,一旦找到了极值与线之间的交点,会将此交点作为线的起点,我们将再次循环通过数组,这次从我们刚刚识别的极值开始直到主极值。
将通过与线相交的极值,直至没有极值。这将意味着,我们识别了所需的极值,从此极值之后的极值直到主极值的极值不会与趋势线相交。
if (LowestBarDN>PivotBarDN)                           // If the minimum is to the right of the first extremum ...
                                                      // ... (being in 0 cell of the trough time array)
for (m=Index-1; m>pbar; m--)                          // Loop from the extremum following the minimum to the first extremum
  {
// --------- Draw a virtual trend line and check it for crossovers with other extrema -----
  CheckCross=EquationDirect(iBarShift(sy,tf,TimeDN[m+1]),
                            PeakDN[m+1],                      // First coordinate of the line
                            PivotBarDN, PivotPeakDN,          // Second coordinate of the line
                            iBarShift(sy,tf,TimeDN[m],false));// Crossing point associated with the next extremum
      if (TempIND[iBarShift(sy,tf,TimeDN[m])]<CheckCross)     // If the extremum lies below the line
         {
            if (PeakDN[m]<PeakDN[pbar])                       // if this extremum is lower than the main extremum
               {
                  LowestBarDN =iBarShift(sy,tf,TimeDN[m]);    // Then this is the one we need to start from...
                  LowestPeakDN  = PeakDN[m];                  // New coordinates of the next extremum
                  LowestTimeDN = TimeDN[m];
               }
         }
   }
在这里,我们安排了一个从最小值之后的极值到极值数组中的第一个极值的循环。这样做是因为在绘制线时最小值将作为起点,同时将从下一个极值开始检查是否相交。
将使用直线方程式绘制虚拟线,此函数计算与直线的交点处的 X 的 Y 值:
double EquationDirect(double x1, double y1, double x2, double y2, double x) { if (x2==x1) return(y1); return((y2-y1)/(x2-x1)*(x-x1)+y1);
x1 和 y1 是第一个点的坐标;x2 和 y2 是第二个点的坐标;x 是针对其计算 y 的值。此函数是从 I. Kim 的论坛帖子中获得的。
因此:
CheckCross=EquationDirect(iBarShift(sy,tf,TimeDN[m+1]), PeakDN[m+1], // First coordinate of the line
                          PivotBarDN, PivotPeakDN,                   // Second coordinate of the line
                          iBarShift(sy,tf,TimeDN[m],false));         // Crossing point associated with the next extremum
将最小值条柱作为第一个点的 x- 坐标并将最小值的值作为第一个点的 y- 坐标插入在要传递的函数参数中。主极值的条柱和值将用作为虚拟线点的第二个坐标。
要传递给此函数的最后一个值是在循环中传递给函数的条柱编号,用于计算 y- 坐标的值和比较结果值与位于给定点的极值的值。
if (TempIND[iBarShift(sy,tf,TimeDN[m])]<CheckCross)  // If the extremum lies below the line
   {
    if (PeakDN[m]<PeakDN[pbar])                      // if this extremum is lower than the main extremum
       {
         LowestBarDN  =iBarShift(sy,tf,TimeDN[m]);   // Then this is the one we need to start from...
         LowestPeakDN = PeakDN[m];                   // New coordinates of the next extremum
         LowestTimeDN = TimeDN[m];
        }
   }
因此,如果函数返回的值为大于位于给定点的极值的值,则此极值将与虚拟线相交,且此线应将此极值作为起点。保存新的坐标值,继续执行下一个循环迭代以识别与下一个极值的相交。
一旦我们识别了在其之后便没有任何其他极值与线相交的极值,将使用此极值绘制趋势线。我们需要了解的是此极值的值是否小于主极值的值以及此极值是否位于极值的左侧,这意味着从此极值到主极值所绘制的线将在右侧方向上向上。
if (LowestBarDN>PivotBarDN && LowestPeakDN<PivotPeakDN)// If the minimum is to the left of and below the main extremum
这意味着,我们现在拥有在 A/D 图表中绘制上升趋势线需要的所有数据。
5.在 A/D 图表中绘制趋势线
为了确定主图表窗口中存在 A/D 指标,我们引入了另一个用于存储 A/D 图表子窗口编号的变量 WinID :
WinID=WindowFind("A/D"); // AD window number
这里,如果已找到,标准函数 WindowFind(”name”name”); 返回图表子窗口的编号,其中包含指定名称 name 的指标;如果未找到,则返回 -1。基本上不需要在 A/D 图表中绘制趋势线,因为计算过程中不需要趋势线;然而,为了清晰起见和确保一切都正确,我们打算绘制趋势线:
if (WinID>0)
   {
    if (ObjectFind("Trend_GLine_DN")<0)
    ObjectCreate("Trend_GLine_DN",OBJ_TREND,WinID,LowestTimeDN,LowestPeakDN,PivotTimeDN,PivotPeakDN);
    ObjectSet("Trend_GLine_DN",OBJPROP_COLOR,Lime);
    ObjectSet("Trend_GLine_DN",OBJPROP_TIME1,LowestTimeDN);
    ObjectSet("Trend_GLine_DN",OBJPROP_PRICE1,LowestPeakDN);
    ObjectSet("Trend_GLine_DN",OBJPROP_TIME2,PivotTimeDN);
    ObjectSet("Trend_GLine_DN",OBJPROP_PRICE2,PivotPeakDN);
   }
在这里,我们首先检查 A/D 指标窗口是否在主窗口中。如果不在,则没有可绘制的位置:
if (WinID>0)
这很简单:如果指标未附在图表窗口上,WindowFind() 函数将返回 -1。主图表窗口,即图表本身,始终有零值,因此,我们将检查此值是否“大于零”。由于除 A/D 图表以外,图表窗口中还可能有其他指标,我们不能确切地知道为我们需要的 A/D 分配了什么编号,因此我们不会检查数字本身,而是检查此值是否大于零。
此外...如果窗口标识符 (WinID) 大于零,则认为窗口中存在 A/D 图表,我们可以开始绘制。接着,我们检查是否已在图表中使用趋势线名称绘制趋势线:
if (ObjectFind("Trend_GLine_DN")<0)
如果尚没有趋势线(ObjectFind() 函数返回 -1,否则返回 A/D 窗口指数),我们可以开始绘制。为此,我们使用函数:
ObjectCreate("Trend_GLine_DN",OBJ_TREND,WinID,LowestTimeDN,LowestPeakDN,PivotTimeDN,PivotPeakDN);
bool ObjectCreate(string name, int type, int window, datetime time1, double price1, datetime time2=0, double price2=0, datetime time3=0, double price3=0) 在指定图表子窗口中使用指定名称、类型和初始坐标创建对象。与此对象关联的坐标数为 1 到 3 个,取决于类型。成功完成此对象后,函数将返回 TRUE,否则将返回 FALSE。
我们来详细回顾此过程:
- string name 取要创建对象的名称的值 - 在我们的例子中为“Trend_GLine_DN”(连接下极值的全局趋势线);传递给此函数的下一个参数是 int type,即对象类型 - 在我们的例子中合理的类型为 OBJ_TREND...
- int window 是存储在变量 WinIND 中的 A/D 指标窗口...
进一步传递给此函数的参数是用于绘制趋势线的两个点的坐标:
- datetime time1 是保存在变量 LowestTDN 中的最小值的第一个时间坐标;
- double price1 是保存在变量 LowestPeakDN 中的最小值的第一个值坐标;
- datetime time2 是保存在变量 HighestTDN 中的最小值的第二个时间坐标;
- double price2 是保存在变量 HighestPeakDN 中的最小值的第二个值坐标;
在绘制趋势线的过程中未使用 ObjectCreate() 函数的其他参数。
此时,已创建了趋势线对象。现在,我们需要修改它的一些参数。尤其是,线条颜色和线条坐标。线条颜色将保持不变,而坐标需要在每次新极值的数据发生更改时进行修改,将使用新的坐标绘制趋势线:
ObjectSet("Trend_GLine_DN",OBJPROP_COLOR,Lime);
bool ObjectSet( string name, int prop_id, double value) 更改指定对象属性的值。如果成功,此函数将返回 TRUE,否则返回 FALSE。此代码行通过向上升趋势线分派 Web 颜色集中使用的标准颜色常量 Lime,设置上升趋势线的颜色。
传递给此函数的参数有:
- string name - 需要修改其属性的对象的名称 - 在我们的例子中为“Trend_GLine_DN”;
- int prop_id - 需要修改的对象属性的标识符。我们首先更改颜色,因此标识符为 OBJPROP_COLOR;
- double value - 指定的对象属性的新值。这就是颜色常量 Lime 传送到的地方。
我相信 ,对其他对象属性的修改应该没有任何困难之处 - 操作与上述涉及对象颜色更改的示例类似:
ObjectSet("Trend_GLine_DN",OBJPROP_TIME1,LowestTimeDN); ObjectSet("Trend_GLine_DN",OBJPROP_PRICE1,LowestPeakDN); ObjectSet("Trend_GLine_DN",OBJPROP_TIME2,PivotTimeDN); ObjectSet("Trend_GLine_DN",OBJPROP_PRICE2,PivotPeakDN);
首先,我们更改极值的第一个时间坐标 (OBJPROP_TIME1),接着更改第一个值坐标 (OBJPROP_PRICE1),然后更改极值的第二个时间坐标 (OBJPROP_TIME2) 以及第二个值坐标 (OBJPROP_PRICE1)。所有坐标值将被写入变量 LowestTimeDN、LowestPeakDN、PivotTimeDN 和 PivotPeakDN。
将在 A/D 指标图表中绘制我们的趋势线(受限于指标窗口本身的存在)。现在,我们需要识别 A/D 图表中的线与使用图表极值绘制的趋势线之间的交点。仔细考虑此任务,我得出了这样的结论:(对我而言)使用直线方程式计算交点将更加简单。
6.标识 A/D 图表线与通过指标图表极值绘制的趋势线之间的交点
拥有趋势线绘制所使用的两个点,我们使用直线方程式计算将在 A/D 指标线的第一个条柱上投影的假想线。(我们处理第一个条柱以减少误报数量)。
使用直线方程式计算得出的并投影在指标的第一个条柱上的点将作为我们打算检查是否相交的点。此外,我们只需要在 A/D 图表中标记这些计算出的点,并检查它们是否与指标线向上或向下相交。
还有一个要考虑的点。由于我们打算用与高值/低值相反的方式识别交点,因此,我们的计算也需要 A/D 指标图表的第二个条柱。如果指标线高于第一个条柱上的交点且低于或等于第二个条柱上的交点,我们将有一个向上相交。因此,我们将基于极值计算这两条线。第一条线将投影在指标的第一个条柱上,第二条线将投影在第二个条柱上。
将标注假想线以便计算结果获得更好的可视化。
让我们开始吧...
7.识别和标记可能的交点
我们将需要用于存储可能的交点的计算值的更多变量。
我们已经将它们添加到函数变量列表中:
// ------------------------------------------------------------------------------------------
// -------------------------------- Function variables ----------------------------
// ------------------------------------------------------------------------------------------
   double   PeakUP[], PeakDN[],           // Declare peak/trough arrays
            yUP, yDN, yGUP, yGDN,         // Coordinates of the crossing point between the trend line and indicator UP and DN on the 1st bar
            yUP2, yDN2, yGUP2, yGDN2,     // Coordinates of the crossing point between the trend lines and indicator UP and DN on the 2nd bar
            LowestPeakDN,HighestPeakDN,   // Values of the lower minimum and maximum
            LowestPeakUP,HighestPeakUP;   // Values of the upper minimum and maximum
   datetime TimeDN[], TimeUP[],           // Arrays for storing bars of extrema
            LowestTimeDN, HighestTimeDN,  // Bar of the lower minimum and maximum
            LowestTimeUP, HighestTimeUP,  // Bar of the upper minimum and maximum
            LowestTDN, HighestTDN,        // Time of the lower minimum and maximum
            LowestTUP, HighestTUP;        // Time of the upper minimum and maximum
   int      i, k, Index,                  // "Internal" variables
            WinID=WindowFind("A/D");      // AD window number
在开始之前,我们想说明的是,我们添加了 8 个变量,而不是 4 个变量,因为在计算“局部”趋势线和交点时需要使用另外 4 个变量。现在,我们将使用 yGUP、yGDN、yGUP2 和 yGDN2 存储:
- 与“全局”上升趋势线的交点, yGUP - 在第一个条柱上;yGUP2 - 在第二个条柱上
- 与“全局”下降趋势线的交点, yGDN - 在第一个条柱上;yGDN2 - 在第二个条柱上
我们来再次使用 Igor Kim 好意提供的直线方程式函数:
//+----------------------------------------------------------------------------+
//|  Author    : Igor B. Kim aka KimIV,  http://www.kimiv.ru                   |
//+----------------------------------------------------------------------------+
//|  Version   : 12.10.2007                                                    |
//|  Description : Straight line equation. Calculates the Y value for X        |
//|                at the point of crossing with the straight line.            |
//+----------------------------------------------------------------------------+
//|  Parameters:                                                               |
//|    x1,y1 - coordinates of the first point,                                 |
//|    x2,y2 - coordinates of the second point,                                |
//|    x     - value for which Y needs to be calculated                        |
//+----------------------------------------------------------------------------+
double EquationDirect(double x1, double y1, double x2, double y2, double x)
{
  if (x2==x1) return(y1);
  return((y2-y1)/(x2-x1)*(x-x1)+y1);
}
将向此函数传递 5 个参数作为起点用于进行计算:两个参数为两个图表极值的坐标,最后一个参数为交点所在的条柱:
yGDN =EquationDirect(LowestBarDN,LowestPeakDN,PivotBarDN,PivotPeakDN,iBarShift(sy,tf,Time[1],false)); yGDN2=EquationDirect(LowestBarDN,LowestPeakDN,PivotBarDN,PivotPeakDN,iBarShift(sy,tf,Time[2],false));
在这里,最小值的坐标被用作第一个点的坐标:x1 = LowestTimeDN, y1 = LowestPeakDN,而主极值的坐标被用作为第二个点的坐标:x2 = PivotBarDN, y2 = PivotPeakDN。
所需条柱的偏移量被传递作为方程式要计算的值:iBarShift(sy, tf, Time[1], false),其中 sy 表示货币工具的交易品种名称,tf 表示时间范围,Time[1] 表示时间序列数组,包含当前图表中的每个条柱的建立时间。Datetime 数据类型表示从 1970 年 1 月 1 日 00:00 起运行的时间(单位:秒)。
此函数的剩余参数已在上文讨论过。我想指出的是,如果我们的函数将用于一个多货币的 EA,我们应使用的不是 Time[1] ,而是标准函数 iTime()(我们打算在此函数的最终变式中实施此函数),此函数将显式地接收货币工具和使用时间范围的值,而 Time[] 仅适用于当前图表。
我们已经计算出了相交水平并将它们存储在了变量中。为了清晰起见,现在可以在 A/D 指标图表中对它们进行标注:
if (WinID>0)
     {
         if (ObjectFind("PointGDN"+Time[1])<0)
         ObjectCreate("PointGDN"+Time[1],OBJ_ARROW,WinID,Time[1],yGDN);
         ObjectSet("PointGDN"+Time[1],OBJPROP_ARROWCODE,4);
         ObjectSet("PointGDN"+Time[1],OBJPROP_COLOR,Lime);
         ObjectSet("PointGDN"+Time[1],OBJPROP_TIME1,Time[1]);
         ObjectSet("PointGDN"+Time[1],OBJPROP_PRICE1,yGDN);
     }
这与我们绘制趋势线时的操作类似。我们来看看一些细微的差异。
第一个差异是对象名称:
ObjectCreate("PointGDN"+Time[1],OBJ_ARROW,WinID,Time[1],yGDN);
由于我们不打算创建一个单独的对象,而是在每个新条柱上创建一整组对象,所有对象的名称应是唯一的。为此,将在对象的名称上添加创建对象所在的条柱的时间:
“PointGDN"+Time[1]
第二个差异是图形对象类型的标识符。在绘制趋势线时,我们使用了 OBJ_TREND,现在我们将使用允许绘制箭头(符号)的 OBJ_ARROW。此外,WinID 是将在其中绘制对象的子窗口的编号 - 在我们的例子中为 A/D 窗口编号,还有两个坐标 - 时间坐标 Time[1] :表示第一个条柱的时间,价格坐标 yGDN :表示计算出的趋势线与第一个条柱之间的交点。
对象属性设置如下:
ObjectSet("PointGDN"+Time[1],OBJPROP_ARROWCODE,4);
对象属性的标识符 OBJPROP_ARROWCODE 设置对象代码,可以是一个 wingdings 符号或一个预定义箭头代码。为了在计算出的级别上准确地设置对象,有几个指向准确价格和时间的特殊箭头代码。我们将使用连字符 (–),它的代码为 4。剩余行设置对象颜色以及在每个条柱上不断变化的坐标。
ObjectSet("PointGDN"+Time[1],OBJPROP_COLOR,Lime); ObjectSet("PointGDN"+Time[1],OBJPROP_TIME1,Time[1]); ObjectSet("PointGDN"+Time[1],OBJPROP_PRICE1,yGDN);
现在,我们拥有了指标线与基于极值绘制的“全局”上升趋势线之间的交点。将需要检查这些点是否相交。如果找到了相交,将在主图表中设置信号指示符号 - 向下箭头,顺便提及下,这就是我们现在要做的事情。
8.检查 A/D 线与计算出的交点是否相交并设置信号指示符号
要确定 A/D 指标线与交点是否相交,我们只需比较它们的值是否大于/小于,如果指标线在给定条柱上的值小于交点值,而在上一个条柱上的指标值大于交点值,则我们面对的是向下相交:
if (NormalizeDouble(TempIND[1],8) < NormalizeDouble(yGDN,8) &&
     NormalizeDouble(TempIND[2],8) >= NormalizeDouble(yGDN2,8))
    {
        CrossGDN = true;           // Set the flag indicating the downward crossover
        CrossGUP = false;          // Remove the flag indicating the upward crossover

        if (ObjectFind("ArrowGDN"+Time[1])<0)
        ObjectCreate("ArrowGDN"+Time[1],OBJ_ARROW, 0 ,Time[1], iHigh(sy,tf,1)+5*pt);
        ObjectSet("ArrowGDN"+Time[1],OBJPROP_ARROWCODE,242);
        ObjectSet("ArrowGDN"+Time[1],OBJPROP_COLOR,OrangeRed);
        ObjectSet("ArrowGDN"+Time[1],OBJPROP_WIDTH,1);
        ObjectSet("ArrowGDN"+Time[1],OBJPROP_TIME1,Time[1]);
        ObjectSet("ArrowGDN"+Time[1],OBJPROP_PRICE1,iHigh(sy,tf,1)+5*pt);
    }
为了能够进行比较,需要使用标准函数 double NormalizeDouble(double value, int digits) 将双重类型数据值统一为所需的精确度。浮点数将四舍五入为所需的精确度。
计算出的止损位值和获利位值以及挂单的建单价格应统一为预定义变量“位数”中设置的精确度:
if (NormalizeDouble(TempIND[1],8) < NormalizeDouble(yGDN,8) && NormalizeDouble(TempIND[2],8) >= NormalizeDouble(yGDN2,8))
这正是我们在比较指标线值与计算出的交点值时所进行的操作。如果符合此条件,bool 型 CrossGDN 和 CrossGUP 的变量将被分别指派值 true 和 false 。
此代码的下一个块在终端的主图表窗口中设置向下箭头:
if (ObjectFind("ArrowGDN"+Time[1])<0)
  ObjectCreate("ArrowGDN"+Time[1],OBJ_ARROW, 0 ,Time[1], iHigh(sy,tf,1)+5*pt);
  ObjectSet("ArrowGDN"+Time[1],OBJPROP_ARROWCODE,242);
  ObjectSet("ArrowGDN"+Time[1],OBJPROP_COLOR,OrangeRed);
  ObjectSet("ArrowGDN"+Time[1],OBJPROP_WIDTH,1);
  ObjectSet("ArrowGDN"+Time[1],OBJPROP_TIME1,Time[1]);
  ObjectSet("ArrowGDN"+Time[1],OBJPROP_PRICE1,iHigh(sy,tf,1)+5*pt);
我认为,此代码块不需要特殊说明,因为我们已经讨论了可以如何在终端的窗口中设置标记和线条。之前唯一一个未考虑的差异是终端的主图表窗口的规格。此窗口的编号始终为 0,因此,在下行中将 0 设置为窗口标识符
ObjectCreate("ArrowGDN"+Time[1],OBJ_ARROW, 0 ,Time[1], iHigh(sy,tf,1)+5*pt);
我们可以在终端的主窗口中设置箭头。
需要注意的另外几点:条柱的最大价格值(高于此值将设置箭头)将被用作为向下箭头的 y- 坐标(其代码为 242),同时缩进将被设置为 5 个点:
iHigh(sy,tf,1)+5*pt
double iHigh( string symbol, int timeframe, int shift) 返回相关图表中的条柱的参数 shift 指定的最大价格值 (symbol, timeframe)。
将从线条中获取 pt 值,然后立即声明函数变量:
double pt=MarketInfo(Symbol(),MODE_POINT);
这是一个标准函数 double MarketInfo( string symbol, int type)。它将返回有关“市场观察”窗口中列出的金融工具的各种信息。函数查询标识符 MODE_POINT 返回报价货币的点大小。关于当前工具,此值应存储在预定义变量 Point中。下行:
ObjectSet("ArrowGDN"+Time[1],OBJPROP_WIDTH,1);
设置显示箭头的大小 = 1。
9.检查上升趋势线是否在货币对的价格波动方向上 A/D 线相交
上升趋势线的向下相交可能意味着货币对的价格波动可能很快,而同一上升趋势线的向上相交可能意味着价格会继续在同一方向上波动。因此,为了安全起见,我们还要检查这种类型的相交,同时必要时允许停用此检查。
因此,我们通过在函数的第一行中添加传递至函数的另两个参数来更改此行:
int SignalCrossIND(double &TempIND[], int nBars, string sy, int tf, bool local=false, bool add=false)
我们在此增加两个 bool 类型的变量:local 和 add。变量 local 负责显示“局部”趋势线所需进行的计算,而变量 add 用于检查上升趋势线的向上相交和下降趋势线的向下相交。默认情况,这些变量设置为 false,这意味着在调用函数时,函数不会计算也不会显示局部趋势线,也不会检查这些相交。
if (add)
    {
       if (NormalizeDouble(TempIND[1],8) > NormalizeDouble(yGDN,8) &&
           NormalizeDouble(TempIND[2],8) <= NormalizeDouble(yGDN2,8))
           {
              CrossGUP = true;
              CrossGDN = false;
              if (ObjectFind("ArrowGUP"+Time[1])<0)
              ObjectCreate("ArrowGUP"+Time[1],OBJ_ARROW, 0 ,Time[1], iLow(sy,tf,1));
              ObjectSet("ArrowGUP"+Time[1],OBJPROP_ARROWCODE,241);
              ObjectSet("ArrowGUP"+Time[1],OBJPROP_COLOR,Lime);
              ObjectSet("ArrowGUP"+Time[1],OBJPROP_WIDTH,0);
              ObjectSet("ArrowGUP"+Time[1],OBJPROP_TIME1,Time[1]);
              ObjectSet("ArrowGUP"+Time[1],OBJPROP_PRICE1,iLow(sy,tf,1));
           }
    }
此代码块中的内容很熟悉,基本不需要对它进行分析。我们需要查明的是变量 add的检验:
if (add)
与下面的完全相同:
if (add==true)
并检查此变量是否设置为“true”。如果是,将执行给定行后面的对称括号 {} 中包含的所有行。仅剩下两行要进行考虑:
ObjectSet("ArrowGUP"+Time[1],OBJPROP_ARROWCODE,241);
在这里,传递给函数的最后一个参数是向上箭头代码 - 241;
ObjectSet("ArrowGUP"+Time[1],OBJPROP_WIDTH,0);
其中传递给函数的最后一个值表示绘制箭头的大小。在我们的例子中,我们将显示一个大小为 0 的小箭头。
此时我们拥有的代码具有完备的功能,执行以下操作:读取 A/D 指标数据并使用此数据来填充数组,识别指标图表极值,在图表中绘制上升趋势线,检查此线是否与 A/D 指标线相交,如果确定存在此类相交,将在位于终端窗口中的货币工具主图表中设置向上或向下箭头(根据相交方向)。
下面是用于执行类似检查的代码,但此次是针对向下趋势线的。它用于你进行独立分析:
//====================================================================================================
// -------------------- Identification of upper UP minimum and maximum --------------------
//====================================================================================================
    PivotTimeUP = TimeUP[pbar];                           // Time of the main extremum
    PivotBarUP  = iBarShift(sy,tf,TimeUP[pbar]);          // Bar of the main extremum
    PivotPeakUP = PeakUP[pbar];                           // Value of the main extremum

    HighestPeakUP = ArrayMax(PeakUP);                     // Get the upper maximum value
    Index = ArraySearchDouble(PeakUP, HighestPeakUP);     // Get the index of the upper maximum in the array
    HighestBarUP =iBarShift(sy,tf,TimeUP[Index]);         // Get the bar of the upper maximum
    HighestTimeUP = TimeUP[Index];                        // Get the time of the upper maximum

    if (HighestBarUP>PivotBarUP)                          // If the maximum is to the left of the first extremum ...
                                                          // ... (being in 0 cell of the peak time array)
   for (m=Index-1; m>pbar; m--)                           // Loop from the extremum following the maximum to the first extremum
      {
// --------- Draw a virtual trend line and check it for crossovers with other extrema ----------
      CheckCross=EquationDirect(iBarShift(sy,tf,TimeUP[m+1]),
                                PeakUP[m+1],                      // First coordinate of the line
                                PivotBarUP, PivotPeakUP,          // Second coordinate of the line
                                iBarShift(sy,tf,TimeUP[m],false));// Crossing point associated with the next extremum
      if (TempIND[iBarShift(sy,tf,TimeUP[m])]>CheckCross)         // If the extremum lies above the line
         {
            if (PeakUP[m]>PeakUP[pbar])                           // if this extremum is higher the main extremum
               {
                  HighestBarUP =iBarShift(sy,tf,TimeUP[m]);       // Then this is the one we need to start from...
                  HighestPeakUP = PeakUP[m];                      // New coordinates of the next extremum
                  HighestTimeUP = TimeUP[m];
               }
         }
   }

   if (HighestBarUP>PivotBarUP && HighestPeakUP>PivotPeakUP)      // If the maximum is to the left of the main extremum
      {
// ---------------- Draw a downtrend line (UP - extrema) ---------------------
          if (WinID>0)
             {
                if (ObjectFind("Trend_Line_GUP")<0)
                ObjectCreate("Trend_Line_GUP",OBJ_TREND,WinID,HighestTimeUP,HighestPeakUP,PivotTimeUP,PivotPeakUP);
                ObjectSet("Trend_Line_GUP",OBJPROP_COLOR,OrangeRed);
                ObjectSet("Trend_Line_GUP",OBJPROP_TIME1,HighestTimeUP);
                ObjectSet("Trend_Line_GUP",OBJPROP_PRICE1,HighestPeakUP);
                ObjectSet("Trend_Line_GUP",OBJPROP_TIME2,PivotTimeUP);
                ObjectSet("Trend_Line_GUP",OBJPROP_PRICE2,PivotPeakUP);
             }
//---------------- Calculation of levels of the downtrend (UP - extrema) ------------------
    yGUP =EquationDirect(HighestBarUP, HighestPeakUP, PivotBarUP, PivotPeakUP, iBarShift(sy,tf,Time[1],false));
    yGUP2=EquationDirect(HighestBarUP, HighestPeakUP, PivotBarUP, PivotPeakUP, iBarShift(sy,tf,Time[2],false));

//---------------- Draw levels of the downtrend (UP - extrema) ------------------
         if (WinID>0)
            {
               if (ObjectFind("PointGUP"+Time[1])<0)
               ObjectCreate("PointGUP"+Time[1],OBJ_ARROW,WinID,Time[1],yGUP);
               ObjectSet("PointGUP"+Time[1],OBJPROP_ARROWCODE,4);
               ObjectSet("PointGUP"+Time[1],OBJPROP_COLOR,OrangeRed);
               ObjectSet("PointGUP"+Time[1],OBJPROP_TIME1,Time[1]);
               ObjectSet("PointGUP"+Time[1],OBJPROP_PRICE1,yGUP);
            }

// --------------- Check for an upward crossover of the downtrend -----------------
         if (NormalizeDouble(TempIND[1],8) > NormalizeDouble(yGUP,8) &&
             NormalizeDouble(TempIND[2],8) <= NormalizeDouble(yGUP2,8))
               {
                  CrossGUP = true;                 // Set the flag indicating the upward crossover
                  CrossGDN = false;                // Remove the flag indicating the downward crossover

                  if (ObjectFind("ArrowGUP"+Time[1])<0)
                  ObjectCreate("ArrowGUP"+Time[1],OBJ_ARROW, 0 ,Time[1], iLow(sy,tf,1));
                  ObjectSet("ArrowGUP"+Time[1],OBJPROP_ARROWCODE,241);
                  ObjectSet("ArrowGUP"+Time[1],OBJPROP_COLOR,Lime);
                  ObjectSet("ArrowGUP"+Time[1],OBJPROP_WIDTH,1);
                  ObjectSet("ArrowGUP"+Time[1],OBJPROP_TIME1,Time[1]);
                  ObjectSet("ArrowGUP"+Time[1],OBJPROP_PRICE1,iLow(sy,tf,1));
               }

// --------------- Check for a downward crossover of the downtrend -----------------

         if (add)
            {
               if (NormalizeDouble(TempIND[1],8) < NormalizeDouble(yGUP,8) &&
                   NormalizeDouble(TempIND[2],8) >= NormalizeDouble(yGUP2,8))
                  {
                     CrossGDN = true;
                     CrossGUP = false;

                     if (ObjectFind("ArrowGDN"+Time[1])<0)
                     ObjectCreate("ArrowGDN"+Time[1],OBJ_ARROW, 0 ,Time[1], iHigh(sy,tf,1)+15*pt);
                     ObjectSet("ArrowGDN"+Time[1],OBJPROP_ARROWCODE,242);
                     ObjectSet("ArrowGDN"+Time[1],OBJPROP_COLOR,OrangeRed);
                     ObjectSet("ArrowGDN"+Time[1],OBJPROP_WIDTH,0);
                     ObjectSet("ArrowGDN"+Time[1],OBJPROP_TIME1,Time[1]);
                     ObjectSet("ArrowGDN"+Time[1],OBJPROP_PRICE1,iHigh(sy,tf,1)+15*pt);
                  }
            }
      }
10.标识 A/D 图表中的“局部”极值,通过极值绘制趋势线,并检查是否相交
还剩下唯一一件小事情是:按如上所述安排极值。
它们与“全局”极值唯一的不同的是它们的识别方法。它们将使用两个最右侧的极值进行识别,如果(对于上升趋势)第一个极值高于位于其左侧的第二个极值,我们将假设可以绘制趋势线。对于下降趋势,识别的第二个极值应高于第一个极值,且位于第一个极值的左侧。
由于代码与上面介绍的代码完全相同(除了几点之外,实际上基本完全相同),我将提供针对局部上升趋势线的完整代码:
// --------------------------- Identification of two (local) outermost lower DN extrema ------------
   if (local)
      {
         asize=ArraySize(PeakDN);
         for (l=asize-1; l>=1; l--)
            {
               if (PeakDN[l]<PeakDN[l-1])
                  {
                     LastTimeDN     =TimeDN[l-1];
                     LastVarDN      =PeakDN[l-1];
                     PreLastTimeDN  =TimeDN[l];
                     PreLastVarDN   =PeakDN[l];
                  }
            }
// --------------- Draw a local uptrend line (DN - extrema) -----------------
         if (WinID>0)
            {
               if (ObjectFind("Trend_Line_DN")<0)
               ObjectCreate("Trend_Line_DN",OBJ_TREND,WinID,TimeDN[1],PeakDN[1],TimeDN[0],PeakDN[0]);
               ObjectSet("Trend_Line_DN",OBJPROP_COLOR,MediumSeaGreen);
               ObjectSet("Trend_Line_DN",OBJPROP_TIME1,PreLastTimeDN);
               ObjectSet("Trend_Line_DN",OBJPROP_PRICE1,PreLastVarDN);
               ObjectSet("Trend_Line_DN",OBJPROP_TIME2,LastTimeDN);
               ObjectSet("Trend_Line_DN",OBJPROP_PRICE2,LastVarDN);
            }
//---------------- Calculation of levels of the local uptrend (DN - extrema) ----------------
  yDN =EquationDirect(iBarShift(sy,tf,PreLastTimeDN,false), PreLastVarDN,
                      iBarShift(sy,tf,LastTimeDN,false), LastVarDN, iBarShift(sy,tf,Time[1],false));
  yDN2=EquationDirect(iBarShift(sy,tf,PreLastTimeDN,false), PreLastVarDN,
                      iBarShift(sy,tf,LastTimeDN,false), LastVarDN, iBarShift(sy,tf,Time[2],false));

//---------------- Draw levels of the local uptrend (DN - extrema) ----------------
         if (WinID>0)
            {
               if (ObjectFind("PointDN"+Time[1])<0)
               ObjectCreate("PointDN"+Time[1],OBJ_ARROW,WinID,Time[1],yDN);
               ObjectSet("PointDN"+Time[1],OBJPROP_ARROWCODE,4);
               ObjectSet("PointDN"+Time[1],OBJPROP_COLOR,MediumSeaGreen);
               ObjectSet("PointDN"+Time[1],OBJPROP_TIME1,Time[1]);
               ObjectSet("PointDN"+Time[1],OBJPROP_PRICE1,yDN);
            }
// --------------- Check for a downward crossover of the local uptrend -----------------
         if (NormalizeDouble(TempIND[1],8) < NormalizeDouble(yDN,8) &&
             NormalizeDouble(TempIND[2],8) >= NormalizeDouble(yDN2,8))
               {
                  CrossDN = true;
                  CrossUP = false;
                  if (Arrow)                 // If the use of signal indicators is allowed
                     {
                        if (ObjectFind("ArrowDN"+Time[1])<0)
                        ObjectCreate("ArrowDN"+Time[1],OBJ_ARROW, 0 ,Time[1], iHigh(sy,tf,1)+15*pt);
                        ObjectSet("ArrowDN"+Time[1],OBJPROP_ARROWCODE,242);
                        ObjectSet("ArrowDN"+Time[1],OBJPROP_COLOR,Chocolate);
                        ObjectSet("ArrowDN"+Time[1],OBJPROP_WIDTH,1);
                        ObjectSet("ArrowDN"+Time[1],OBJPROP_TIME1,Time[1]);
                        ObjectSet("ArrowDN"+Time[1],OBJPROP_PRICE1,iHigh(sy,tf,1)+15*pt);
                     }
               }
// --------------- Check for an upward crossover of the local uptrend -----------------
         if (add)
            {
               if (NormalizeDouble(TempIND[1],8) > NormalizeDouble(yDN,8) &&
                   NormalizeDouble(TempIND[2],8) <= NormalizeDouble(yDN2,8))
                  {
                     CrossUP = true;
                     CrossDN = false;
                     if (Arrow)                 // If the use of signal indicators is allowed
                        {
                           if (ObjectFind("ArrowUP"+Time[1])<0)
                           ObjectCreate("ArrowUP"+Time[1],OBJ_ARROW, 0 ,Time[1], iLow(sy,tf,1));
                           ObjectSet("ArrowUP"+Time[1],OBJPROP_ARROWCODE,241);
                           ObjectSet("ArrowUP"+Time[1],OBJPROP_COLOR,MediumSeaGreen);
                           ObjectSet("ArrowUP"+Time[1],OBJPROP_WIDTH,0);
                           ObjectSet("ArrowUP"+Time[1],OBJPROP_TIME1,Time[1]);
                           ObjectSet("ArrowUP"+Time[1],OBJPROP_PRICE1,iLow(sy,tf,1));
                        }
                  }
            }
      }
在这里,唯一不同的是绘制趋势线所使用的极值的识别:
if (local)
此行检查是否允许绘制趋势线和计算 A/D 图表的相交。
接着,我们运行整个循环,寻找两个最外面的极值:
asize=ArraySize(PeakDN);
  for (l=asize-1; l>=1; l--)
      {
       if (PeakDN[l]<PeakDN[l-1])
          {
            LastTimeDN     =TimeDN[l-1];
            LastVarDN      =PeakDN[l-1];
            PreLastTimeDN  =TimeDN[l];
            PreLastVarDN   =PeakDN[l];
          }
      }
并将它们的值写入变量 LastTimeDN, LastVarDN、PreLastTimeDN 和 PreLastVarDN 中,其中
- LastTimeDN 包含最后一个极值的时间;
- LastVarDN 包含最后一个极值的值;
- PreLastTimeDN 包含倒数第二个极值的时间;
- PreLastVarDN 包含倒数第二个极值的值。
之后,除用于绘制趋势线和识别与趋势线的相交的变量之外,代码与上面考虑的代码几近相同。最后,我们应设置此最后一项操作返回的函数值,
一般情况下,可能如下所示:
if (CrossGUP || CrossUP) return(1);
   else    if (CrossGDN || CrossDN) return(-1);
   else return(0);
当上升趋势线向下相交时,函数将返回 -1;当下降趋势线向下相交时,函数将返回 1;在所有其他情况下,函数将返回 0 - 这非常简单。
当然,更好的做法是检查上升趋势线和下降趋势线的所有相交情况,是向上还是向下,向它们分配“权重”,根据相交的组合情况,向调用函数返回所需的值以便对信号进行进一步处理。
在总结函数说明时,我想提供它的完整代码,包括做出的一些细微的更改(当确定趋势线与 A/D 图表线相交时能够检查是否允许设置信号指示符号,以及使用标准函数 iTime() 而不是 Time 从而确保函数的通用性)。
在进行了上文的大量讨论之后,希望下面提供的代码易于理解:
//жжжжжжжжжжжжжжжжжжжжжжжжжжжжжжжжжжжжжжжжжжжжжжжжжжжжжжжжжжжжжжжжжжжжжжжжжжжжжжжжжжжжжжжжжж // Identification of a crossover of the trend line and the A/D chart line and setting of the signal indicators //жжжжжжжжжжжжжжжжжжжжжжжжжжжжжжжжжжжжжжжжжжжжжжжжжжжжжжжжжжжжжжжжжжжжжжжжжжжжжжжжжжжжжжжжжж // TempIND[] - (declared on the global level) array for storing A/D indicator data // nBars - number of bars for identification of extrema // sy - working symbol: "" or NULL - current symbol of the chart // tf - working time frame: 0 - current, // local - whether to calculate based on local trends: by default - false // add - whether to react to the crossover of the trend in the direction of the trend: by default - false // Arrow - whether to set signal indicators in the currency instrument chart // when a crossover of the trend line and the A/D chart line is identified: by default - true //========================================================================================== int SignalCrossIND(double &TempIND[], int nBars, string sy, int tf, bool local=false, bool add=false, bool Arrow=true) { if (sy=="" || sy=="0") sy = Symbol(); ArrayResize(TempIND,nBars); // Resize the array according to the size passed to the function for (int j=0; j<=nBars-1; j++) { TempIND[j]=iAD(sy,tf,j); // Write the indicator data in the loop into the array } // ========================================================================================== // ------------------------------------ Function variables ---------------------------------+ // ========================================================================================== double PeakUP[], PeakDN[], // Declare peak/trough arrays yUP, yDN, yGUP, yGDN, // Coordinates of the crossing point between the trend line and indicator UP and DN on the 1st bar yUP2, yDN2, yGUP2, yGDN2, // Coordinates of the crossing point between the trend line and indicator UP and DN on the 2nd bar CheckCross, PreLastVarDN,LastVarDN, // Values of the last and last but one lower extrema PreLastVarUP,LastVarUP, // Values of the last and last but one upper extrema PivotPeakDN,PivotPeakUP, LowestPeakDN,HighestPeakDN, // Values of the lower minimum and maximum LowestPeakUP,HighestPeakUP, // Values of the upper minimum and maximum datetime TimeDN[], TimeUP[], // Arrays for storing bars of extrema PreLastTimeDN, LastTimeDN, // Time of the last and last but one lower extrema PreLastTimeUP, LastTimeUP, // Time of the last and last but one upper extrema PivotBarDN, PivotTimeDN, // Bar and time of the lower main extremum PivotBarUP, PivotTimeUP, // Bar and time of the upper main extremum LowestBarDN, LowestTimeDN, // Bar and time of the lower minimum HighestBarUP, HighestTimeUP; // Bar and time of the upper maximum int i, kup, kdn, pbar=2, m, l, t, asize, Index, // "Internal" variables WinID=WindowFind("A/D"); // AD window number bool CrossDN = false, // Flag indicating the downward crossover of the local trend CrossUP = false, // Flag indicating the upward crossover of the local trend CrossGDN = false, // Flag indicating the downward crossover of the global trend CrossGUP = false; // Flag indicating the upward crossover of the global trend double pt=MarketInfo(Symbol(),MODE_POINT); // Point size in the quote currency // ========================================================================================== // ------------------ Filling arrays with data on peaks and troughs ----------------------+ // ========================================================================================== kdn=0; // Initialize the trough array index for (i=2; i<=nBars-1; i++) // Run through the array of values from the 2nd bar deep into history { if (TempIND[i]<TempIND[i-1] && TempIND[i+1]>=TempIND[i]) // Trough identified WAS THERE >= { ArrayResize(PeakDN, kdn+1); // Resize the trough array according to the number of troughs identified ArrayResize(TimeDN, kdn+1); // Resize the trough time array according to the number of troughs PeakDN[kdn]=TempIND[i]; // Write the trough value into the trough array... TimeDN[kdn]=iTime(sy,tf,i); // ...and the time array kdn++; // Increase the trough array index } } // ----------------------------------------------------------------------------------------------------------- kup=0; // Initialize the peak array index for (i=2; i<=nBars-1; i++) // Run through the array of values from the 2nd bar deep into history { if (TempIND[i]>TempIND[i-1] && // WAS THERE > TempIND[i+1]<=TempIND[i]) // Peak identified WAS THERE <= { ArrayResize(PeakUP, kup+1); // Resize the peak array according to the number of peaks identified ArrayResize(TimeUP, kup+1); // Resize the peak time array according to the number of peaks PeakUP[kup]=TempIND[i]; // Write its value into the peak array... TimeUP[kup]=iTime(sy,tf,i); // ...and the time array kup++; // Increase the peak array index } } //==================================================================================================== // --------------------------- Identification of the lower minimum and main DN extremum -----------------+ //==================================================================================================== PivotTimeDN = TimeDN[pbar]; // Time of the main extremum PivotBarDN = iBarShift(sy,tf,TimeDN[pbar]); // Bar of the main extremum PivotPeakDN = PeakDN[pbar]; // Value of the main extremum LowestPeakDN = ArrayMin(PeakDN); // Get the lower minimum value Index = ArraySearchDouble(PeakDN, LowestPeakDN); // Get the index of the lower minimum in the array LowestBarDN =iBarShift(sy,tf,TimeDN[Index]); // Get the bar of the lower minimum LowestTimeDN = TimeDN[Index]; // Get the time of the lower minimum if (LowestBarDN>PivotBarDN) // If the minimum is to the left of the first extremum ... // ... (being in 0 cell of the trough time array) for (m=Index-1; m>pbar; m--) // Loop from the extremum following the minimum to the first extremum { // --------- Draw a virtual trend line and check it for crossovers with other extrema ---------- CheckCross=EquationDirect(iBarShift(sy,tf,TimeDN[m+1]), PeakDN[m+1], // First coordinate of the line PivotBarDN, PivotPeakDN, // Second coordinate of the line iBarShift(sy,tf,TimeDN[m],false));// Crossing point associated with the next extremum if (TempIND[iBarShift(sy,tf,TimeDN[m])]<CheckCross) // If the extremum lies below the line { if (PeakDN[m]<PeakDN[pbar]) // if this extremum is lower than the main extremum { LowestBarDN =iBarShift(sy,tf,TimeDN[m]); // Then this is the one we need to start from... LowestPeakDN = PeakDN[m]; // New coordinates of the next extremum LowestTimeDN = TimeDN[m]; } } } if (LowestBarDN>PivotBarDN && LowestPeakDN<PivotPeakDN) // If the minimum is to the left of and below the main extremum { // --------------- Draw an uptrend line for adjustment (DN - extrema) --------------------- if (WinID>0) { if (ObjectFind("Trend_GLine_DN")<0) ObjectCreate("Trend_GLine_DN",OBJ_TREND,WinID,LowestTimeDN,LowestPeakDN,PivotTimeDN,PivotPeakDN); ObjectSet("Trend_GLine_DN",OBJPROP_COLOR,Lime); ObjectSet("Trend_GLine_DN",OBJPROP_TIME1,LowestTimeDN); ObjectSet("Trend_GLine_DN",OBJPROP_PRICE1,LowestPeakDN); ObjectSet("Trend_GLine_DN",OBJPROP_TIME2,PivotTimeDN); ObjectSet("Trend_GLine_DN",OBJPROP_PRICE2,PivotPeakDN); } //---------------- Calculation of levels of the uptrend (DN - extrema) ---------------- yGDN =EquationDirect(LowestBarDN, LowestPeakDN,PivotBarDN, PivotPeakDN, iBarShift(sy,tf,iTime(sy,tf,1),false)); yGDN2=EquationDirect(LowestBarDN, LowestPeakDN,PivotBarDN, PivotPeakDN, iBarShift(sy,tf,iTime(sy,tf,2),false)); //---------------- Draw levels of the uptrend (DN - extrema) ------------------ if (WinID>0) { if (ObjectFind("PointGDN"+iTime(sy,tf,1))<0) ObjectCreate("PointGDN"+iTime(sy,tf,1),OBJ_ARROW,WinID,iTime(sy,tf,1),yGDN); ObjectSet("PointGDN"+iTime(sy,tf,1),OBJPROP_ARROWCODE,4); ObjectSet("PointGDN"+iTime(sy,tf,1),OBJPROP_COLOR,Lime); ObjectSet("PointGDN"+iTime(sy,tf,1),OBJPROP_TIME1,iTime(sy,tf,1)); ObjectSet("PointGDN"+iTime(sy,tf,1),OBJPROP_PRICE1,yGDN); } // --------------- Check for a downward crossover of the uptrend ----------------- if (NormalizeDouble(TempIND[1],8) < NormalizeDouble(yGDN,8) && NormalizeDouble(TempIND[2],8) >= NormalizeDouble(yGDN2,8)) { CrossGDN = true; // Set the flag indicating the downward crossover CrossGUP = false; // Remove the flag indicating the upward crossover if (Arrow) // If the use of signal indicators is allowed { if (ObjectFind("ArrowGDN"+iTime(sy,tf,1))<0) ObjectCreate("ArrowGDN"+iTime(sy,tf,1),OBJ_ARROW, 0 ,iTime(sy,tf,1), iHigh(sy,tf,1)+5*pt); ObjectSet("ArrowGDN"+iTime(sy,tf,1),OBJPROP_ARROWCODE,242); ObjectSet("ArrowGDN"+iTime(sy,tf,1),OBJPROP_COLOR,OrangeRed); ObjectSet("ArrowGDN"+iTime(sy,tf,1),OBJPROP_WIDTH,1); ObjectSet("ArrowGDN"+iTime(sy,tf,1),OBJPROP_TIME1,iTime(sy,tf,1)); ObjectSet("ArrowGDN"+iTime(sy,tf,1),OBJPROP_PRICE1,iHigh(sy,tf,1)+5*pt); } } // --------------- Check for an upward crossover of the uptrend ----------------- if (add) { if (NormalizeDouble(TempIND[1],8) > NormalizeDouble(yGDN,8) && NormalizeDouble(TempIND[2],8) <= NormalizeDouble(yGDN2,8)) { CrossGUP = true; CrossGDN = false; if (Arrow) // If the use of signal indicators is allowed { if (ObjectFind("ArrowGUP"+iTime(sy,tf,1))<0) ObjectCreate("ArrowGUP"+iTime(sy,tf,1),OBJ_ARROW, 0 ,iTime(sy,tf,1), iLow(sy,tf,1)); ObjectSet("ArrowGUP"+iTime(sy,tf,1),OBJPROP_ARROWCODE,241); ObjectSet("ArrowGUP"+iTime(sy,tf,1),OBJPROP_COLOR,Lime); ObjectSet("ArrowGUP"+iTime(sy,tf,1),OBJPROP_WIDTH,0); ObjectSet("ArrowGUP"+iTime(sy,tf,1),OBJPROP_TIME1,iTime(sy,tf,1)); ObjectSet("ArrowGUP"+iTime(sy,tf,1),OBJPROP_PRICE1,iLow(sy,tf,1)); } } } } //==================================================================================================== // -------------------- Identification of the upper maximum and main UP extremum ----------------------+ //==================================================================================================== PivotTimeUP = TimeUP[pbar]; // Time of the main extremum PivotBarUP = iBarShift(sy,tf,TimeUP[pbar]); // Bar of the main extremum PivotPeakUP = PeakUP[pbar]; // Value of the main extremum HighestPeakUP = ArrayMax(PeakUP); // Get the value of the upper maximum Index = ArraySearchDouble(PeakUP, HighestPeakUP); // Get the index of the upper maximum in the array HighestBarUP =iBarShift(sy,tf,TimeUP[Index]); // Get the bar of the upper maximum HighestTimeUP = TimeUP[Index]; // Get the time of the upper maximum if (HighestBarUP>PivotBarUP) // If the maximum is to the left of the first extremum ... // ... (being in 0 cell of the peak time array) for (m=Index-1; m>pbar; m--) // Loop from the extremum following the maximum to the first extremum { // --------- Draw a virtual trend line and check it for crossovers with other extrema ---------- CheckCross=EquationDirect(iBarShift(sy,tf,TimeUP[m+1]), PeakUP[m+1], // First coordinate of the line PivotBarUP, PivotPeakUP, // Second coordinate of the line iBarShift(sy,tf,TimeUP[m],false)); // Crossing point associated with the next extremum if (TempIND[iBarShift(sy,tf,TimeUP[m])]>CheckCross) // If the extremum lies above the line { if (PeakUP[m]>PeakUP[pbar]) // if this extremum is higher than the main extremum { HighestBarUP =iBarShift(sy,tf,TimeUP[m]); // Then this is the one we need to start from... HighestPeakUP = PeakUP[m]; // New coordinates of the next extremum HighestTimeUP = TimeUP[m]; } } } if (HighestBarUP>PivotBarUP && HighestPeakUP>PivotPeakUP) // If the maximum is to the left of the main extremum { // ---------------- Draw a downtrend line (UP - extrema) --------------------- if (WinID>0) { if (ObjectFind("Trend_Line_GUP")<0) ObjectCreate("Trend_Line_GUP",OBJ_TREND,WinID,HighestTimeUP,HighestPeakUP,PivotTimeUP,PivotPeakUP); ObjectSet("Trend_Line_GUP",OBJPROP_COLOR,OrangeRed); ObjectSet("Trend_Line_GUP",OBJPROP_TIME1,HighestTimeUP); ObjectSet("Trend_Line_GUP",OBJPROP_PRICE1,HighestPeakUP); ObjectSet("Trend_Line_GUP",OBJPROP_TIME2,PivotTimeUP); ObjectSet("Trend_Line_GUP",OBJPROP_PRICE2,PivotPeakUP); } //---------------- Calculation of levels of the downtrend (UP - extrema) ------------------ yGUP =EquationDirect(HighestBarUP, HighestPeakUP, PivotBarUP, PivotPeakUP, iBarShift(sy,tf,iTime(sy,tf,1),false)); yGUP2=EquationDirect(HighestBarUP, HighestPeakUP, PivotBarUP, PivotPeakUP, iBarShift(sy,tf,iTime(sy,tf,2),false)); //---------------- Draw levels of the downtrend (UP - extrema) ------------------ if (WinID>0) { if (ObjectFind("PointGUP"+iTime(sy,tf,1))<0) ObjectCreate("PointGUP"+iTime(sy,tf,1),OBJ_ARROW,WinID,iTime(sy,tf,1),yGUP); ObjectSet("PointGUP"+iTime(sy,tf,1),OBJPROP_ARROWCODE,4); ObjectSet("PointGUP"+iTime(sy,tf,1),OBJPROP_COLOR,OrangeRed); ObjectSet("PointGUP"+iTime(sy,tf,1),OBJPROP_TIME1,iTime(sy,tf,1)); ObjectSet("PointGUP"+iTime(sy,tf,1),OBJPROP_PRICE1,yGUP); } // --------------- Check for an upward crossover of the downtrend ----------------- if (NormalizeDouble(TempIND[1],8) > NormalizeDouble(yGUP,8) && NormalizeDouble(TempIND[2],8) <= NormalizeDouble(yGUP2,8)) { CrossGUP = true; // Set the flag indicating the upward crossover CrossGDN = false; // Remove the flag indicating the downward crossover if (Arrow) // If the use of signal indicators is allowed { if (ObjectFind("ArrowGUP"+iTime(sy,tf,1))<0) ObjectCreate("ArrowGUP"+iTime(sy,tf,1),OBJ_ARROW, 0 ,iTime(sy,tf,1), iLow(sy,tf,1)); ObjectSet("ArrowGUP"+iTime(sy,tf,1),OBJPROP_ARROWCODE,241); ObjectSet("ArrowGUP"+iTime(sy,tf,1),OBJPROP_COLOR,Lime); ObjectSet("ArrowGUP"+iTime(sy,tf,1),OBJPROP_WIDTH,1); ObjectSet("ArrowGUP"+iTime(sy,tf,1),OBJPROP_TIME1,iTime(sy,tf,1)); ObjectSet("ArrowGUP"+iTime(sy,tf,1),OBJPROP_PRICE1,iLow(sy,tf,1)); } } // --------------- Check for a downward crossover of the downtrend ----------------- if (add) { if (NormalizeDouble(TempIND[1],8) < NormalizeDouble(yGUP,8) && NormalizeDouble(TempIND[2],8) >= NormalizeDouble(yGUP2,8)) { CrossGDN = true; CrossGUP = false; if (Arrow) // If the use of signal indicators is allowed { if (ObjectFind("ArrowGDN"+iTime(sy,tf,1))<0) ObjectCreate("ArrowGDN"+iTime(sy,tf,1),OBJ_ARROW, 0 ,iTime(sy,tf,1), iHigh(sy,tf,1)+15*pt); ObjectSet("ArrowGDN"+iTime(sy,tf,1),OBJPROP_ARROWCODE,242); ObjectSet("ArrowGDN"+iTime(sy,tf,1),OBJPROP_COLOR,OrangeRed); ObjectSet("ArrowGDN"+iTime(sy,tf,1),OBJPROP_WIDTH,0); ObjectSet("ArrowGDN"+iTime(sy,tf,1),OBJPROP_TIME1,iTime(sy,tf,1)); ObjectSet("ArrowGDN"+iTime(sy,tf,1),OBJPROP_PRICE1,iHigh(sy,tf,1)+15*pt); } } } } //жжжжжжжжжжжжжжжжжжжжжжжжжжжжжжжжжжжжжжжжжжжжжжжжжжжжжжжжжжжжжжжжжжжжжжжжжжжжжжжжжжжжжжжжжжж // ========================================================================================== // ------------------ Identification of two (local) outermost lower DN extrema -----------------+ // ========================================================================================== if (local) { asize=ArraySize(PeakDN); for (l=asize-1; l>=1; l--) { if (PeakDN[l]<PeakDN[l-1]) { LastTimeDN =TimeDN[l-1]; LastVarDN =PeakDN[l-1]; PreLastTimeDN =TimeDN[l]; PreLastVarDN =PeakDN[l]; } } // --------------- Draw a local uptrend line (DN - extrema) --------------------- if (WinID>0) { if (ObjectFind("Trend_Line_DN")<0) ObjectCreate("Trend_Line_DN",OBJ_TREND,WinID,TimeDN[1],PeakDN[1],TimeDN[0],PeakDN[0]); ObjectSet("Trend_Line_DN",OBJPROP_COLOR,MediumSeaGreen); ObjectSet("Trend_Line_DN",OBJPROP_TIME1,PreLastTimeDN); ObjectSet("Trend_Line_DN",OBJPROP_PRICE1,PreLastVarDN); ObjectSet("Trend_Line_DN",OBJPROP_TIME2,LastTimeDN); ObjectSet("Trend_Line_DN",OBJPROP_PRICE2,LastVarDN); } //---------------- Calculation of levels of the local uptrend (DN - extrema) ---------------- yDN =EquationDirect(iBarShift(sy,tf,PreLastTimeDN,false), PreLastVarDN, iBarShift(sy,tf,LastTimeDN,false), LastVarDN, iBarShift(sy,tf,iTime(sy,tf,1),false)); yDN2=EquationDirect(iBarShift(sy,tf,PreLastTimeDN,false), PreLastVarDN, iBarShift(sy,tf,LastTimeDN,false), LastVarDN, iBarShift(sy,tf,iTime(sy,tf,2),false)); //---------------- Draw levels of the local uptrend (DN - extrema) ------------------ if (WinID>0) { if (ObjectFind("PointDN"+iTime(sy,tf,1))<0) ObjectCreate("PointDN"+iTime(sy,tf,1),OBJ_ARROW,WinID,iTime(sy,tf,1),yDN); ObjectSet("PointDN"+iTime(sy,tf,1),OBJPROP_ARROWCODE,4); ObjectSet("PointDN"+iTime(sy,tf,1),OBJPROP_COLOR,MediumSeaGreen); ObjectSet("PointDN"+iTime(sy,tf,1),OBJPROP_TIME1,iTime(sy,tf,1)); ObjectSet("PointDN"+iTime(sy,tf,1),OBJPROP_PRICE1,yDN); } // --------------- Check for a downward crossover of the local uptrend ----------------- if (NormalizeDouble(TempIND[1],8) < NormalizeDouble(yDN,8) && NormalizeDouble(TempIND[2],8) >= NormalizeDouble(yDN2,8)) { CrossDN = true; CrossUP = false; if (Arrow) // If the use of signal indicators is allowed { if (ObjectFind("ArrowDN"+iTime(sy,tf,1))<0) ObjectCreate("ArrowDN"+iTime(sy,tf,1),OBJ_ARROW, 0 ,iTime(sy,tf,1), iHigh(sy,tf,1)+15*pt); ObjectSet("ArrowDN"+iTime(sy,tf,1),OBJPROP_ARROWCODE,242); ObjectSet("ArrowDN"+iTime(sy,tf,1),OBJPROP_COLOR,Chocolate); ObjectSet("ArrowDN"+iTime(sy,tf,1),OBJPROP_WIDTH,1); ObjectSet("ArrowDN"+iTime(sy,tf,1),OBJPROP_TIME1,iTime(sy,tf,1)); ObjectSet("ArrowDN"+iTime(sy,tf,1),OBJPROP_PRICE1,iHigh(sy,tf,1)+15*pt); } } // --------------- Check for an upward crossover of the local uptrend ----------------- if (add) { if (NormalizeDouble(TempIND[1],8) > NormalizeDouble(yDN,8) && NormalizeDouble(TempIND[2],8) <= NormalizeDouble(yDN2,8)) { CrossUP = true; CrossDN = false; if (Arrow) // If the use of signal indicators is allowed { if (ObjectFind("ArrowUP"+iTime(sy,tf,1))<0) ObjectCreate("ArrowUP"+iTime(sy,tf,1),OBJ_ARROW, 0 ,iTime(sy,tf,1), iLow(sy,tf,1)); ObjectSet("ArrowUP"+iTime(sy,tf,1),OBJPROP_ARROWCODE,241); ObjectSet("ArrowUP"+iTime(sy,tf,1),OBJPROP_COLOR,MediumSeaGreen); ObjectSet("ArrowUP"+iTime(sy,tf,1),OBJPROP_WIDTH,0); ObjectSet("ArrowUP"+iTime(sy,tf,1),OBJPROP_TIME1,iTime(sy,tf,1)); ObjectSet("ArrowUP"+iTime(sy,tf,1),OBJPROP_PRICE1,iLow(sy,tf,1)); } } } } //==================================================================================================== // ------------------------- Identification of two (local) outermost upper UP extrema ------------------+ //==================================================================================================== if (local) { asize=ArraySize(PeakUP); for (l=asize-1; l>=1; l--) { if (PeakUP[l]>PeakUP[l-1]) { LastTimeUP =TimeUP[l-1]; LastVarUP =PeakUP[l-1]; PreLastTimeUP =TimeUP[l]; PreLastVarUP =PeakUP[l]; } } // ---------------- Draw a local downtrend line (UP - extrema) --------------------- if (WinID>0) { if (ObjectFind("Trend_Line_UP")<0) ObjectCreate("Trend_Line_UP",OBJ_TREND,WinID,TimeUP[1],PeakUP[1],TimeUP[0],PeakUP[0]); ObjectSet("Trend_Line_UP",OBJPROP_COLOR,Chocolate); ObjectSet("Trend_Line_UP",OBJPROP_TIME1,PreLastTimeUP); ObjectSet("Trend_Line_UP",OBJPROP_PRICE1,PreLastVarUP); ObjectSet("Trend_Line_UP",OBJPROP_TIME2,LastTimeUP); ObjectSet("Trend_Line_UP",OBJPROP_PRICE2,LastVarUP); } //---------------- Calculation of levels of the local downtrend (UP - extrema) ------------------ yUP =EquationDirect(iBarShift(sy,tf,PreLastTimeUP,false), PreLastVarUP, iBarShift(sy,tf,LastTimeUP,false), LastVarUP, iBarShift(sy,tf,iTime(sy,tf,1),false)); yUP2=EquationDirect(iBarShift(sy,tf,PreLastTimeUP,false), PreLastVarUP, iBarShift(sy,tf,LastTimeUP,false), LastVarUP, iBarShift(sy,tf,iTime(sy,tf,2),false)); //---------------- Draw levels of the local downtrend (UP - extrema) ------------------ if (WinID>0) { if (ObjectFind("PointUP"+iTimeiTimesy,tf,1))<0) ObjectCreate("PointUP"+iTime(sy,tf,1),OBJ_ARROW,WinID,iTime(sy,tf,1),yUP); ObjectSet("PointUP"+iTime(sy,tf,1),OBJPROP_ARROWCODE,4); ObjectSet("PointUP"+iTime(sy,tf,1),OBJPROP_COLOR,Chocolate); ObjectSet("PointUP"+iTime(sy,tf,1),OBJPROP_TIME1,iTime(sy,tf,1)); ObjectSet("PointUP"+iTime(sy,tf,1),OBJPROP_PRICE1,yUP); } // --------------- Check for an upward crossover of the local downtrend ----------------- if (NormalizeDouble(TempIND[1],8) > NormalizeDouble(yUP,8) && NormalizeDouble(TempIND[2],8) <= NormalizeDouble(yUP2,8)) { CrossUP = true; CrossDN = false; if (Arrow) // If the use of signal indicators is allowed { if (ObjectFind("ArrowUP"+iTime(sy,tf,1))<0) ObjectCreate("ArrowUP"+iTime(sy,tf,1),OBJ_ARROW, 0 ,iTime(sy,tf,1), iLow(sy,tf,1)); ObjectSet("ArrowUP"+iTime(sy,tf,1),OBJPROP_ARROWCODE,241); ObjectSet("ArrowUP"+iTime(sy,tf,1),OBJPROP_COLOR,MediumSeaGreen); ObjectSet("ArrowUP"+iTime(sy,tf,1),OBJPROP_WIDTH,1); ObjectSet("ArrowUP"+iTime(sy,tf,1),OBJPROP_TIME1,iTime(sy,tf,1)); ObjectSet("ArrowUP"+iTime(sy,tf,1),OBJPROP_PRICE1,iLow(sy,tf,1)); } } // --------------- Check for a downward crossover of the local downtrend ----------------- if (add) { if (NormalizeDouble(TempIND[1],8) < NormalizeDouble(yUP,8) && NormalizeDouble(TempIND[2],8) >= NormalizeDouble(yUP2,8)) { CrossDN = true; CrossUP = false; if (Arrow) // If the use of signal indicators is allowed { if (ObjectFind("ArrowDN"+iTime(sy,tf,1))<0) ObjectCreate("ArrowDN"+iTime(sy,tf,1),OBJ_ARROW, 0 ,iTime(sy,tf,1), iHigh(sy,tf,1)+15*pt); ObjectSet("ArrowDN"+iTime(sy,tf,1),OBJPROP_ARROWCODE,242); ObjectSet("ArrowDN"+iTime(sy,tf,1),OBJPROP_COLOR,Chocolate); ObjectSet("ArrowDN"+iTime(sy,tf,1),OBJPROP_WIDTH,0); ObjectSet("ArrowDN"+iTime(sy,tf,1),OBJPROP_TIME1,iTime(sy,tf,1)); ObjectSet("ArrowDN"+iTime(sy,tf,1),OBJPROP_PRICE1,iHigh(sy,tf,1)+15*pt); } } } } // ----------------------------------------------------------------------------------------------------------- // The conditions here can be represented by CrossGUP and CrossGDN, as well as CrossUP and CrossDN. // In the first case, we have a "global trend" on all specified bars, // in the second case, we have local trends on the last two extrema. // You can also combine signals of crossovers of "global" and "local" trends in the A/D chart /* if (CrossGUP && CrossUP) return(11); // An upward crossover of both downtrends else if (CrossGDN && CrossDN) return(-11); // A downward crossover of both uptrends else if (CrossGUP) return(10); // An upward crossover of the "global" downtrend else if (CrossGDN) return(-10); // A downward crossover of the "global" uptrend else if (CrossUP) return(1); // An upward crossover of the "local" downtrend else if (CrossDN) return(-1); // A downward crossover of the "local" uptrend */ if (CrossGUP || CrossUP) return(1); else if (CrossGDN || CrossDN) return(-1); else return(0); }
上述代码与我们已经分析的代码基本相同,因此,我将仅对函数的输入参数和调用函数的方法进行注释。
int SignalCrossIND(double &TempIND[], int nBars, string sy, int tf, bool local=false, bool add=false, bool Arrow=true)
与前面的介绍的代码相比,我们在这里添加另一 bool 类型的变量 - Arrow,用于在终端的主窗口中显示信号指示符号。此值默认为 true,即,如果要在图表中显示箭头,则在调用函数时可忽视此参数。
通常,函数调用可如下所示:在 EA 的全局变量中插入以下行:
double TempIND[]; // Array for storing indicator data
然后,在函数中,指定识别 A/D 图表中的极值以接收交易信号所需的历史条柱数量。
int nBrs=30;
或者,例如
int nBrs=200;
在这里,一切都取决于 TF 趋势线绘制将基于的内容以及将要处理的历史条柱数量。值越大,趋势线在 A/D 图表中就越稳定,但相交信号就会越延迟。
最后,函数调用本身如下所示:
int sig=0;
   sig=SignalCrossIND(TempIND, nBrs, NULL, 5, false, false, true);
      if (sig==1)
      {Code for opening a Buy position}
   if (sig==-1)
      {Code for opening a Sell position}
在这里,传递的参数值意味着:将从货币工具的当前图表中获取数据 (NULL),将使用的时间范围为 М5 (5),将不绘制局部趋势线且不查找这些线的相交情况 (false),此外,将不查找在趋势方向上的相交情况 (false),同时将在主图表窗口中显示信号指示符号(向上/向下箭头)(true)。
由于所有这些都是默认值,以下函数调用被认为完全相同:
sig=SignalCrossIND(TempIND, nBrs, NULL, 5);
总结
综合上述内容,我想说的是此函数并不是一个独立的交易策略。它仅仅是一个用于识别在 A/D 指标图表中绘制的趋势线与指标线的相交的函数。在 EA 中,它可以与其他函数一起很好的使用。
为了了解它的功能,我在 2009 年 1 月 1 日到 2010 年 1 月 1 日的时间间隔内进行了测试。此测试仅使用此函数返回的值执行。我禁用了 EA 的信号模块,并仅用此函数进行了替代。用于识别极值的条柱数量 = 250。The time frame = 5,选择的交易品种为 EURUSD,初始保证金为 10000,固定手数为 0.1。
我还禁用了 SL 和 TP。我只保留了跟踪止损位,用于在超过三次到达设定的获利位(自然各个阶段都有所不同)时部分平仓。当从函数中获得信号后,进行了建仓。
在此例子中,未平掉反向仓位。在收到有关现有仓位的方向的信号后,我需要确定上一个仓位建立后所过去的时长,如果时长超过 7 分钟,将建立新的仓位。简单地说,我使用了最高的保证金...:)另一个我差点忘记提到的事情是,为了立即平掉所有仓位,我使用了按设定百分比提高股本。在此测试中,我将百分比设置为了 5%。
生成的表示一年的数据的图表如下所示:
显然,它不能应用于真实帐户,然而,我认为,它本身有重要作用(尤其当它仅仅是一个信号函数时)。
最后,我想向为我提供无私帮助和友好支持的 Viktor (Vinin) 和 Aleksey (Mathemat) 以及所有以各种方式帮助解决各种编程问题的人员表示最衷心的感谢。
本文由MetaQuotes Ltd译自俄文
原文地址: https://www.mql5.com/ru/articles/1357
注意: MetaQuotes Ltd.将保留所有关于这些材料的权利。全部或部分复制或者转载这些材料将被禁止。
本文由网站的一位用户撰写,反映了他们的个人观点。MetaQuotes Ltd 不对所提供信息的准确性负责,也不对因使用所述解决方案、策略或建议而产生的任何后果负责。

 在Linux上运行MetaTrader 4
 交易者的工具箱: 拖动交易库(Drag Trade Library)
 随机沙盒
随机沙盒
 合成柱 - 显示价格图形信息的新视角