• Genel bakış
  • İncelemeler (2)
  • Yorumlar
  • Yenilikler

PointZero

5

Concept

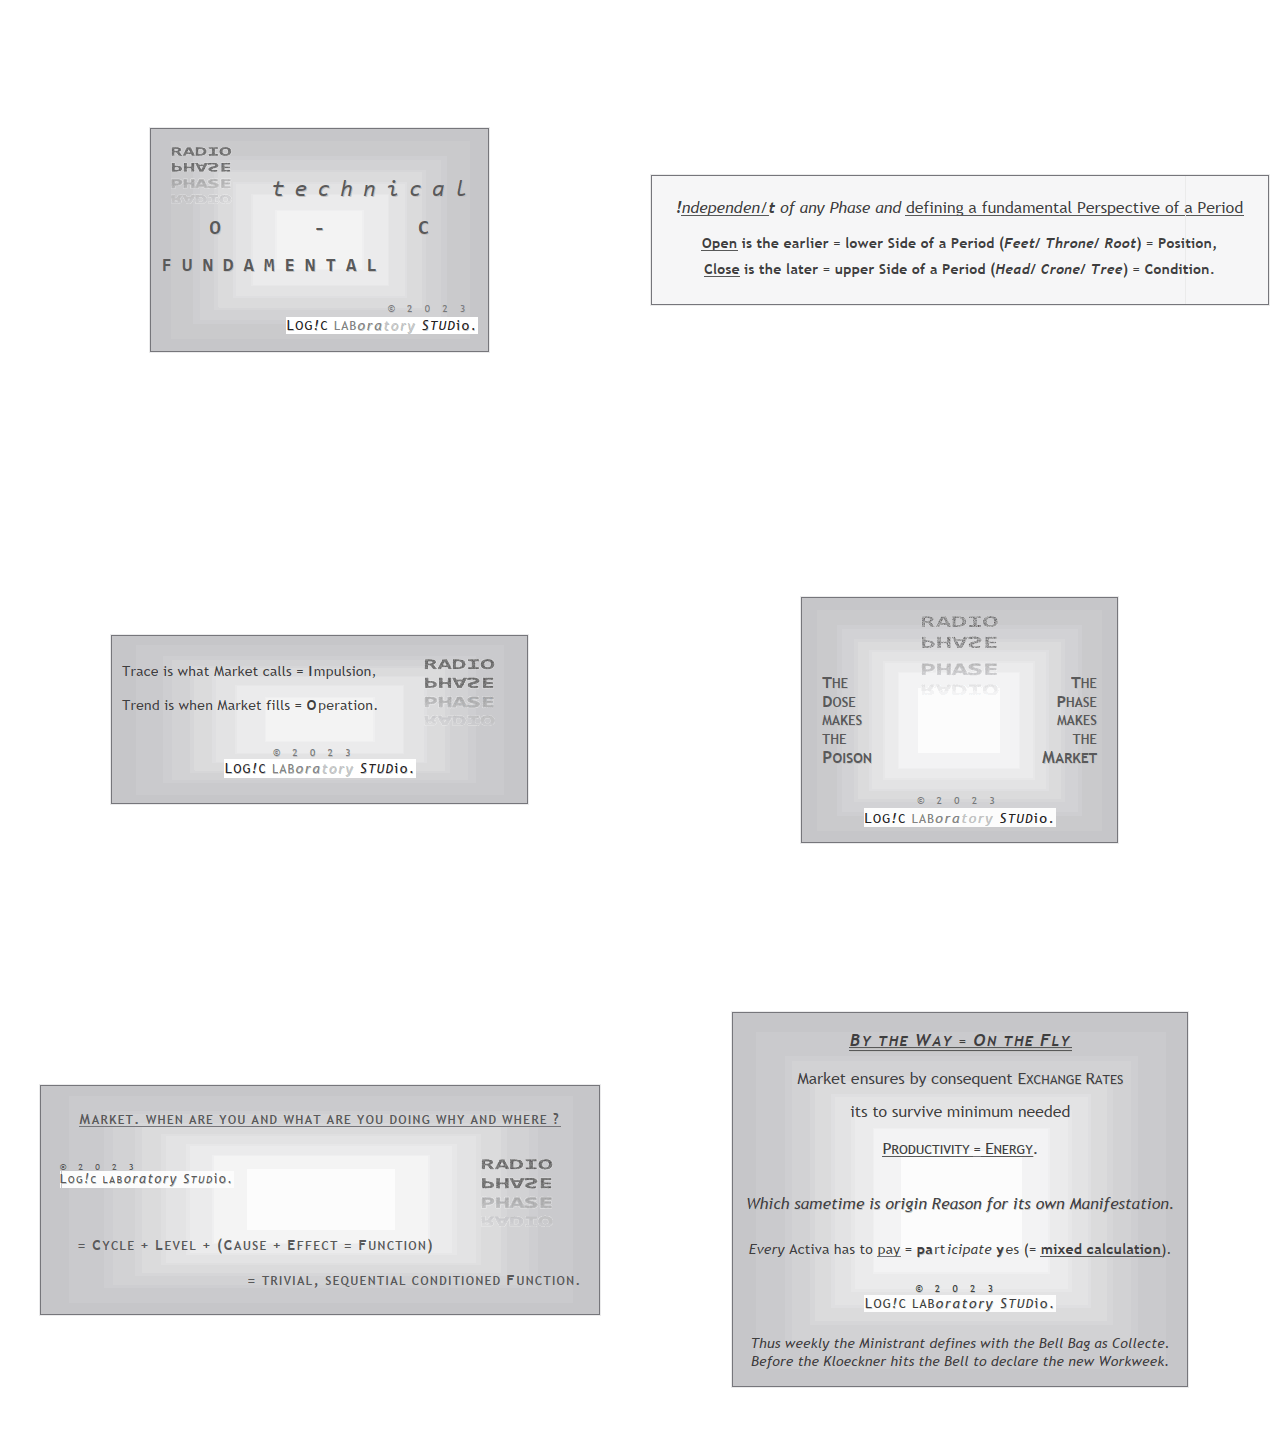
Market arranges in Time upcoming Phases according to the present Results of its Interest.

Directing Modulations are an Interaction of immanent Periods, which show in Reference

  • to Time cyclic Activity and
  • to Price leveling Activity.

PointZero is a projecting Price Mask of this Concept of Time and Price and

  • categorizing developed Price Movements related to their own Range: how far moved ?
  • indicating their Status by marking special Events: when which Action ?
  • setting the Situation in a functional Relation to the presented Support/ Resistance - Motive: miss/ hit/ pass ?


synthesize and project

Arrange with its underlying, grounding Components

  • Time Price Channel
  • Triple Pivot

and its conditional indicating Period Event Notation a situational Coordinate System.


Content

Time Price Channel

The D1/ W1/ MN - Channel consists of Shells around the ranging Center, which reflect the

periodic Alterations by its Separation in High-/Low-Bands and central Moving Averages.


Period Event Notation

Positions, Expansions and Distances are measured against the own Range,

as also against the Channelrange, of which a Period the Body and (Part of) the Move is.

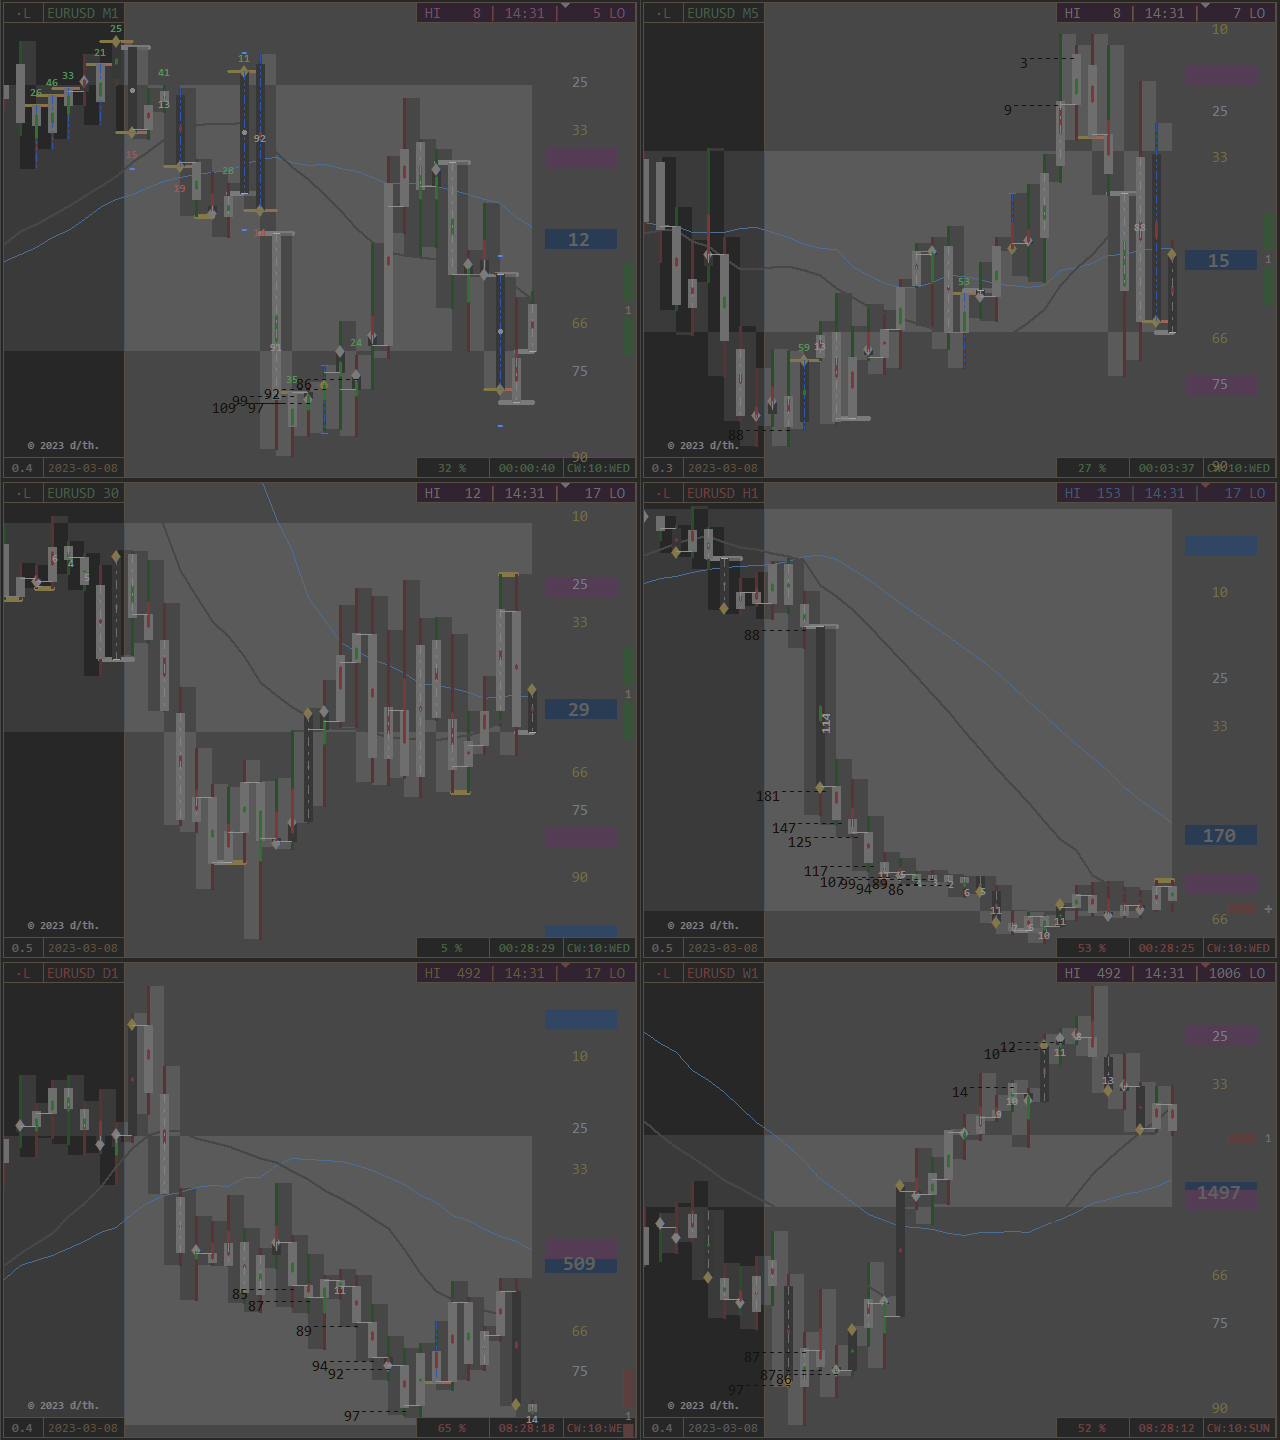
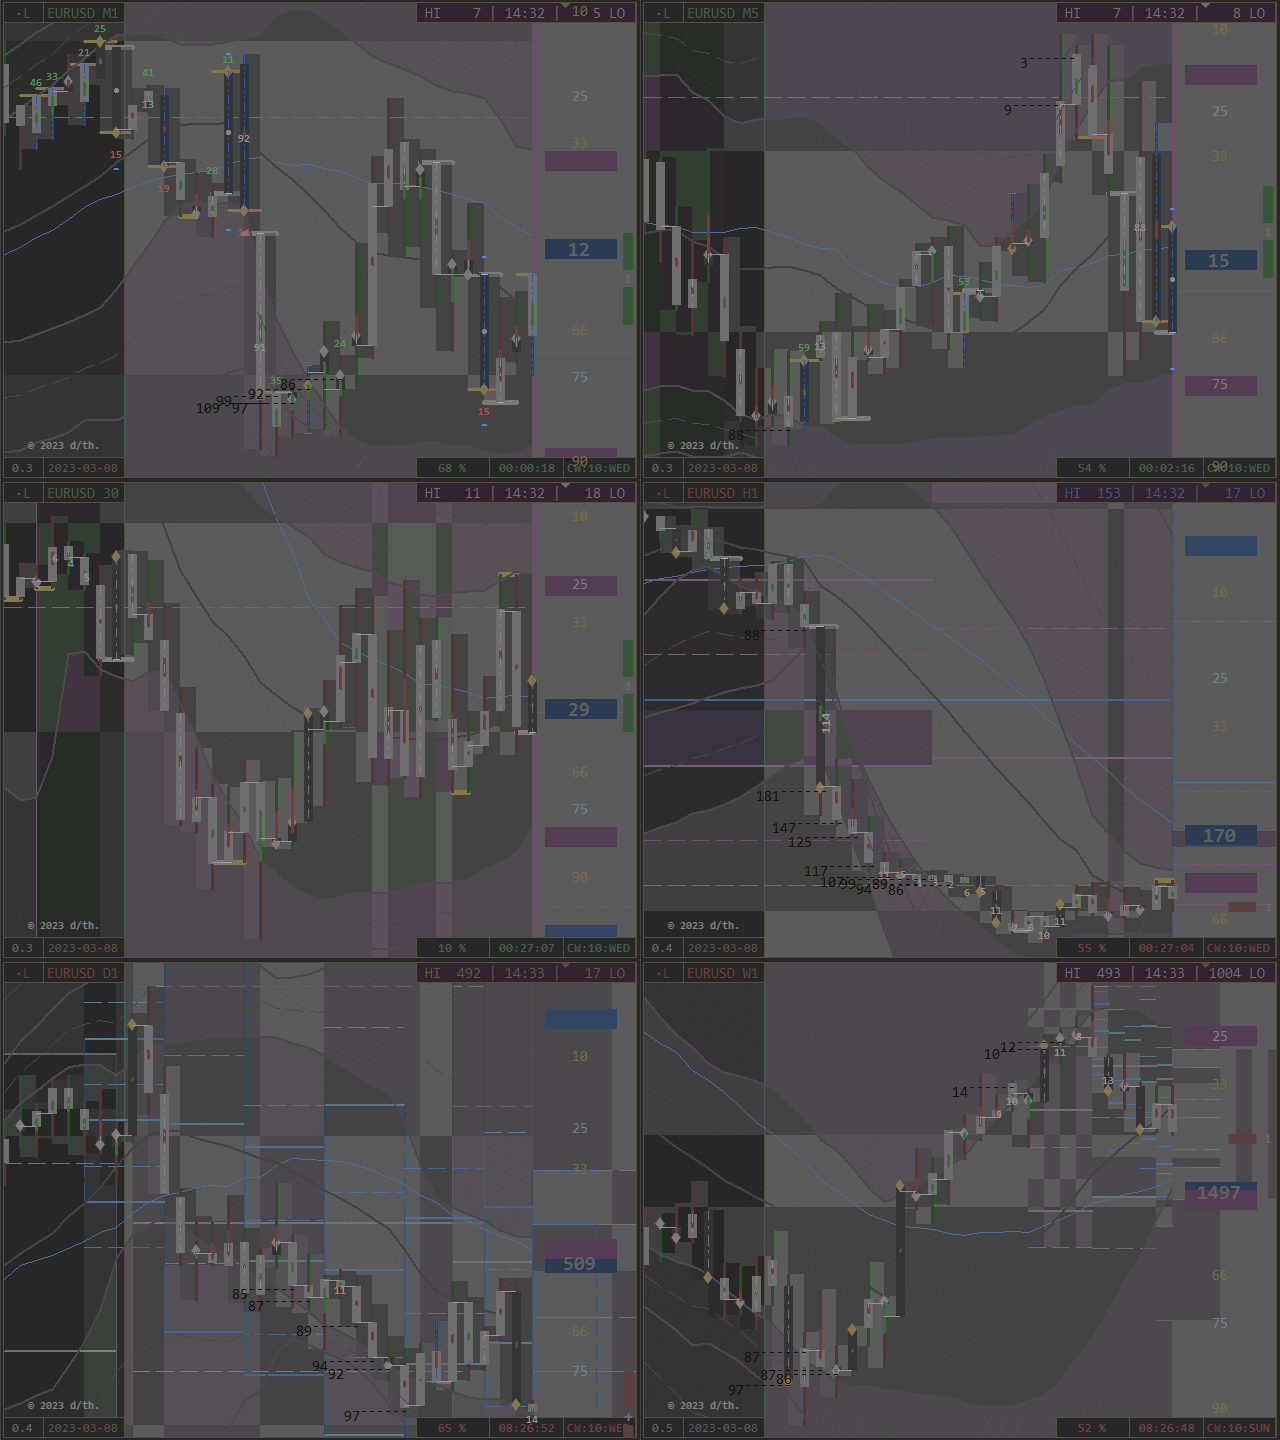
Special Events are displayed:

  • Close/ Open at High/ Low/ Center (colored Notes)
  • Break of weekly Channelbands (as Range Percentage)
  • Move 0 - 100 % of Range: Open to Close = High to Low (blue dotted Trend)
  • Move Proportions (white Values)
  • Offset of Move - Center against Range - Center (central Colortrend)
  • Parity of actual OHLC and previous OHLC (white Trend on Period and Offset Arrows on Scale)
  • Parity of up and down - Wick (blue Stars)
  • limiting Tick Values (Fraction Hits, green/ red)


Pivot Period Ports

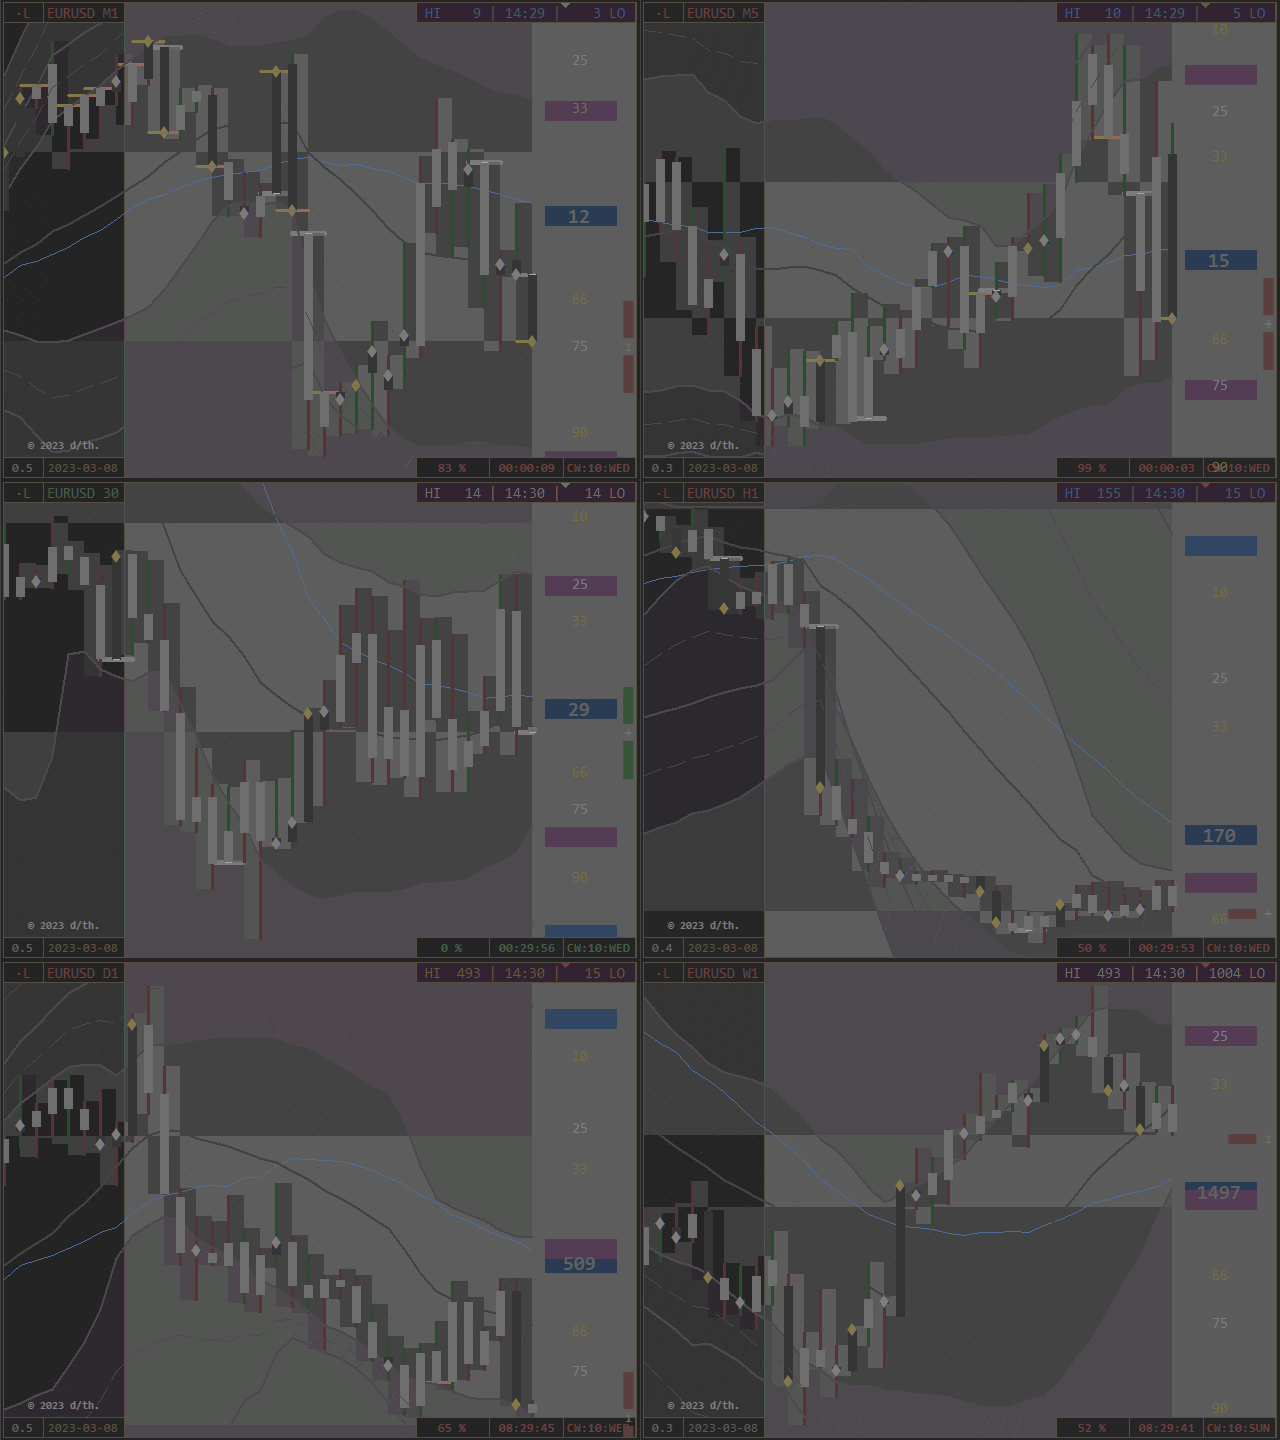
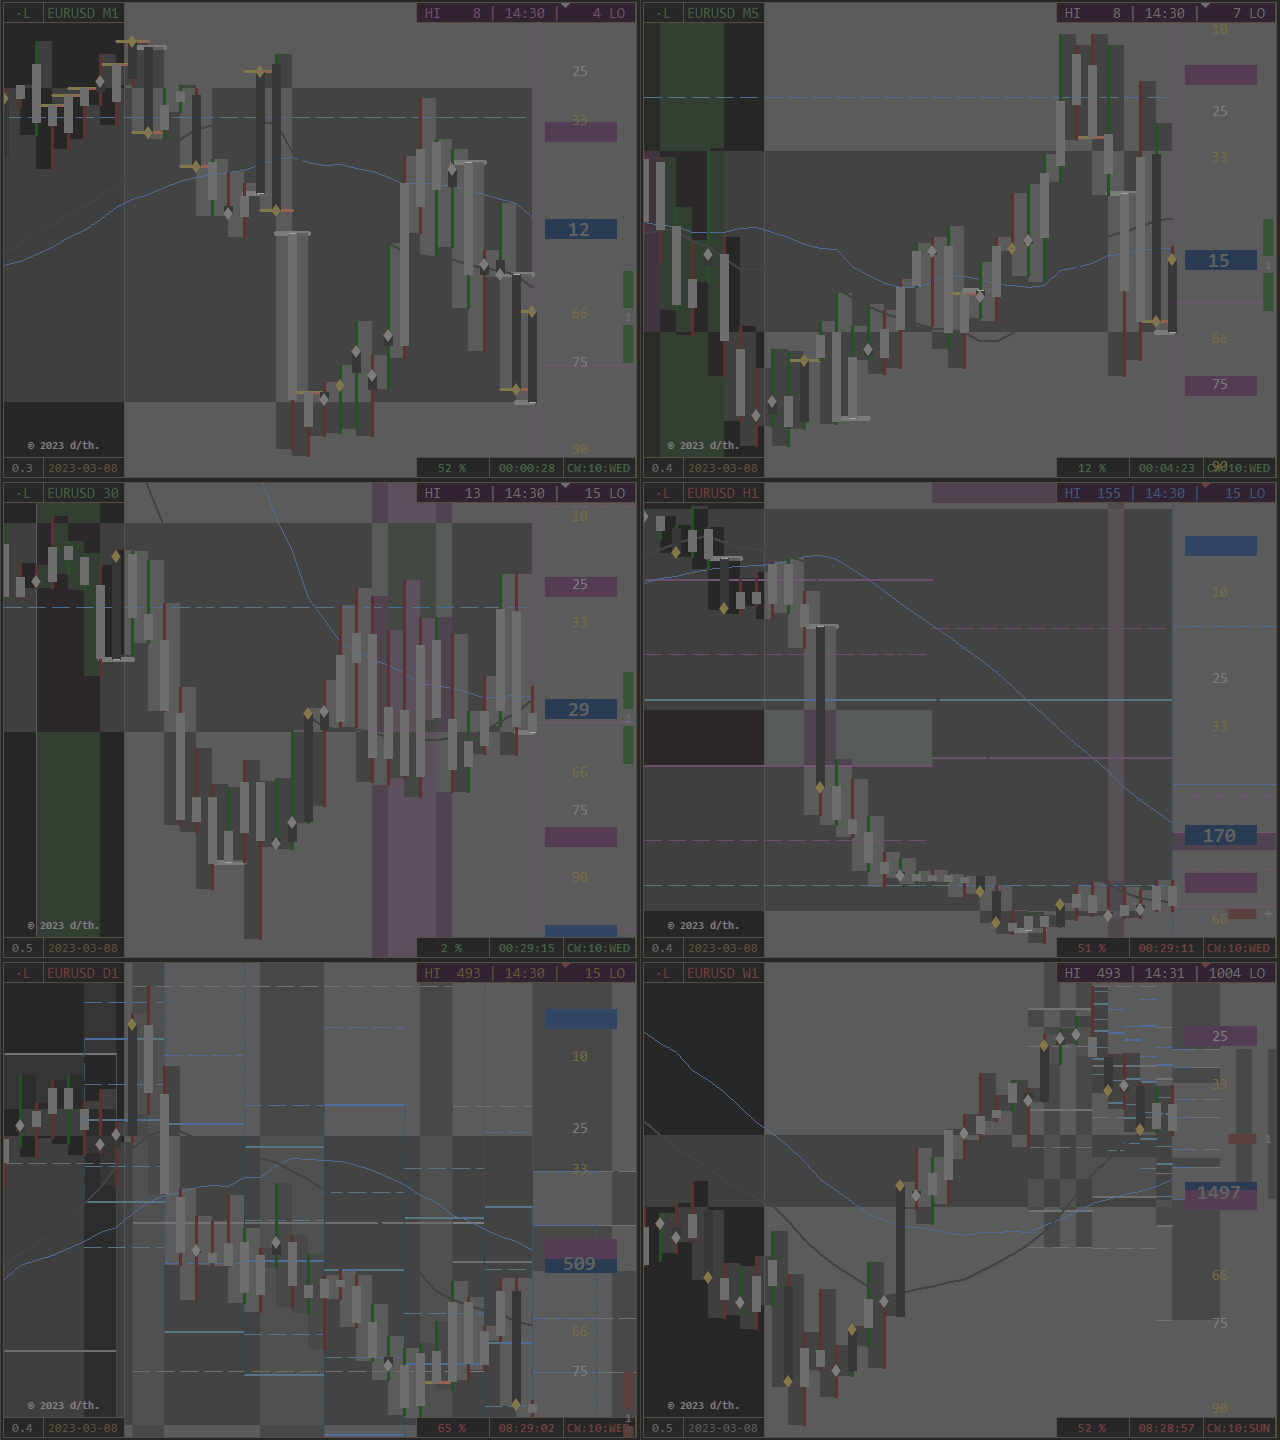
D1/ W1/ MN - Pivots create besides their Portlevels a colored Background, indicating cyclic and leveling Phases.


Layers:

  • Projectors, Ranges and Scales (set PointZeros in Relation to their own and to the actual Channelrange)
  • Mirroring of Movements as Bars and Trendlines
  • Coloring of Bands/ Periods
  • Periods on/ off
  • geometrical Chartstructure with Universal Mask


Additional Benefits:

  • a positioning Autofocus
  • a Logbook as directional Protocol
  • a systemic Clock informs about periodic Phases (Pivot and Realtime)
  • a Screenshot Function (Button on Chart and as automatic Interval)
  • a detailed Definition of Objects and Functions by the Descriptive Mode (as Tool Tips)
  • an adjustable Price Column and automatic Chartfitting


Contemplate its Concentrate

The Signal Density is related to Markets actual Phase, chosen Timeframe/ Security and Components.

PointZero generates as resulting Composition a defined Setting of Support and Resistance:

No Matter which Hemisphere: [ Open = Support | Resistance = Close ]


Both look like the Other.

The MindMask resolves the active Status.


A Picture is worth a thousand Words.

Indicative : Colorized : Universal


Please find all necessary Informations to this Product in its Compendium.

Below as Orientation the Extract of the individual Indicator-Adjustments.


Indicator PointZero

Think global - Act local


[VALUE] =

  • Boolean: Button Position on Chart
  • Cn: Corner n0 to 3 (left upper to right lower)
  • Variabledefault Value


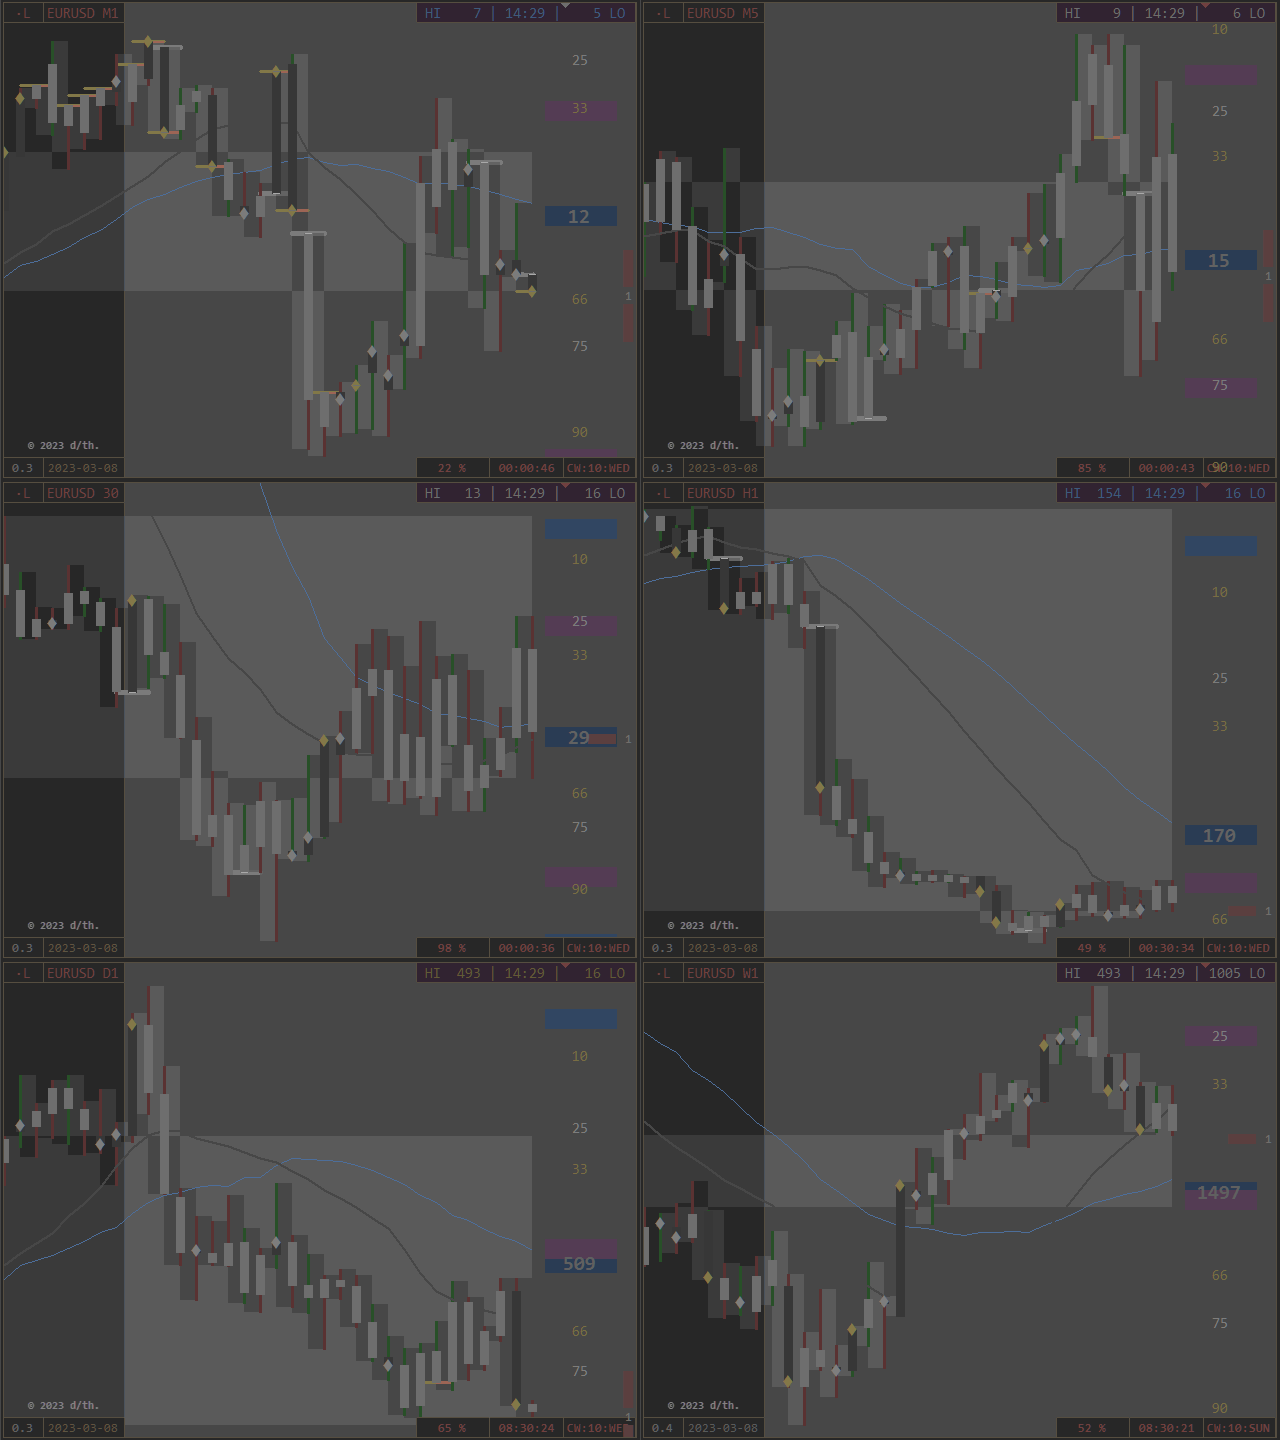
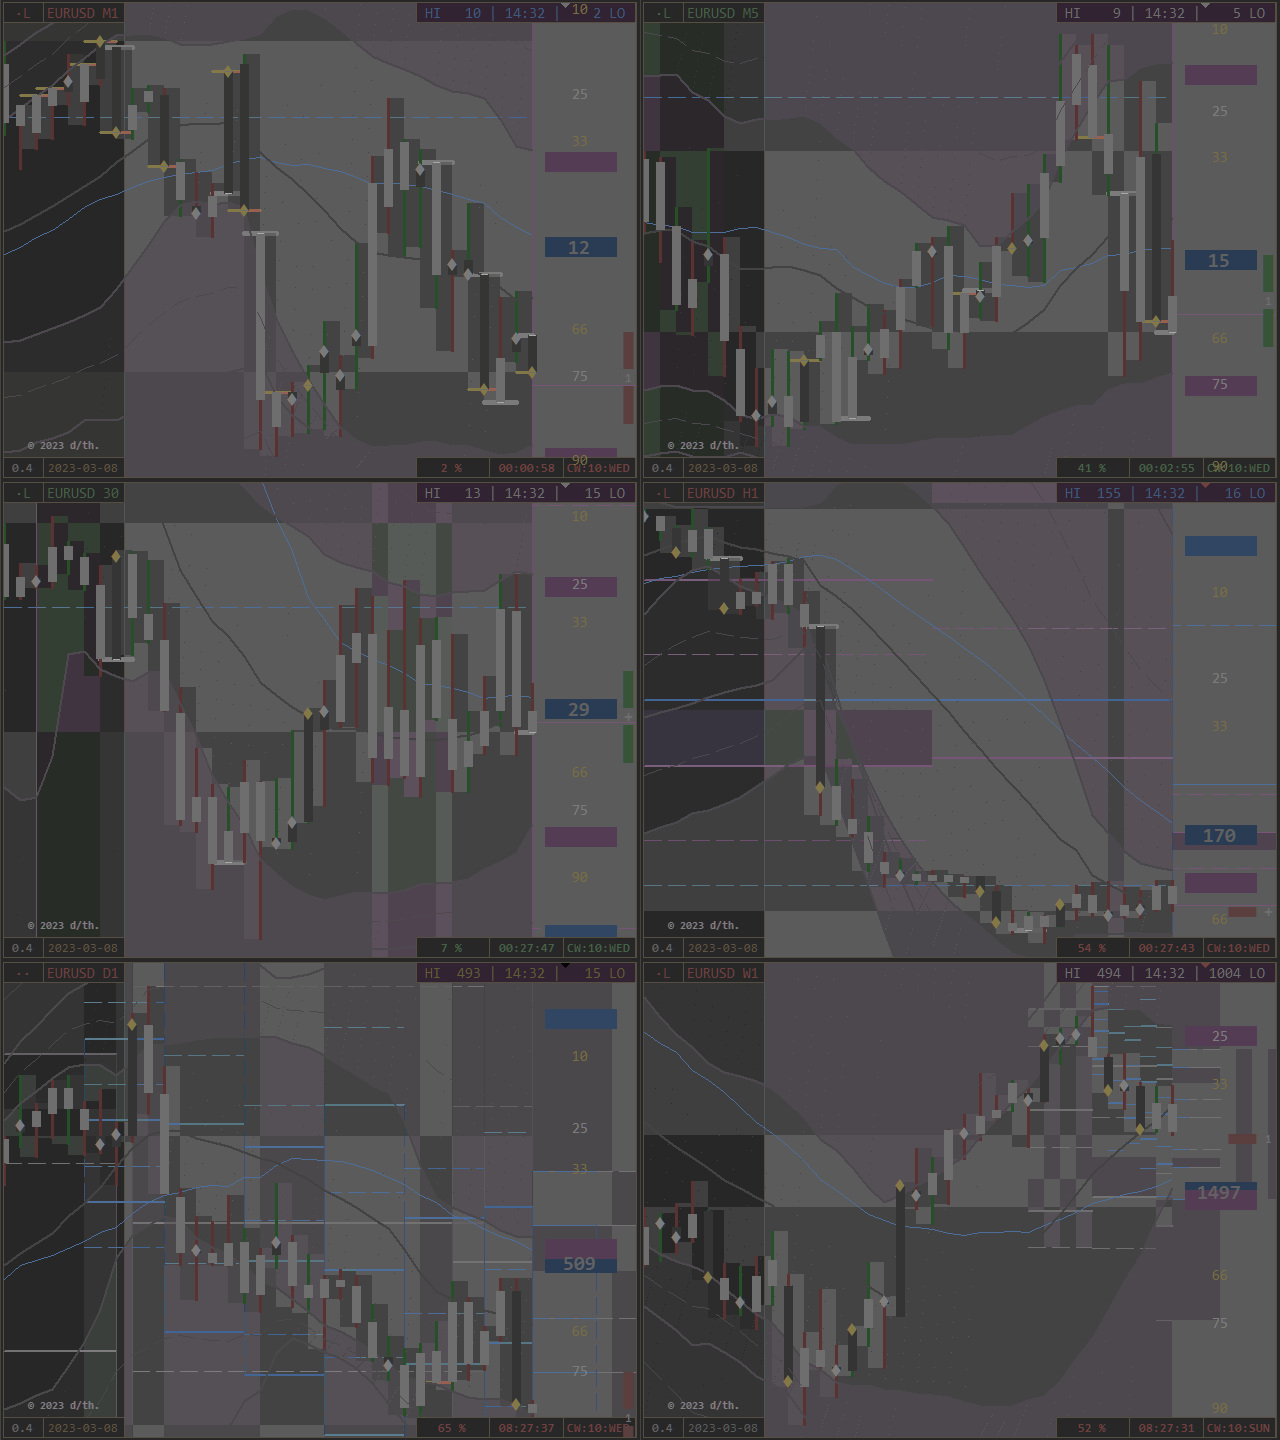
The default View of the Chart consists of following Components and is read like follows:

Move: Trace dark-gray/ Trend bright-gray

works as moving Range and ranging Move.

central MA: daily gray, weekly blue

Range Color by Open: Offset to prior Close/ Open/ Center (conditional)*

Note*: no separate Center-Color, the Open is passed by/of both Directions.

Close Color by Move: Offset to prior Open (= actual)

  • directional on: Null = white/ Full = orange
  • navigational off: up = green/ down = red
  • PointZeros off: noted by a white Haircross,

Toggle Close Signal via Countdown-Button.

Every Period works by its own Range-Shadow with the variable Chart-Coloring.

Identify their Phase by Coloring the Ranges with Button in Corner 3 most right (CW:WD)

Visual of centered Range-Creation and -Filling:
The Chart generates a (mostly central) gray Zone as Spread between

the highest Low and the lowest High of the visible Chart-Periods.


[5.1] Bools (on/ off) 

Code = Logic = Notation of Ordination


[5.1A] Fundament

Body of Chart


The first Options are the framing calculatoric Fundament of any Indicator Processing.

The visual Conjunction of both Mask-Complements delivers accidentially extra Room

for additional Buttons in the Sub-Chart, to have direct Access to these three Core-Options.

Bands and Pivots define the periodic Arrangement,

on which the Pen notes its designing Movements.

The Colors of Channel and Pivots cooperate = they are softened or amplified

and process accordingly to the Color Theory an indicating Background Tone.

The overlaying Period Event Notation is called by variable Conditions and

visualizes the Tracing/ Trending of Bull and Bear in their Habitates/ Hemispheres.


Time Price Channel [SUB]

To identify its Construction fully, colorize its dimmed Trendlines by Countdown-Button [C3]

(or preadjust via Colored Bands in Options).

  • hemispheric = 2 x 50% Coloring Ranges, depicted as colored Shells
  • gray D1, blue W1 Center = 0
  • Shells divided by Center-Trend
  • asymmetric Appearance due to separate Calculations 
  • of High and Low - Bands and central Moving Averages
    • Definition of Moving Average
    • variable Price Line 
    • Price of Time = external Argument
    • Definition of Channel-Band
    • constant Time Line 
    • (ime of Price = internal Argument

3-lettered Abbrevations on Price-Column:

  • Timeframe: MN = M, W1 = W, D1 = D
  • + Position HILO
  • e.g. WLO = Low of W1 - Channel (blue)


Period Event Notation [SUB]

special Contemplation of conditionally called absolute and/or relative Events:

  • Gator: 0-100 = Zero + Full Move
    • blue dashdot Centertrend on Period
    • notes new Phases (Caution)
  • Range/Move - High/Low (RH/ RL / MH / ML)
    • white move-connecting Trendline on Period
    • notes Stator/ Rotor - Function by Open Position of Period
  • Offset Move-Center against Range-Center 
    • colored Centertrend: green = North, red = South (directional)
    • notes potential/ tendencial Phase Shifts
  • periodic Centers in superordinated Range
    • white Value on Period if Close = 50% and < 15% or > 85% in D1-Range
    • notes near to Edge - Horizons in D1-Channel
  • Values beside Periods (connected with Dashes to Close)
    • if Close beyond W1 - Bands
    • note relative Barriers for overshooting Level-Phases
  • Tick Fraction Hits, as green and red Values
    • calculatoric Base is the Relation of Period Expansion and Volume
    • note expansional Edges of Time/ Price/ Tick
  • bright blue Double Points (Stars)
    • equivalent balanced/ central Position of Move in its Range
    • note Periods, which have an equal Size of their "Wicks"


Pivot Period Ports [SUB]

Enjoy freestyle Combinatory for 3 main + 1 sub Pivot ((MN/ W1/ D1) + H4).

universal Standard:

Pivots are processed Period-Gates and describe a superordinated Sequence of Market.
Equipped with cyclic and leveling Zones (colored Background), which note

  • by Time the first, central and last 10% of the Cycle Range 
  • (Visibility timeframe-dependent, adjust accordingly if necessary)
  • by Price the 66-75% of North and South Level-Range 
  • (Visibility chartscale-dependent, use implemented Autofocus if needed)
3-lettered Abbrevations on Price-Column:
  • Timeframe: MN = M, W1 = W, D1 = D, (H4 = H)
  • + Direction (N, S)
  • + Level (1, 2, 3)
  • or Pivot (PP)
  • e.g. MN1 = Monthly Pivot (white) Level 1 in Northern Hemisphere
Due to the inequal Hours of a Real-Time Week related to respective Weekdays

(last two Hours of Friday are processed on Sunday)

  • additional and isolated Sunday-Pivot.


Functions

Being develops from Within.

Equal Interest is generic.


The next five Options are Instruments for an extended Chart-Appearance and flexible Functionality:

[PRICE] Auto Focus:

Visual Flexibility, automatic

  • toggle by Click on the Price-Column (most right)
  • calculates the Chart-Dimensions related to the actual Move-Development
    • creates Room on active Hemisphere
    • more Range if Trend/ more Move if Trace
    • Sensitivity indicates upcoming Activity (Work on Tipping-Points)
  • situative fluid Chart Impression (Scalation of developing Range = relative)


[SCALE] 2 x Period (Range + Move):

Visual Flexibility, manual

Isolate Range and Move by Click-through:

  • toggle by Click on the Scale-Column (2nd right)
  • first Click = minus Move, shows blank Period-Range
  • second Click = toggles Range and Move, shows blank Period-Moves
  • third Click = all back

Not intended for Live-Use and, to avoid Mis-Clicks not accessible of the Chart, but via Options-Menu:
switch Periods completely off with both Options false => complete free view.

All Layers stay functional.


[PROJECTOR - TOPProtocol Role:

Data Divisioning, Sentence

The Protocol of periodical Events can be set to Autostart for sufficient wide charts.

Chart-Auto-Scroll has to be active.

According to the Chart-Concept it is divided in componental Columns of TOHLCV,
inclusive full Legend via Tooltip.

From left to right:

  • Period Time/special Occurrences
  • positioning Range Open Side
  • central periodic Function (two Roles)
  • navigating Move Close Side
  • Period Volume/special Occurrences
  • switch on/ off (completely) on Chart via Projector - Button
  • leave with staying Panel as Placeholder by direct Click on the List
The Placeholder-Panel is generally accessible by direct Click on it (most left Column).
It is in flat Markets potentially supportive for the Resolution, because MT-Scale-Calculations

are situatively adjusted by Reduction of Periods (optional in Conjunction with Autofocus).


[REFLECTOR - BOTUniversal Mask:

Data Divisioning, Sequence

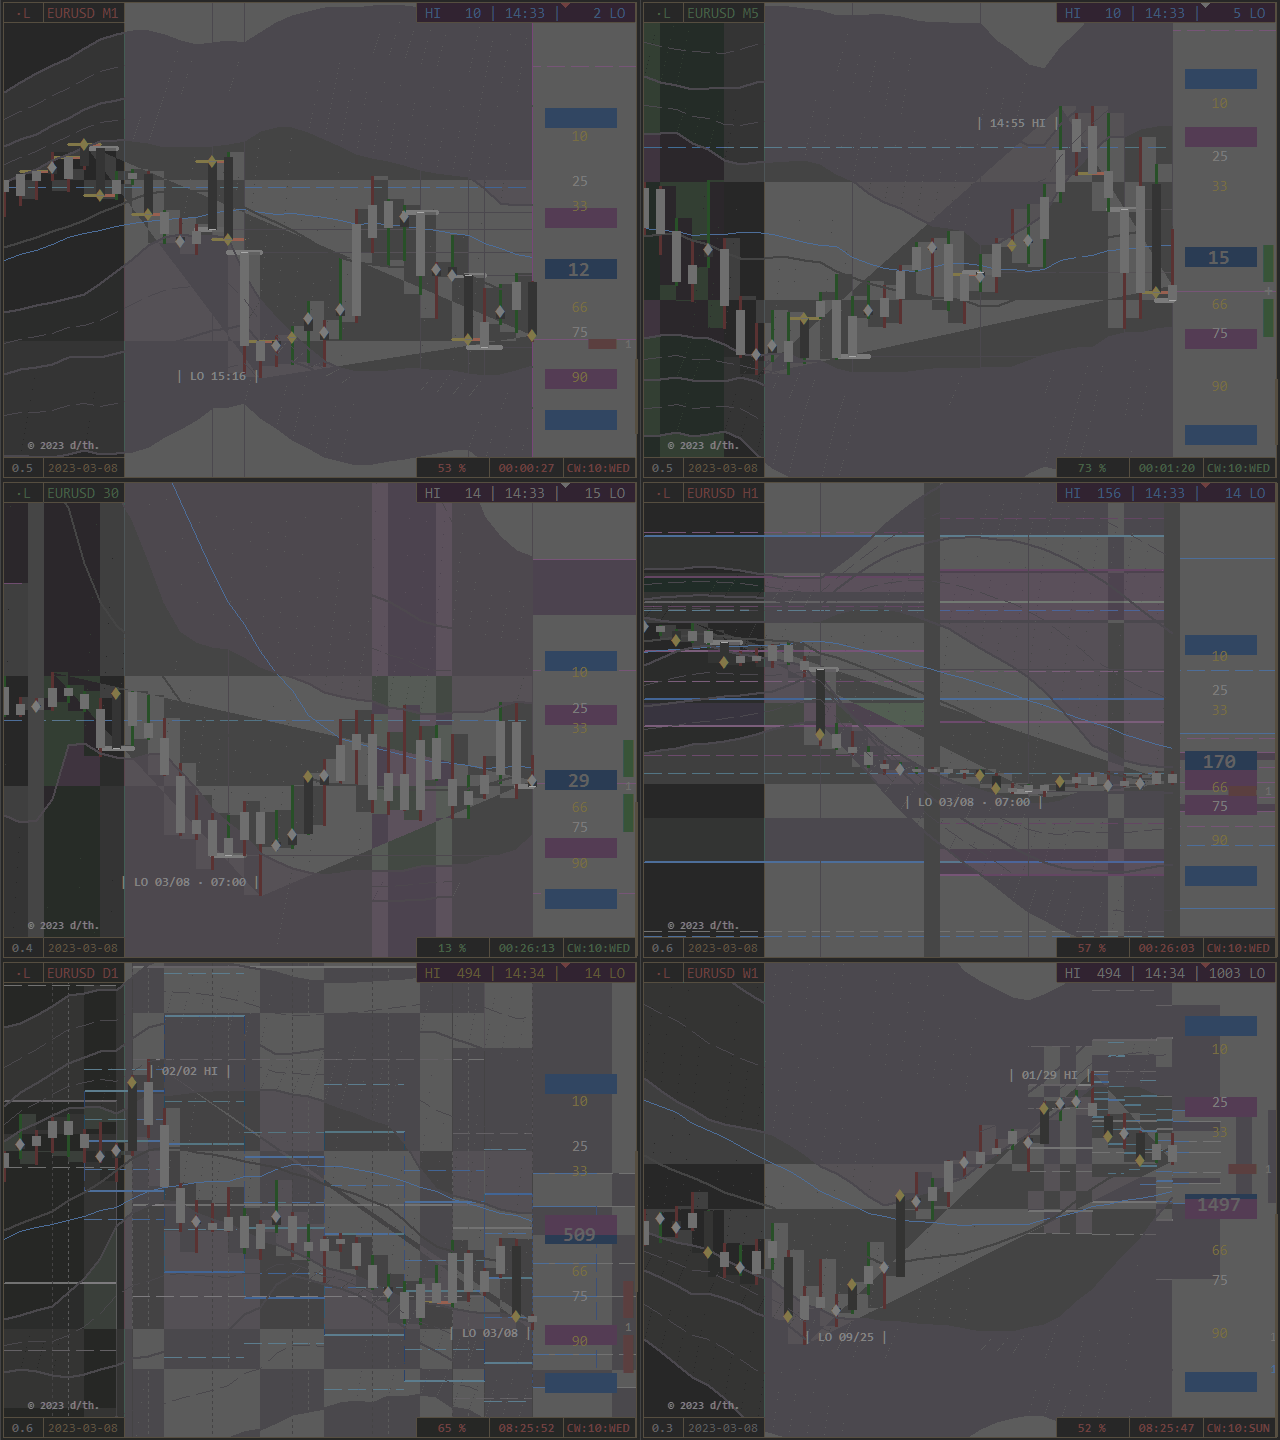
  • Open/ Close at High/ Low/ Center (Notes/ Dashes/ Crosshairs)
  • Open/ Close - Grid, PointZero Support-Resistance Graduation
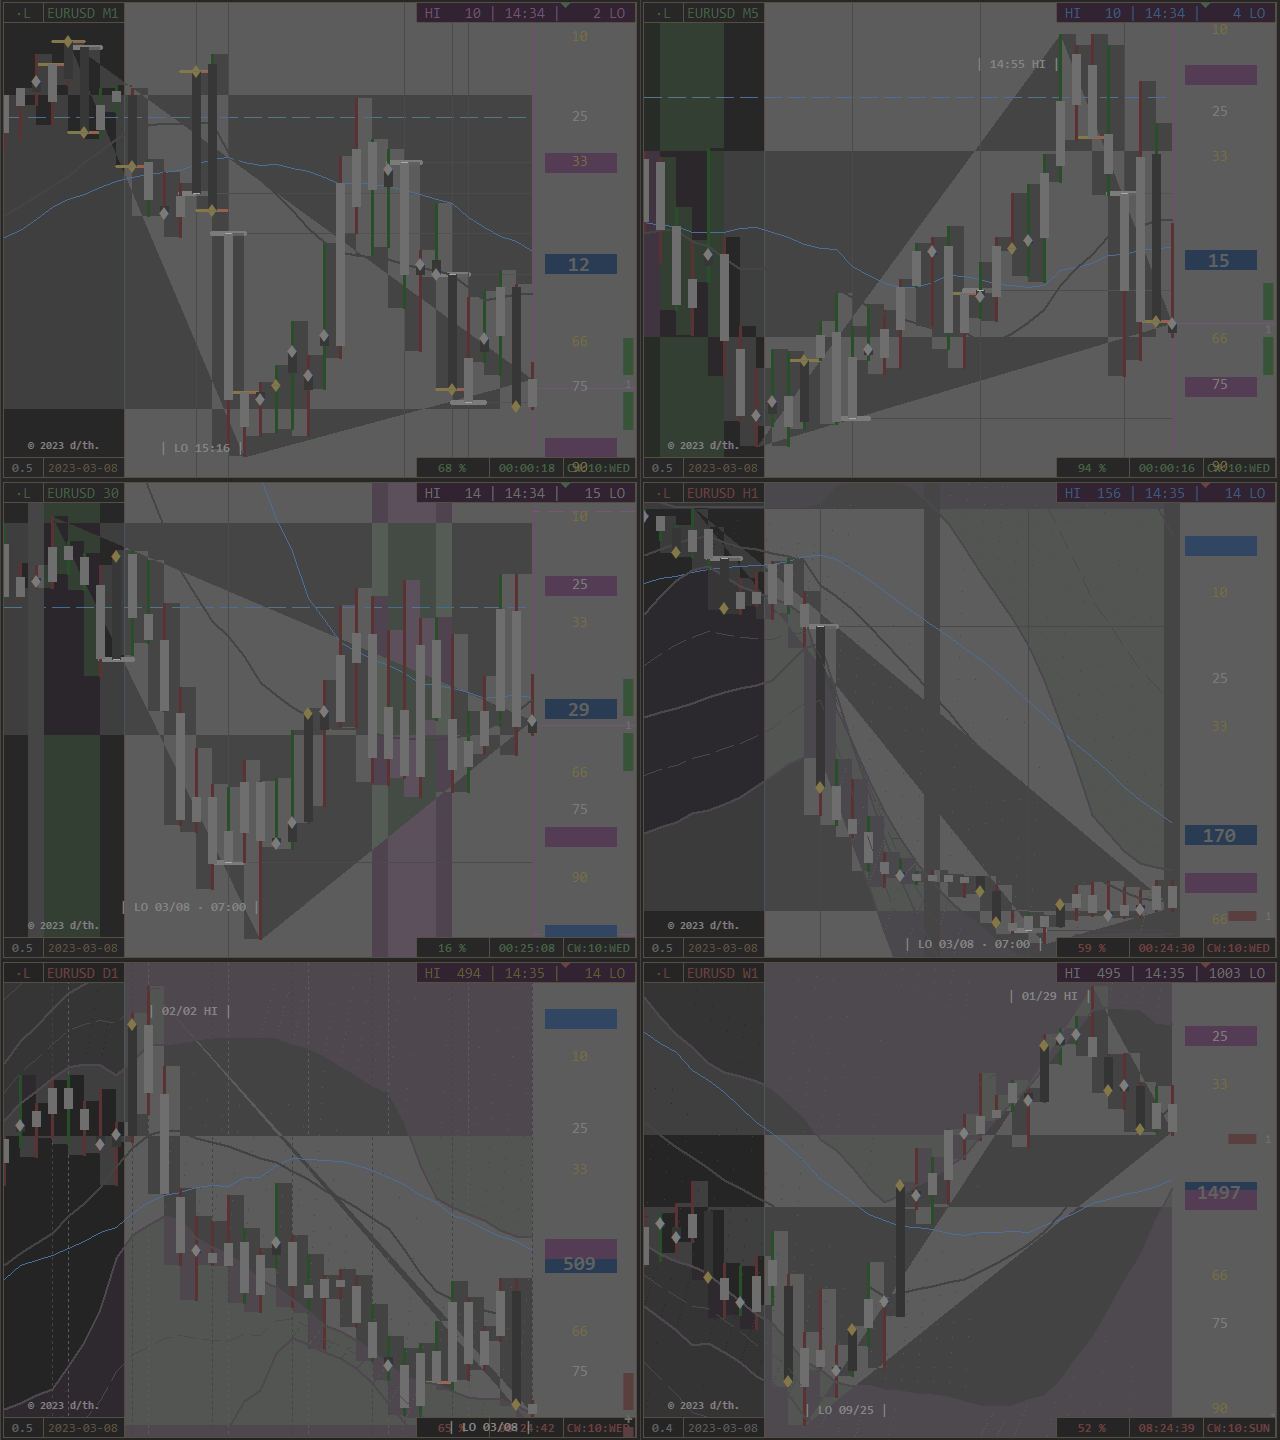
  • High/ Low/ Bid - Cone of Light (Chart Phase Scope)
  • High/ Low - Chart-Time of visible Periods (white, on Chart: timeframe-sensitive)
  • High/ Low - Chart-Price of visible Periods (white, on Price-Column: CHI = Chart High, CLO = Chart Low)

Indication of weekly Realtime-Transition Wednesday and Thursday

    • Odin = Ministrant/ Mantle/ collects = Close of Phase
    • Thor = Kloeckner/ Hammer/ strikes = Open of Phase

appears on Timeframes > M5 as underlying Histogram-Ray (chart-traversal)

  • if Zero = Close at Open/ High/ Low/ Center: white dash, notes Edges and Centers of Phases


Following Layers are Product of a special Contemplation

of the inner and outer Relations of Open and Close.

Move-Info

DisplayPosition + Direction + Function + Phase

[TOP] Echo Bars:

  • mirrored Bars, directional colored according to their respective Period-Direction,
  • adds an inverted Visual of Movements and forms functional Helix.

[BOT] Echo Trend:

  • mirrored Open- and Close-Trendlines, white = Open and orange = Close,
  • notes separately the leading Component of a Period as Heartbeat-Trend.


Layers

projective Reflection = reflective Projection


The Card Deck:

2 Buttons Corner 0TL

most top-left:
Order-Tool
  • first Letter = Pivot, second Letter = RealTime
  • DisplayC = Cycle/ L = Level/ Dot if not

Symbol - Button:

Clock

  • Market is clocked realtime to the real World by own Interest via cyclic and leveling Events.
  • Button Top right Corner 1 (Screenshot-Button) shows VOL (Volume/ Volatility)
  • Phases MN = M/ W1 = W/ D1 = D
The actual Time-Phase correlates with actual valid Price- and Volume-Phases 
and defines the timely Range of the pricely Movement. 
Price confirms this defining Call as designed Reflection.
Equal Colors cooperate through all Dimensions.


1 Button Corner 1TR

  • Clock Display
  • Screenshot, saved as GIF in \\DataFolder\MQL\Files\


2 Buttons Corner 2BL

Spread-Button (first, left) extends Button Row:

Activate four additional informational Buttons beside Protocol/ Interactive Mask,

which give access to the separate Chart Projectors. 

Note:

The following Layers are Product of the Projection of PointZeros to the actual processed Range and Move.

According to the Separation in Cycles and Levels, the direct

  • Projections as Light Cones are separately accessible.

Ranges and Scales are functional combined, and both are

  • by time: white/ blue and
  • by price: green/ red colored.

All have their conditional Appearance according to

  • Timeframe/ Security and Presence of Conditions 
in common.

Thus, Event-Density and -Impact

  • according to relative Distribution and Correlation of present Potentials!

Because of this, they are directly accessible by Chart-Button, or via Options automatically activated.

Choose of limitless Adjustability for Templates!

Due to their steady Interaction with the present Period they develop

and work actively (if enabled), until the PointZero leaves the Chart.


    From left to right:
    Time-Price-Button:
      DisplayServer-Time + Bid
      FunctionPointZero - Level Scaling
      • TOP Level Ranges
      • absolute and relative Plot of High/ Low - Ranges of respective PointZeros, 
        • Color navigational/ positional
      • BOT Phase Scales
      • absolute Division of respective PointZero - Range, 
        • overlying Variable notes TOHLCV - Position of next directive Call


      TPP / PPT - Button:

        Display: Productivity

        VPP = Volume per Period:
        Protocol List/ Center on TimeBand
        absolute (= Frequency)
        Impulse / Period
        Sensitivity 15%

          TPP = Ticks per Pip:

          • relative (= Alteration)
          • Impulse / Pip
          • Sensitivity 33%

            PPT = Pips per Tick:

            • total (= Oscillation)
            • Pip / Impulse
            • Sensitivity 50%

              Please further Informations to external Productivity in Section [7.0].


              FunctionPointZero - Projector (Beams)

              • on Top = Cycle
              • on Bottom = Level


                Both Projectors are setting their own Range Position in Relation to the actual Range Position,

                depending on their individual cyclic/ leveling Function.

                They work according to their Function and related to the individual Chart-Situation 
                as 
                ranging Barriers (Resistance) or 
                moving Tractors (Support).
                  Their Update-Frequency is by Tick, that means: they adjust in Cooperation with the 
                  actual Development, as long as their Period is on the Chart visible (if enabled).

                  Date-Button (second, right)
                    • Toggles the Period-Scale and 
                    • navigating Arrows RH/ MH/ ML/ RL, noting their Offset to their prior Position.
                    • Periods: Support white - Resistance orange


                      3 Buttons Corner 3 = BR

                      Colorize Channel Bands and Period Ranges to identify their Classification/ Function:

                      • Step = violet = D1 
                      • Lift = blue = W1
                      • Null = white = MN
                      • Full = orange = H4

                      left: [Period-Percentage] = colored Periods

                      note the classified State of Period-Moves

                      right: [CalendarWeek:WeekDay] = colored Channel-Bands
                      note the classified State of Period-Ranges = Channel-Shells/ Levels
                      center: [Countdown] = Close Signal

                      initially not shown, here on/off


                      Adjustments of general Nature:

                      • The Descriptive Mode is useful for Orientation or Confirmation (of not finally settled Experience).
                      • Extend the Pivot by H4 for smaller Timeframe Analysis.
                      • The MT4-Scales are a "fundamental Adjustment". I cannot resolve them..


                      Integer/ Double

                      constant variable = variable constant

                      The Icing:

                      • Protocol Role0 = Func (Function) / 1 = Bube (BullBear)
                      • Offset Price: position Price by whitchever Intent
                      • Shorten Digits: 6 Digits can be shorten to the preferred Length

                      • Screenshot 
                        • Interval: 0 = off
                        • Integer above 0 = Interval in Minutes
                        • adjust in Height and Width
                        • saved as GIF in \\DataFolder\MQL\Files\


                      Please find all necessary Informations to this Product in its Compendium in its respective RadioPhase - Blog.


                      logiclaboratory studio
                      © 2018-2023 /thiejden.


                      İncelemeler 2
                      Daniel
                      878
                      Daniel 2023.07.26 17:01 
                       

                      Ich schaue mir beide Indis von dir mal an, Optik und Ausführung perfekt, mal schauen wie ichdamit zurecht komme. Erstmal vielen dank für die Indis und die Arbeit.

                      Jamie Daniel Thompson
                      263
                      Jamie Daniel Thompson 2023.06.22 14:43 
                       

                      Extremely useful and incredible tool! I don't understand how this doesn't have 5 star reviews yet! It has totally changed the accuracy of my entries! Thanks to the author!

                      Önerilen ürünler
                      Wise Men Indicator demo
                      Bohdan Kasyanenko
                      3.67 (3)
                      The indicator displays signals according to the strategy of Bill Williams on the chart. Demo version of the indicator has the same features as the paid, except that it can work only on a demo account . Signal "First Wise Man" is formed when there is a divergent bar with angulation.  Bullish divergent bar - with lower minimum and closing price in the upper half. Bearish divergent bar - higher maximum and the closing price at the bottom half. Angulation is formed when all three lines of Alligat
                      FREE
                      Introducing the Consecutive Green/Red Candle Alert Indicator for MT4 - Your Trend Spotting Companion! Are you ready to take your trading to the next level? We present the Consecutive Green/Red Candle Alert Indicator, a powerful tool designed to help you spot trends and potential reversals with ease. Whether you're a new trader looking for clarity in the market or an experienced pro seeking additional confirmation, this indicator is your trusted companion. Key Features of the Consecutive Green/Re
                      FREE
                      SensorMap
                      Juergen Thielen
                      5 (1)
                      Concept Market arranges in Time upcoming Phases according to the present Results of its Interest. Directing Modulations are an Interaction of immanent Periods, which show in Reference to Time cyclic Activity and to Price leveling Activity. SensorMap is a reflecting Volume Mask of this Concept of Time and Price and apportioning developed Price Movements in an equalized 100 % - Range: how far moved ? indicating their Status by marking special Events: when which Action ? setting the Situation in
                      FREE
                      Free automatic Fibonacci is an indicator that automatically plots a Fibonacci retracement based on the number of bars you select on the BarsToScan setting in the indicator. The Fibonacci is automatically updated in real time as new highest and lowest values appears amongst the selected bars. You can select which level values to be displayed in the indicator settings. You can also select the color of the levels thus enabling the trader to be able to attach the indicator several times with differe
                      FREE
                      TrendPlus
                      Sivakumar Subbaiya
                      4.21 (14)
                      Trend Plus   Trendplus  Indicator   Time Frame: Suitable for any time frame.  Purpose: Trend Prediction. Blue and red candle indicate the buy and sell call respectively. Buy: When the blue candle is formed buy call is initiated. close the buy trades when the next red candle will formed.   Sell: When the Red candle is formed Sell call is initiated. close the Sell trades when the next blue candle will formed.   Happy trade!!
                      FREE
                      SuperMac Free
                      Agus Wahyu Pratomo
                      4 (1)
                      FREE VERSION ONLY USE LOT SIZE 0.01 TO UNLOCK IT GO HERE  https://www.mql5.com/en/market/product/61498 SuperMac EA is a trading robot  for the trading on forex and trades  Scalping  Strategy and Tren Follower. This is a Trend Following system that trades in all session.   It use Multi Complex Algorithm to determine tren behaviour.  EA optimized on EURUSD, GBPUSD and NZDUSD (Use together) but can be use on other pair  Use PAIR can use 3 pairs (recommended to maximize profit) at the same tim
                      FREE
                      The   OHLC indicator   shows the current and historical values of High, Low, Open, Close and Mid for a specific time period. It can plot the current values or the values from the previous session. The indicator's range can be calculated from a daily, weekly, monthly, or user-specified session. Levels High  of the current or previous session. Low  of the current or previous session. Open  of current or previous session. Close  of the current or previous session. Midpoint  of the current or pre
                      FREE
                      This indicator is a perfect tool able to compare which brokers have the lower latency. It shows us immediately which brokers are slower or faster. When you see the dot icon on the line, it means this broker is the faster one and the red line (Broker_A) is the slower one. See the example on the screenshot. How It Works? This indicator shares the prices information to and from the "shared" common data folder. It compares all the prices. The price is based on average by (Ask + Bid) / 2. There are
                      FREE
                      UPD1 Rsi Dots Dashboard
                      Vitaliy Kuznetsov
                      5 (1)
                      Gösterge, grafikteki terminal RSI osilatörüne dayalı sinyalleri gösterir. Tekrarlanan sinyalleri filtrelemek mümkündür. Burada osilatör bir ters sinyal aramak için kullanılır. Salıncak stratejilerinde ve seviyelerden alım satımda bir giriş noktası olarak önerilir. Çok para birimli gösterge tablosu mevcuttur. Bununla birlikte, grafikler arasında kolayca geçiş yapabilirsiniz. Ürün tartışmalarında, panoyu yerleştirebileceğiniz bir algoritma önerebilirsiniz. Giriş parametreleri. Ana Ayarlar
                      FREE
                      PZ The Zone
                      PZ TRADING SLU
                      4.25 (4)
                      This indicator displays buy or sell signals according to Bill Williams' definition of the Trading Zone. [ Installation Guide | Update Guide | Troubleshooting | FAQ | All Products ] Easy to use and understand Avoid trading flat markets Deterministic indicator with clear rules The indicator is non-repainting It implements alerts of all kinds It has straightforward trading implications. A blue arrow is a buy signal A red arrow is a sell signal According to Bill Williams trading in the zone helps to
                      FREE
                      Follow The Line
                      Oliver Gideon Amofa Appiah
                      4 (13)
                      FOLLOW THE LINE GET THE FULL VERSION HERE: https://www.mql5.com/en/market/product/36024 This indicator obeys the popular maxim that: "THE TREND IS YOUR FRIEND" It paints a GREEN line for BUY and also paints a RED line for SELL.  It gives alarms and alerts of all kinds. IT DOES NOT REPAINT and can be used for all currency pairs and timeframes. Yes, as easy and simple as that. Even a newbie can use it to make great and reliable trades. NB: For best results, get my other premium indicators for more
                      FREE
                      SuperTrend V
                      Muhammad Hassaan
                      5 (1)
                      *This is TradingView indicator converted to mql4* The SuperTrend V indicator is a popular technical analysis tool used to identify trends and potential trend reversals in financial markets. It is based on the concept of the SuperTrend indicator but incorporates additional features and variations. The SuperTrend V indicator uses a combination of price action and volatility to determine the trend direction and generate trading signals. Here are the key components and features of the indicator:
                      FREE
                      FFx MACD
                      Eric Venturi-Bloxs
                      4.38 (8)
                      The purpose of this new version of the MT4 standard indicator provided in your platform is to display in a sub-window multiple timeframes of the same indicator. See the example shown in the picture below. But the display isn’t like a simple MTF indicator. This is the real display of the indicator on its timeframe. Here's the options available in the FFx indicator: Select the timeframes to be displayed (M1 to Monthly) Define the width (number of bars) for each timeframe box Alert pop up/sound/ema
                      FREE
                      Email Drawdown Alert
                      Roman Starostin
                      5 (15)
                      Free informative Indicator-helper. It'll be usefull for traders who trade many symbols or using grid systems (Averaging or Martingale). Indicator counts drawdown as percent and currency separate. It has a number of settings: Count deposite drawdown according equity value and send e-mail or notifications to user if DD more than set; Sending e-mail when max open orders reached; Shows price and remaining pips amount before MarginCall on current chart and Account generally; Display summary trade lot
                      FREE
                      Are you tired of drawing trendlines every time you're analyzing charts? Or perhaps you would like more consistency in your technical analysis. Then this is for you. This indicator will draw trend lines automatically when dropped on a chart. How it works Works similar to standard deviation channel found on mt4 and mt5. It has 2 parameters: 1. Starting Bar 2. Number of bars for calculation The   starting bar   is the bar which drawing of the trend lines will begin, while the   number of bars for c
                      FREE
                      OrderBlock TS Roman
                      Vladislav Vlastovskii
                      4 (7)
                      Индикатор строит блоки заказов (БЗ) по торговой системе (ТС) Романа. Поиск блоков осуществляется одновременно на двух таймфремах: текущем и старшем (определяемым в настройках). Для оптимизации и игнорирования устаревших блоков в настройках задается ограничение количества дней в пределах которых осуществляется поиск блоков. Блоки строятся по правилам ТС состоящем из трех шагов: какую свечу вынесли (что?); какой свечой вынесли (чем?); правило отрисовки (как?).
                      FREE
                      Download the free version   here. Divergence Divergence refers to when the price of a currency pair moves in one direction while the trend indicator is moving in the opposite direction. With divergence, there can be positive and negative signals. Divergences in Forex trading are quite common signals of technical analysis. These are basic early Forex signals indicating the trend reversal and filter false signals. Application of this indicator It is usually not easy to detect divergences by the t
                      FREE
                      Trend Yakalayıcı: Alarm İndikatörü ile Trend Yakalayıcı Stratejisi, piyasa trendlerini ve potansiyel giriş ve çıkış noktalarını belirlemede yardımcı olan çok yönlü bir teknik analiz aracıdır. Piyasa koşullarına uyum sağlayarak trend yönünün net görsel temsili için dinamik bir Trend Yakalayıcı Stratejisi sunar. Tüccarlar tercihlerine ve risk toleranslarına göre parametreleri özelleştirebilirler. Gösterge, trendleri tanımlamaya yardımcı olur, potansiyel ters dönüşleri sinyaller, trailing stop m
                      FREE
                      This scanner shows the trend values of the well known indicator SuperTrend for up to 30 instruments and 8 time frames. You can get alerts via MT4, Email and Push-Notification as soon as the direction of the trend changes. This is the FREE version of the indicator: SuperTrend Scanner The free version works only on EURUSD and GBPUSD! Important Information How you can maximize the potential of the scanner, please read here: www.mql5.com/en/blogs/post/718074 With the following FREE indicator you
                      FREE
                      Ppr PA
                      Yury Emeliyanov
                      4 (1)
                      "Ppr PA" is a unique technical indicator created to identify "PPR" patterns on the currency charts of the MT4 trading platform. These patterns can indicate possible reversals or continuation of the trend, providing traders with valuable signals to enter the market. Features: Automatic PPR Detection:   The indicator automatically identifies and marks PPR patterns with arrows on the chart. Visual Signals:   Green and red arrows indicate the optimal points for buying and selling, respectively. A
                      FREE
                      Trend arrow Indicator
                      NGUYEN NGHIEM DUY
                      3.23 (13)
                      Trend arrow Indicator is an arrow Indicator used as an assistant tool for your trading strategy. The indicator analyzes the standard deviation of bar close for a given period and generates a buy or sell signals if the deviation increases. It good to combo with Martingale EA to follow Trend and Sellect Buy Only/Sell Only for EA work Semi-Automatic. You can use this  Indicator with any EAs in my Products.
                      FREE
                      Extremum Reverse Bar
                      Yurij Izyumov
                      3.55 (11)
                      This indicator has been created for finding the probable reversal points of the symbol price. A small candlestick reversal pattern is used it its operation in conjunction with a filter of extremums. The indicator is not redrawn! If the extremum filter is disabled, the indicator shows all points that have a pattern. If the extremum filter is enabled, the condition works – if the history Previous bars 1 candles back contains higher candles and they are farther than the Previous bars 2 candle, such
                      FREE
                      Pivot Mean Oscillator (PMO) is a unbounded zero-centered oscillator that provides a quick and normalized measure of divergence between two spreads. Detailed description of the mathematical formulation along with some comments and experiments can be found in this article .  Trading aspects This version of PMO is tuned on spreads relative to Close and Open price signals against their cumulative moving average (CMA). Positive PMO(m,n) values means that last (normalized) m Close prices are higher
                      FREE
                      Signals and Alerts for Accelerator/Decelerator indicator based on these MQL5 posts: Accelerator Oscillator and Signals of the Indicator Accelerator Oscillator . Note : this tool is based on the code of Accelerator indicator developed by MetaQuotes Software Corp. Features The signals are triggered at   closing   of last bar/opening of a new bar; Any kind of alerts can be enabled: Dialog Box, Email message, SMS notifications for smartphones and tablets, and Sound alerts; Customizable arrows. By
                      FREE
                      Magic Macd Cross
                      Christophe Godart
                      3 (1)
                      This classic "old school" MAGIC MACD indicator gives you the cross of the parameters you set. Standart setting is (12,26,9) . The arrows give you a possible change of trend. Be careful and do not use this indicator as a single signal source. FREE version  Please feel free to check out our other REX indicator series. We do have other free indicators.     "OLD BUT GOLD"
                      FREE
                      Sm Ichimoku Scanner
                      Steeve Christian Martol
                      5 (6)
                      Multi Time Frame Indicator acts as a Scanner based on the Ichimoku Trading System. The outcome is displayed on a board. This helps you to make "at a glance" a mental picture of the System without having to open the chart. Up to 10 Currencies can be watched. Scanned elements And Legend "KUMO Futur" - Green : The Kumo Futur is Bullish. "KUMO Futur" - Red : The Kumo Futur is Bearish. "PRICE Cross KJ" - Green : The Price is Above the Kijun Sen.  "PRICE Cross KJ" - Red : The Price is Below the Kijun
                      FREE
                      This trial scanner works with the other "Smart Market Structure Opportunity Scanner", and is basically an extension of that scanner with added features to find more accurate entry opportunities for day trading or refined swing trading.  The most important added features are:  1) The ADRs ( Average Daily Range ) for the last 5 days would have color and  +/- sign that shows the direction of each days ADR     move.  2) I added RSI values for each of the trading timeframes ( 1min, 5min, 15min, 30min
                      FREE
                      A professional tool for trading - the divergence indicator between the RSI and the price, which allows you to receive a signal about a trend reversal in a timely manner or catch price pullback movements (depending on the settings). The indicator settings allow you to adjust the strength of the divergence due to the angle of the RSI peaks and the percentage change in price, which makes it possible to fine-tune the signal strength. The indicator code is optimized and is tested very quickly as par
                      FREE
                      ZigZag Fibo Retracement Indicator Optimize Your Trading Strategy! Are you seeking to optimize your trading strategy in the financial markets? Explore the unique features of the ZigZag Fibo Retracement Indicator, a powerful tool designed to help you identify potential support and resistance levels based on the combination of ZigZag patterns and Fibonacci ratios. Integration of ZigZag Patterns and Fibonacci: The ZigZag Fibo Retracement Indicator combines the effectiveness of ZigZag patterns, helpi
                      FREE
                      Bu ürünün alıcıları ayrıca şunları da satın alıyor
                      Gann Made Easy
                      Oleg Rodin
                      4.96 (47)
                      Gann Made Easy , bay teorisini kullanarak ticaretin en iyi ilkelerine dayanan, profesyonel ve kullanımı kolay bir Forex ticaret sistemidir. WD Gann. Gösterge, Zararı Durdur ve Kâr Al Seviyeleri dahil olmak üzere doğru SATIN AL ve SAT sinyalleri sağlar. PUSH bildirimlerini kullanarak hareket halindeyken bile işlem yapabilirsiniz. Lütfen satın aldıktan sonra benimle iletişime geçin! Alım satım ipuçlarımı ve harika bonus göstergelerini ücretsiz olarak sizinle paylaşacağım! Muhtemelen Gann ticaret y

                      Atomic Analyst
                      Issam Kassas
                      5 (2)
                      Öncelikle belirtmek gerekir ki bu Ticaret Göstergesi Yeniden Çizim Yapmaz, Gecikmez ve Gecikme Göstermez, bu da hem manuel hem de robot ticareti için ideal hale getirir. Atom Analisti, Piyasada Daha İyi Bir Avantaj Bulmak İçin Fiyatın Gücünü ve Momentumunu Kullanan PA Fiyat Hareketi Göstergesidir. Gürültüleri ve Yanlış Sinyalleri Kaldırmaya ve Ticaret Potansiyelini Artırmaya Yardımcı Olan Gelişmiş Filtrelerle Donatılmıştır. Birden fazla katmanlı karmaşık göstergeler kullanarak, Atom Analisti
                      TPSproTREND PrO
                      Roman Podpora
                      5 (15)
                      TPSpro TRENDPRO  - is a trend indicator that automatically analyzes the market and provides information about the trend and each of its changes, as well as giving signals for entering trades without redrawing! The indicator uses each candle, analyzing them separately. referring to different impulses - up or down impulse. Exact entry points into transactions for currencies, crypto, metals, stocks, indices!  -  Version MT5               DETAILED DESCRIPTION        /       TRADING SETUPS           
                      Gold Stuff
                      Vasiliy Strukov
                      4.89 (250)
                      Gold Stuff, özellikle altın için tasarlanmış bir trend göstergesidir ve herhangi bir finansal enstrümanda da kullanılabilir. Gösterge yeniden çizilmez ve gecikmez. Önerilen zaman dilimi H1. Bu göstergede tam otomatik Uzman Danışman EA Gold Stuff çalışır. Profilimde bulabilirsiniz. Ayarları ve kişisel bir bonusu almak için satın alma işleminden hemen sonra benimle iletişime geçin!   AYARLAR Ok Çiz - açık kapalı. grafik üzerinde oklar çizmek. Uyarılar - sesli uyarılar kapalı. E-posta bild
                      Öncelikle, bu Ticaret Aracının Non-Repainting, Non-Redrawing ve Non-Lagging Gösterge olduğunu vurgulamakta fayda var, bu da onu profesyonel ticaret için ideal hale getiriyor. Akıllı Fiyat Hareketi Kavramları Göstergesi, hem yeni hem de deneyimli tüccarlar için çok güçlü bir araçtır. İleri ticaret fikirlerini, Inner Circle Trader Analizi ve Smart Money Concepts Ticaret Stratejileri gibi 20'den fazla kullanışlı göstergeyi bir araya getirerek bir araya getirir. Bu gösterge, büyük kurumların tica
                      ŞU ANDA %26 INDIRIMLI Yeni Başlayanlar veya Uzman Tüccarlar için En İyi Çözüm! Bu Gösterge benzersiz, yüksek kaliteli ve uygun fiyatlı bir ticaret aracıdır çünkü bir dizi tescilli özellik ve yeni bir formül ekledik. Sadece BİR grafik ile 28 Forex çifti için Döviz Gücünü okuyabilirsiniz! Yeni bir trendin veya scalping fırsatının tam tetik noktasını belirleyebildiğiniz için ticaretinizin nasıl gelişeceğini hayal edin? Kullanım kılavuzu: buraya tıklayın Bu ilk olan, orijinal! Değersiz bir
                      Scalper Vault
                      Oleg Rodin
                      5 (27)
                      Scalper Vault , başarılı bir scalping için ihtiyacınız olan her şeyi size sağlayan profesyonel bir scalping sistemidir. Bu gösterge, forex ve ikili opsiyon tüccarları tarafından kullanılabilecek eksiksiz bir ticaret sistemidir. Önerilen zaman çerçevesi M5'tir. Sistem size trend yönünde doğru ok sinyalleri sağlar. Ayrıca size üst ve alt sinyaller ve Gann piyasa seviyeleri sağlar. Göstergeler, PUSH bildirimleri dahil her türlü uyarıyı sağlar. Göstergeyi satın aldıktan sonra lütfen benimle iletişim
                      Şu anda %20 İNDİRİMLİ! Herhangi bir Acemi veya Uzman Tüccar için En İyi Çözüm! Bu gösterge paneli yazılımı 28 döviz çifti üzerinde çalışıyor. Ana göstergelerimizden 2'sine (Gelişmiş Para Birimi Gücü 28 ve Gelişmiş Para Birimi Dürtüsü) dayanmaktadır. Tüm Forex piyasasına harika bir genel bakış sağlar. Gelişmiş Para Birimi Gücü değerlerini, para birimi hareket hızını ve tüm (9) zaman dilimlerinde 28 Forex çifti için sinyalleri gösterir. Trendleri ve / veya scalping fırsatlarını belirlemek içi
                      Scalper Inside PRO
                      Alexey Minkov
                      4.75 (55)
                      SALE NOW! Limited Time Offer! An exclusive indicator that utilizes an innovative algorithm to swiftly and accurately determine the market trend. The indicator automatically calculates opening, closing, and profit levels, providing detailed trading statistics. With these features, you can choose the most appropriate trading instrument for the current market conditions. Additionally, you can easily integrate your own arrow indicators into Scalper Inside Pro to quickly evaluate their statistics and
                      Tanıtım       Kuantum Trend Keskin Nişancı Göstergesi   , trend tersine dönmeleri belirleme ve ticaret yapma şeklinizi değiştiren çığır açan MQL5 Göstergesi! 13 yılı aşkın ticaret tecrübesine sahip deneyimli tüccarlardan oluşan bir ekip tarafından geliştirilmiştir.       Kuantum Trend Keskin Nişancı Göstergesi       trend dönüşlerini son derece yüksek doğrulukla belirlemenin yenilikçi yolu ile ticaret yolculuğunuzu yeni zirvelere taşımak için tasarlanmıştır. ***Kuantum Trend Keskin Nişancı Gö
                      Fiyat tersine döndükçe ve geri çekildikçe piyasa yapısından elde edilen kâr değişir. Piyasa yapısını tersine çevirme uyarısı göstergesi, bir trendin veya fiyat hareketinin ne zaman tükenmeye yaklaştığını ve tersine dönmeye hazır olduğunu tanımlar. Genellikle bir geri dönüş veya büyük bir geri çekilme meydana gelmek üzereyken meydana gelen piyasa yapısındaki değişiklikler konusunda sizi uyarır. Gösterge, olası bir tükenme noktasının yakınında her yeni yüksek veya düşük oluştuğunda, başlangıçta
                      TPSpro RFI Levels
                      Roman Podpora
                      5 (13)
                      A key element in trading is zones or levels from which decisions to buy or sell a trading instrument are made. Despite attempts by major players to conceal their presence in the market, they inevitably leave traces. Our task was to learn how to identify these traces and interpret them correctly. Reversal First Impulse levels (RFI)   -  Version MT5                INSTRUCTIONS                 RUS                 ENG                                       R ecommended to use with an indicator   -  
                      Break and Retest
                      Mohamed Hassan
                      5 (4)
                      Break & Retest is unstoppable when combined with our other divergence indicator. After purchase, send us a message and you could get this  2nd indicator  for  FREE  as a  BONUS! ‍You can visually backtest Break & Retest to see how it behaved in the past!    Manual guide:   Click here $59  for the first 25 copies ( 1  left)! Next price is $120 .  This Indicator only places quality trades when the market is really in your favor with a clear break and retest. Patience is key
                      Trend Screener
                      STE S.S.COMPANY
                      4.83 (86)
                      Trend Göstergesi, Trend Alım Satım ve Filtreleme için Çığır Açan Benzersiz Çözüm, Tüm Önemli Trend Özellikleriyle Tek Bir Araç İçinde Yerleştirildi! Forex, emtialar, kripto para birimleri, endeksler ve hisse senetleri gibi tüm sembollerde/araçlarda kullanılabilen %100 yeniden boyamayan çoklu zaman çerçevesi ve Çoklu para birimi göstergesidir. Trend Screener, grafikte noktalarla ok trend sinyalleri sağlayan etkili bir trend trend göstergesidir. Trend analizörü göstergesinde bulunan özellikler: 1.
                      Quantum Breakout Indicator PRO
                      Bogdan Ion Puscasu
                      4.96 (26)
                      Tanıtım       Quantum Breakout PRO   , Breakout Bölgeleri ile ticaret yapma şeklinizi değiştiren çığır açan MQL5 Göstergesi! 13 yılı aşkın ticaret deneyimine sahip deneyimli tüccarlardan oluşan bir ekip tarafından geliştirilen   Quantum Breakout PRO   , yenilikçi ve dinamik koparma bölgesi stratejisiyle ticaret yolculuğunuzu yeni zirvelere taşımak için tasarlanmıştır. Kuantum Breakout Göstergesi, size 5 kar hedefi bölgesi ile kırılma bölgelerinde sinyal okları ve kırılma kutusuna dayalı ol
                      Özel MT4 göstergemizle başarılı forex ticaretinin sırrını keşfedin! Forex piyasasında nasıl başarıya ulaşacağınızı hiç merak ettiniz, riski en aza indirirken sürekli olarak kar kazandınız mı? İşte aradığınız cevap! Ticaret yaklaşımınızda devrim yaratacak tescilli MT4 göstergimizi tanıtmamıza izin verin. Benzersiz çok yönlülük Göstergemiz, Renko ve RangeBar Mum oluşumlarını tercih eden kullanıcılar için özel olarak tasarlanmıştır. Bu grafik türlerinin birçok deneyimli tüccar tarafından ter
                      FX Volume
                      Daniel Stein
                      4.6 (35)
                      Sabah Brifingimiz aracılığıyla ayrıntılar ve ekran görüntüleri ile günlük piyasa güncellemenizi alın burada mql5 ve on Telegram ! FX Volume, bir brokerin bakış açısından piyasa duyarlılığı hakkında GERÇEK bir fikir veren İLK ve TEK hacim göstergesidir. COT raporlarından çok daha hızlı bir şekilde, brokerlar gibi kurumsal piyasa katılımcılarının Forex piyasasında nasıl konumlandıklarına dair harika bilgiler sağlar. Bu bilgileri doğrudan grafiğinizde görmek, ticaretiniz için gerçek oyun değiştir
                      FX Power MT4 NG
                      Daniel Stein
                      5 (8)
                      Sabah Brifingimiz burada mql5 ve on Telegram! FX Power MT4 NG , uzun zamandır çok popüler olan döviz gücü ölçerimiz FX Power'ın yeni neslidir. Peki bu yeni nesil güç ölçer ne sunuyor? Orijinal FX Power hakkında sevdiğiniz her şey PLUS GOLD/XAU güç analizi Daha da hassas hesaplama sonuçları Ayrı ayrı yapılandırılabilir analiz dönemleri Daha da iyi performans için özelleştirilebilir hesaplama limiti Özel çokluDaha fazlasını görmek isteyenler için örnek ayarlar Her grafikte en sevdiğiniz renkler i
                      Currency Strength Wizard , başarılı ticaret için size hepsi bir arada çözüm sağlayan çok güçlü bir göstergedir. Gösterge, birden çok zaman dilimindeki tüm para birimlerinin verilerini kullanarak şu veya bu forex çiftinin gücünü hesaplar. Bu veriler, şu veya bu para biriminin gücünü görmek için kullanabileceğiniz, kullanımı kolay para birimi endeksi ve para birimi güç hatları biçiminde temsil edilir. İhtiyacınız olan tek şey, işlem yapmak istediğiniz tabloya göstergeyi eklemektir ve gösterge size
                      Mucizevi Forex Göstergesi Tanıtımı: Keskin Ticaretin Gücünü Serbest Bırakın Tüm zaman dilimlerinde gerçekten olağanüstü sonuçlar sunan en iyi Forex göstergesini aramaktan sıkıldınız mı? Artık aramayın! Mucizevi Forex Göstergesi, ticaret deneyiminizi devrimleştirip kazançlarınızı yeni zirvelere taşımak için burada. Gelişmiş teknoloji ve yılların özenli geliştirmesi temelinde Mucizevi Forex Göstergesi, döviz piyasasında güç ve keskinlik açısından doruğa çıkar. Bu olağanüstü araç, tüm seviyelerdeki
                      Advanced Supply Demand
                      Bernhard Schweigert
                      4.92 (310)
                      CURRENTLY 26% OFF !! Best Solution for any Newbie or Expert Trader! This indicator is a unique, high quality and affordable trading tool because we have incorporated a number of proprietary features and a new formula. With this update, you will be able to show double timeframe zones. You will not only be able to show a higher TF but to show both, the chart TF, PLUS the higher TF: SHOWING NESTED ZONES. All Supply Demand traders will love it. :) Important Information Revealed Maximize the potenti
                      TrendDecoder Premium
                      Christophe, Pa Trouillas
                      5 (3)
                      Aralıkları ve bir sonraki olası hamleleri belirleyin   |  Trendlerin en erken sinyallerini ve gücünü alın   |  Geri dönüşten önce net çıkışlar alın   |  Fiyatın test edeceği Fibo seviyelerini tespit edin Gecikmesiz, takip edilmeyen gösterge - manuel ve otomatik ticaret için ideal - tüm varlıklar ve tüm zaman birimleri için uygun Sınırlı süreli teklif >>   %50 İNDİRİM Satın aldıktan sonra, kişiselleştirilmiş ayarlar için bu kanaldan benimle iletişime geçin . MT5   sürümü:   buraya tıklayın Tam y
                      TrendMaestro
                      Stefano Frisetti
                      5 (2)
                      note: this indicator is for METATRADER4, if you want the version for METATRADER5 this is the link: TRENDMAESTRO recognizes a new TREND in the bud, he never makes mistakes. The certainty of identifying a new TREND is priceless. DESCRIPTION TRENDMAESTRO identifies a new TREND in the bud, this indicator examines the volatility, volumes and momentum to identify the moment in which there is an explosion of one or more of these data and therefore the moment in which prices have strong probability of f
                      ŞU ANDA %31 INDIRIMLI !!! Yeni Başlayanlar veya Uzman Tüccarlar için En İyi Çözüm! Bu gösterge benzersiz, yüksek kaliteli ve uygun fiyatlı bir ticaret aracıdır çünkü bir dizi tescilli özellik ve gizli bir formül ekledik. Yalnızca BİR grafikle 28 döviz çiftinin tümü için Uyarılar verir. Yeni bir trendin veya scalping fırsatının tam tetik noktasını belirleyebildiğiniz için ticaretinizin nasıl gelişeceğini hayal edin! Yeni temel algoritmalar üzerine inşa edilen bu sistem, potansiyel işlemler
                      Price Action Entry Alerts
                      Stephen Sanjeeve Sahayam
                      5 (3)
                      Bu gösterge, alış veya satış baskısı için her çubuğu tarar ve en yüksek hacme sahip 4 tip mum modelini tanımlar. Bu mumlar daha sonra Alış veya Satış sinyallerini göstermek için birkaç doğrusal filtre kullanılarak filtrelenir. Sinyaller, daha yüksek zaman çerçevesi yönüyle bağlantılı olarak ve yüksek hacimli saatlerde alım satım yapıldığında en iyi sonucu verir. Tüm filtreler özelleştirilebilir ve bağımsız çalışır. Bir düğmeyi tıklayarak tek bir yönün sinyallerini görüntüleyebilir. Bu gösterge
                      Entry Points Pro
                      Yury Orlov
                      4.7 (225)
                      Yeniden boyamadan bir ticarete girmek için doğru sinyaller sağlayan MT5 için en iyi gösterge! Herhangi bir finansal varlığa uygulanabilir: forex, kripto para birimleri, metaller, hisse senetleri, endeksler. MT5 versiyonu burada Oldukça doğru alım satım sinyalleri sağlayacak ve bir alım satımı açıp kapatmanın en iyi zamanını size söyleyecektir. Göstergeyi ödeyen yalnızca bir sinyali işleme örneğiyle videoyu (6:22) izleyin! Çoğu tüccar, Giriş Noktaları Pro göstergesinin yardımıyla ilk işl
                      Trend Forecasting
                      Mohamed Hassan
                      5 (15)
                      This indicator is unstoppable when combined with our other indicator called Katana. After purchase, send us a message and you could get Katana for FREE as a BONUS After purchase, send us a private message for your instructions.  MT5 version: click here 3 copies left available at $45. Next price is $99. Don't miss this great deal!  The Trend Forecasting indicator is a very unique & easy tool that is able to make prediction about future price movement based on the signals generated
                      ÇOKLU PARA BİRİMİ ve ÇOK ZAMANLI ÇERÇEVE ALIM VE SATIŞ UYARISI. OTOMATİK TAKİP DURDURMA VE RİSK ÖDÜLÜ KÂR AL! GÖSTERGE TARAMALARI VE PİYASAYI ANALİZ ETMEK, YAPACAK BİR ŞEYİNİZ YOK! TÜM PARA BİRİMLERİNİZİ 1 GRAFİKTE İŞLEM YAPIN!   Satın aldıktan sonra lütfen yorum bırakın benimle iletişime geçin, size ticaret asistanı EA'yı göndereceğim. Gösterge, en iyi ONAYLANMIŞ giriş noktalarını bulmak için çeşitli Osilatörler ve ekli filtreler kullanıyor, bu nedenle bu konuda endişelenmenize gerek yok
                      How to use Pair Trading Station Pair Trading Station is recommended for H1 time frame and you can use it for any currency pairs. To generate buy and sell signal, follow few steps below to apply Pair Trading Station to your MetaTrader terminal. When you load Pair Trading Station on your chart, Pair Trading station will assess available historical data in your MetaTrader platforms for each currency pair. On your chart, the amount of historical data available will be displayed for each currency pai
                      PRO Renko Sistemi, RENKO grafikleri ticareti için özel olarak tasarlanmış son derece hassas bir ticaret sistemidir. Bu, çeşitli ticaret araçlarına uygulanabilen evrensel bir sistemdir. Sistemi etkin piyasa sana doğru ters sinyallerine erişim hakkı denilen ses nötralize eder. Göstergenin kullanımı çok kolaydır ve sinyal üretiminden sorumlu tek bir parametreye sahiptir. Aracı, seçtiğiniz herhangi bir ticaret aracına ve renko çubuğunun boyutuna kolayca uyarlayabilirsiniz. Yazılımımla karlı b
                      Yazarın diğer ürünleri
                      SensorMap
                      Juergen Thielen
                      5 (1)
                      Concept Market arranges in Time upcoming Phases according to the present Results of its Interest. Directing Modulations are an Interaction of immanent Periods, which show in Reference to Time cyclic Activity and to Price leveling Activity. SensorMap is a reflecting Volume Mask of this Concept of Time and Price and apportioning developed Price Movements in an equalized 100 % - Range: how far moved ? indicating their Status by marking special Events: when which Action ? setting the Situation in
                      FREE
                      Filtrele:
                      Daniel
                      878
                      Daniel 2023.07.26 17:01 
                       

                      Ich schaue mir beide Indis von dir mal an, Optik und Ausführung perfekt, mal schauen wie ichdamit zurecht komme. Erstmal vielen dank für die Indis und die Arbeit.

                      Jamie Daniel Thompson
                      263
                      Jamie Daniel Thompson 2023.06.22 14:43 
                       

                      Extremely useful and incredible tool! I don't understand how this doesn't have 5 star reviews yet! It has totally changed the accuracy of my entries! Thanks to the author!

                      İncelemeye yanıt
                      Sürüm 3.7 2023.04.16
                      Integration of the TickEvent News-Addon, no further Changes
                      Sürüm 3.6 2023.04.10
                      final Pixelwork on the Phase-Propeller, no further Changes.
                      Sürüm 3.5 2023.03.14
                      extended by Single-Pivot Option
                      Sürüm 3.4 2023.03.12
                      Taken out redundant Pivot-Adjustment (H4) and extended by Time-Adjustment Server-Terminal
                      Sürüm 3.3 2023.03.09
                      aligned/ defined/ extended/ finalized/ homologized/ completed
                      Sürüm 3.2 2022.12.20
                      The Bull-Bear-Propeller received an indicational update and prints now the Propeller-Status instead of the actual period-direction..
                      Sürüm 3.1 2022.12.19
                      PØINTZERØ SENSØRMAP is now splitted in two separate partial indicators, independent of each other working, standalone functional, fully enfolding their power by combination.

                      PØINTZERØ >+< PRØJECTØR: oscillating absolute Pricechart relating the functional categories (main)
                      SENSØRMAP <+> REFLECTØR: equalized relative Timechart alternating the categorized functions (sub)

                      If you want to have a Visual of the complete PØINTZERØ SENSØRMAP, please save a SENSØRMAP-Template as Tester-Template (tester.tpl) in templates-folder.
                      Of course you should load the indicator in advance ;-)

                      Merry christmas world!
                      Sürüm 3.0 2022.11.26
                      major update v 3.0
                      Sürüm 2.9 2022.11.21
                      faster and better than planned.. observation is the only functioning technique!
                      Sürüm 2.8 2022.11.17
                      if I wouldn't love what I do, I wouldn't do what I do.. PIV-color-setup now functional.. H4 reimplemented - no daytrading without it.. now with a clear conscience..
                      Sürüm 2.7 2022.11.17
                      functionality of Navi-News-Panel adjusted and sudden period-counting-typo corrected.. patience always gets rewarded..
                      Sürüm 2.6 2022.11.17
                      with this last update for this year everything is brought into the right light. compose and develop markets image as variable as market is driven. HAIRCROSS and enabled TOOL answer most of initial/ orientational questions. I wish nice holidays!
                      Sürüm 2.5 2022.11.17
                      PEN-rotor_stator now Trendline instead of txt-object //dismissed PIV<D1 // optimized PEN-Trace-Trend-Logic: Trace= dark/ Trend= bright : this way realistic price-action-mirroring // dismissed obsolete variables , some household and freshing cosmetics - imaging sharper every update..//
                      Sürüm 2.4 2022.11.16
                      the spread-level-warn-display had to be corrected..
                      Sürüm 2.3 2022.11.16
                      final touches and cosmetics..
                      Sürüm 2.2 2022.11.14
                      simplified visual, any effort is dedicated to optimized functionality..
                      Sürüm 2.1 2022.11.13
                      poets on coding serials..interst stands in front of discovery.
                      Sürüm 2.0 2022.11.09
                      adjusted the speed-display to directional colors, now makes sense ;-)
                      Sürüm 1.9 2022.11.09
                      some further internal optimizations..
                      Sürüm 1.8 2022.11.07
                      update to new MT4 Terminal-version 4.00 build 1363 03 Nov 2022, it comes with several internal optimizations..
                      Sürüm 1.7 2022.11.03
                      color correction corner 3, apart from that conflict-free presentation today..
                      Sürüm 1.6 2022.11.03
                      minor graphical definitions - mismatches cleared - no further irregularities discovered.. stable and vivid.. here go
                      Sürüm 1.5 2022.11.01
                      the value of a calibration one can measure in signals, which accomplish to pass revision tests by being such rare that any revision would take days..
                      Sürüm 1.4 2022.11.01
                      there is always potential to optimize.. redundants cleared..
                      Sürüm 1.3 2022.10.30
                      with one last minor graphical correction this now awaits to become discovered by you
                      Sürüm 1.2 2022.10.30
                      the winter-time-change cheated the last update - corrected + goddie for wintertime :-)
                      Sürüm 1.1 2022.10.30
                      Functional Implematation of the Rotor-Stator-Function via Bull and Bear, obsolete code cleaned and graphics and visuals defined