Supply Demand levels
- Göstergeler
- Sürüm: 1.2
- Güncellendi: 13 Mayıs 2025

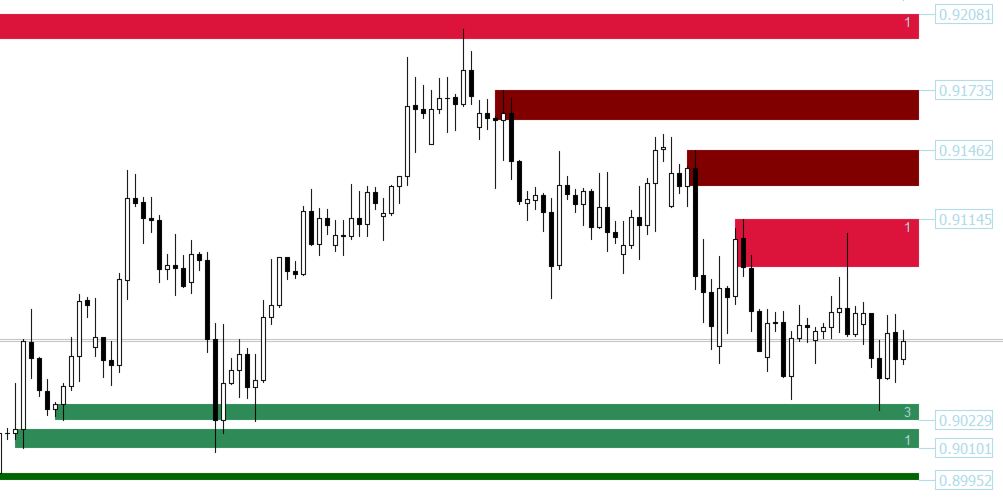
Bu gösterge, grafikte arz ve talep bölgeleri çizer. Kendi kurallarınız ve tekniklerinizle birleştiğinde, bu gösterge kendi güçlü sisteminizi yaratmanıza (veya geliştirmenize) olanak tanır. Lütfen çok daha fazlasını sunan ücretli sürümü de inceleyin. Tavsiyem, ilk bölge testinin en az 25 bardan sonra gerçekleştiği işlem fırsatlarını aramanızdır.
Özellikler
- Bölgeler 3 renge sahiptir (girişle ayarlanabilir). Test edilmemiş bölge için koyu renk, test edilmiş bölge için orta renk ve bozuk bölge için açık renk .
- Her bölgeye, bölge dış sınırının fiyatı ve bölge test tutarı yazılır.
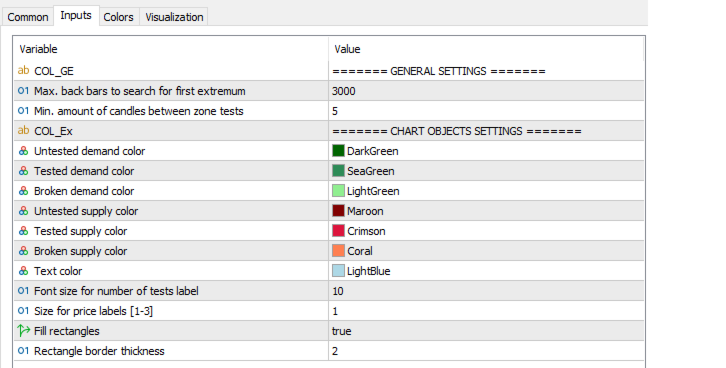
Giriş parametreleri
- İlk ekstremumu aramak için maksimum arka çubuklar - Varsayılan 3000'dir. Zaman içinde ilk ekstremum xx barlarını arayacaktır. Değer ne kadar yüksekse o kadar fazla sistem kaynağı gerekecektir . Daha yavaş bilgisayarlar için 500-1000 değeri daha uygun olabilir.
- Bölge testleri arasındaki minimum mum miktarı
- Test edilmemiş talep rengi
- Test edilen talep rengi
- Kırık talep rengi
- Test edilmemiş tedarik rengi
- Test edilmiş tedarik rengi
- Kırık tedarik rengi
- Metin rengi
- Test sayısı etiketi için yazı tipi boyutu
- Fiyat etiketleri için boyut [1-3]


отлично