Support Resistance Risk Management MT4

Introduction to Support Resistance Risk Management

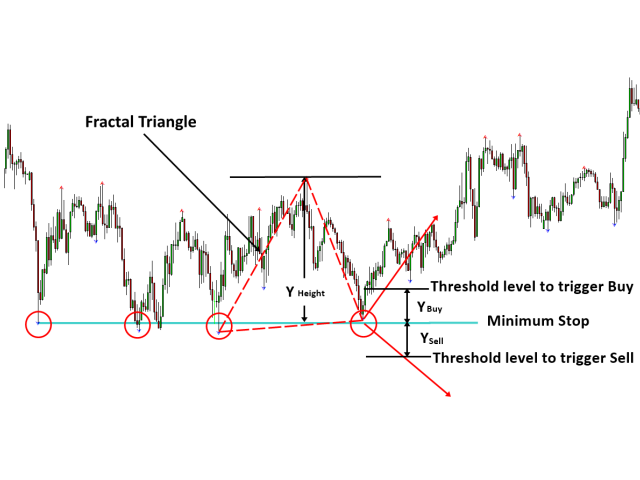
Support Resistance is the most trusted technical analysis. However, the risk management for the support and resistance is not practiced often. Hence we provide one effective risk managment method for the support and resistance trader. In the book: Scientific Guide To Price Action and Pattern Trading (Wisdom of Trend, Cycle, and Fractal Wave), how to use Support Resistance is described as well as Fibonacci Analysis, Harmonic Pattern, Elliott Wave Theory and X3 Chart Pattern. In the book, the concept "Trigger Level" for support and resistance was introduced. Trigger Level is the entry price offset from the support and resistance based on Fractal Triangle. This Trigger Level concept was introduced to avoid the false breakout or false reversal signal around the support and resistance as well as for the risk. The essence of the trigger level concept is to use the fractal triangle around support and resistance to set minimum stop, entry and profit target. We provide two implementations of this trigger level concept including Symmetrical Trigger Level and Symmetrical Fibonacci Retracement.


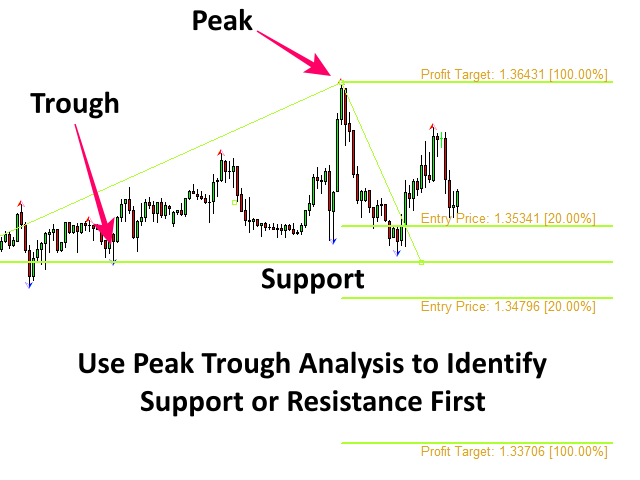
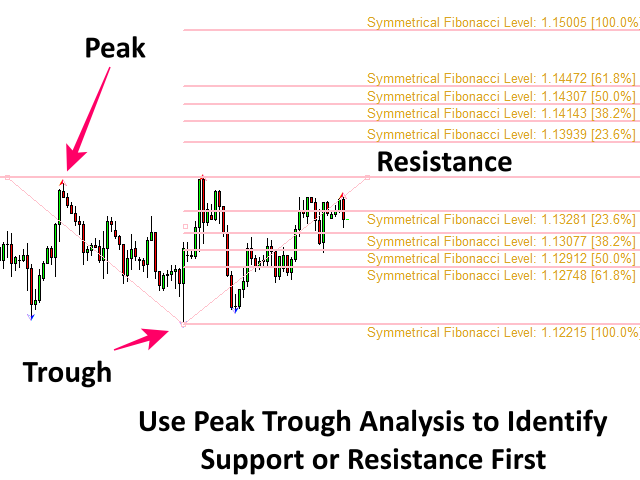
Identify Support Resistance to Trade

Support and Resistance was orignally created to react to the market (Although it can predict the market direction. We will not explain this here). Use the provided Peak Trough Analysis to identify the important Support or Resistance. Once you have drawn the support or resistance line in your chart, half of work is done. Next, you will wait until price is pushed to one direction by crowd, then you will follow the price (=react to market). The is the most genetric scheme to trade with support and resistance.


Risk Management with Support Resistance

Once you have drawn the support or resistance, the trigger level concept suggests you to identify three important price including minimum stop, entry price and profit target to manage risk.

* Minimum Stop: This is often support or resistance itself. As price can revist the support or resistance , it is best to provide some margin from this minimum Stop Loss level

* Entry Price: Entry price is used to avoid false breakout or false reversal signal. Whether you are trading with the first wave or third wave from the support resistance, this price is important. 

* Profit Target: First price level you can use as the profit target is the height of Fractal Triangle as we assume that price can revisit the peak or trough in your chart. Depending on your market condition, your profit target can be greater than the height of Fractal Triangle. If the market condition is less favourable to the trading direction, then you can set profit target slighly less than the height of Fractal Triangle.


Add Risk Management Tools to Chart

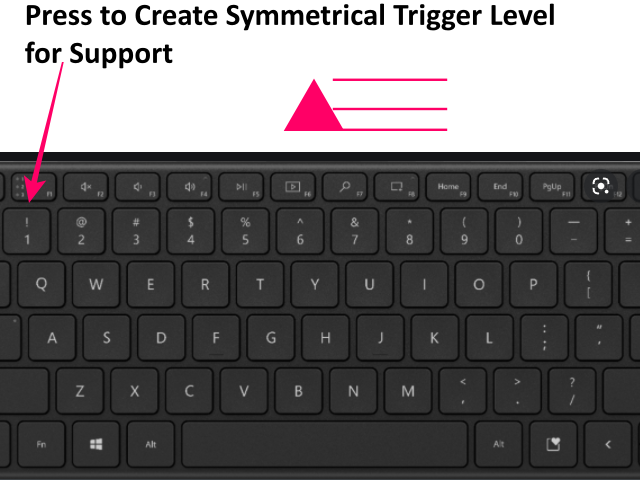
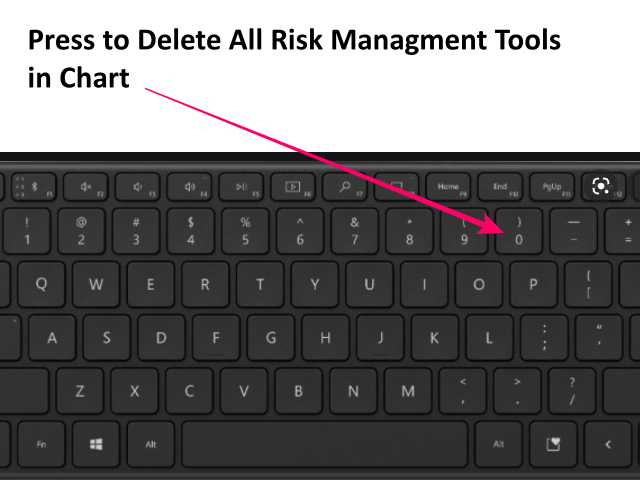
You can access the risk management tool from the Support Resistance Risk Managment using the number keys. Firstly, attach the indicator to your chart. Then use the following number keys to insert or delete the risk management tools. 

Number Key 0: Delete All Risk Management Tools in your chart

Number Key 1: Add a Symmetrical Trigger Level for Support or trough peak trough fractal triangle.

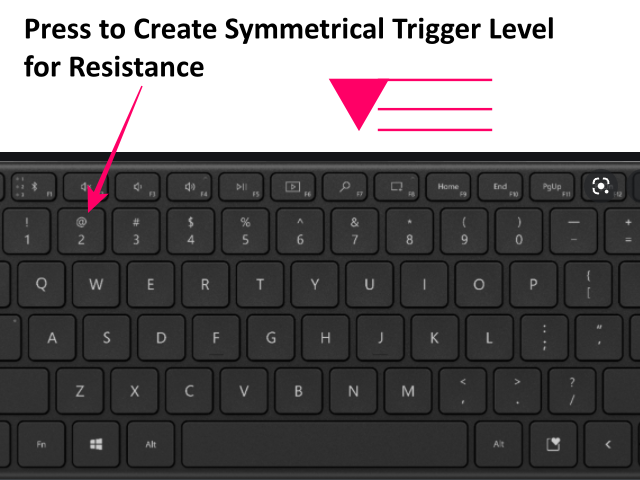
Number Key 2: Add a Symmetrical Trigger Level for Resistance or peak trough peak fractal triangle.

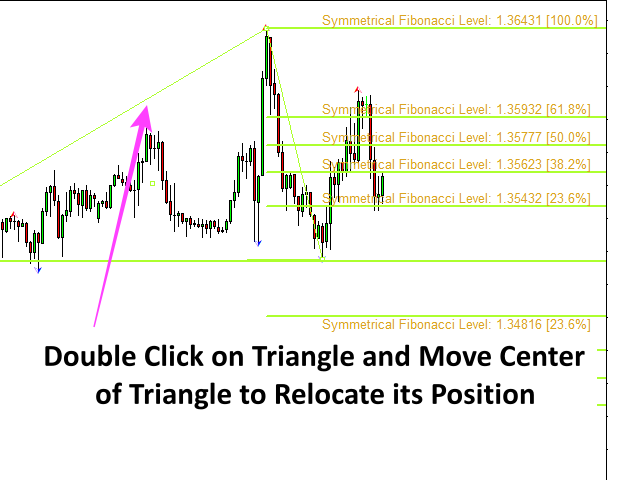
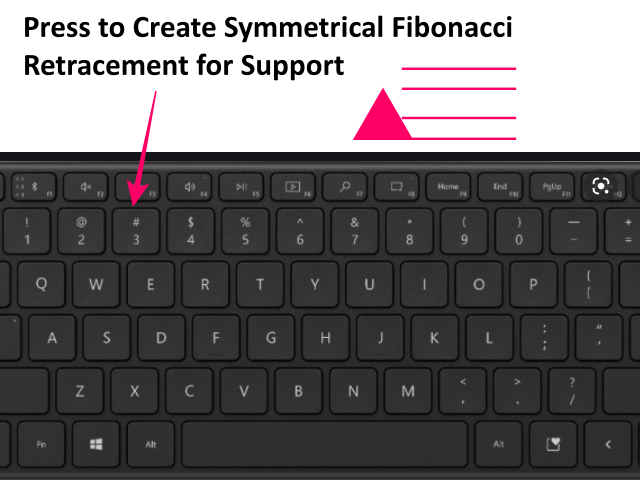
Number Key 3: Add a Symmetrical Fibonacci Retracement for Support or trough peak trough fractal triangle.

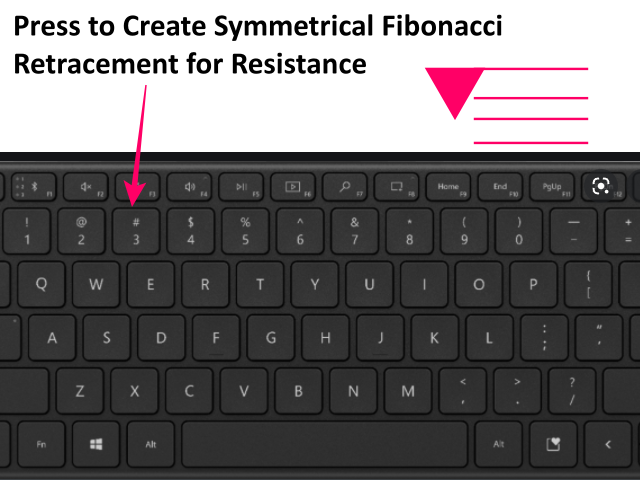
Number Key 4: Add a Symmetrical Fibonacci Retracement for Resistance or peak trough peak fractal triangle.


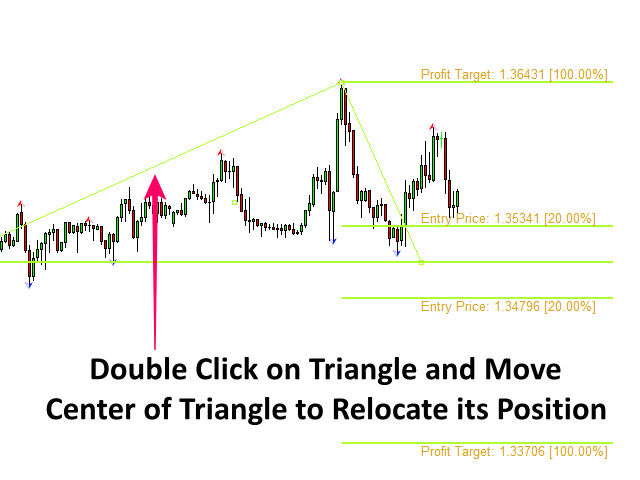
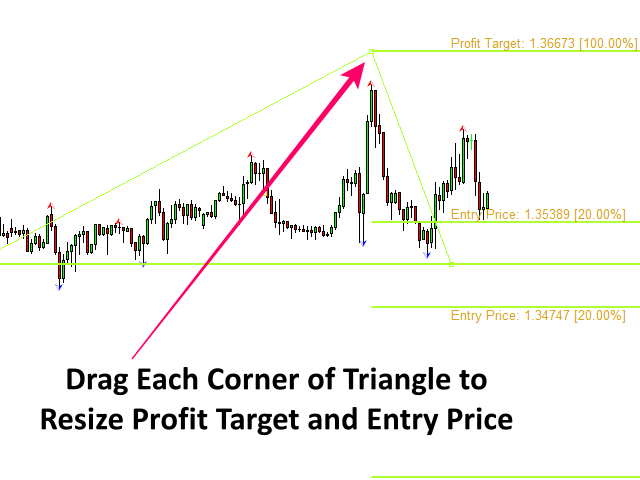
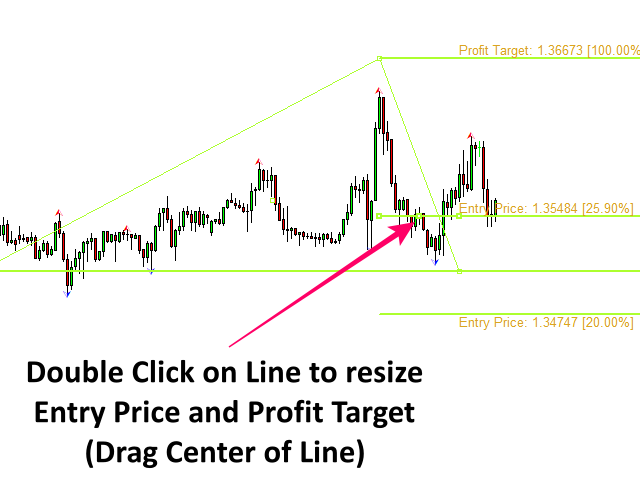
Drag to Adjust Location and Size

Once the risk management tool is added to a chart, the you can relocate the tool by dragging the center of the fractal triangle. By dragging the top or bottom corner of the triangle, you can also fit the size of fractal triangle to support and resistance. Your task is to identify the Fractal Triangle.


Indicator Alert

You can draw the support and resistance before price approaches near the support and resistance. In this case, you might have to wait until the price approaches near the support or resistance. When the risk management tool is placed, it will send the alert when the price arrives near the support or resistance. Control it by "Alert Percent input".


Support Resistance Indicator Guide

https://www.mql5.com/en/blogs/post/750387


Önerilen ürünler
Multi Pivot Indicator - Professional Trading Tool MULTI PIVOT PRO INDICATOR Professional Multi Pivot Indicator for MT4 5-in-1 Pivot Indicator Professional Trading Tool for MetaTrader 4 ENGLISH TÜRKÇE Multi Pivot Indicator PRO Classic Fibonacci Camarilla Woodie DM What is Multi Pivot Indicator? Multi Pivot Indicator is a professional trading tool that displays 5 different pivot calculation methods on your MetaTrader 4 charts. Pivot points are critical support and resistance
Introduction to Support Resistance Indicator Support and Resistance are the important price levels to watch out during intraday market. These price levels are often tested before development of new trend or often stop the existing trend causing trend reversal at this point. Highly precise support and resistance are indispensable for experienced traders. Many typical trading strategies like breakout or trend reversal can be played well around these support and resistance levels. The Precision Sup
Introducing the River Flow Divergence Indicator Are you ready to unlock your trading potential? Meet the River Flow Divergence Indicator, a powerful tool designed to help you navigate market trends and reversals with precision. This indicator is tailored for traders who are eager to fine-tune their strategies and take control of their success. Note: This indicator is not optimized out of the box. It’s crafted for you to customize and optimize according to your unique trading style and goals. Ho
PP Super Trend MT4
Mohammad Taher Halimi Tabrizi
Pivot Point Super Trend is another type of famous super trend indicator which is equipped with pivot points in different way. this indicator used to be available in the Trading view and this is converted from there to the MT4 language. MT5 version of the indicator is also available and you can find in my products. there are also buy/sell signals shown on the screen.
Sniper Trend Fusion
Ilham Hijrah Saputra
Sniper Trend Fusion This indicator is a powerful all-in-one trading tool designed to simplify chart analysis and improve decision-making. It combines multiple proven techniques into a single system, helping traders identify trend direction, volatility, key price levels, and market structure without clutter. Instead of switching between multiple indicators, everything you need is integrated into one smooth and efficient interface. Key Advantages All-in-One System Combines trend, volatility, sup
FREE
Gold of the Incas
Dmitriq Evgenoeviz Ko
Gold of the Incas is a highly effective trading advisor created specifically for the MT4 platform and focused on the gold market and major currency pairs. Using complex algorithms, it analyzes market trends and price fluctuations in real time, ensuring maximum profit with minimal risk. the full list for your convenience is available https://www.mql5.com/ru/users/pants-dmi/seller The effectiveness of Gold of the Incas is confirmed by long testing periods, where it demonstrated outstanding res
CyberZingFx Trend Reversal
Afsal Meerankutty
4.18 (17)
NEW YEAR SPECIAL DISCOUNT RUNNING NOW 40% DISCOUNT Price slashed from $149 to $89 until 3rd Jan 2025 Indicator captures the trend reversals with no-repaint Buy and Sell Arrow signals. CyberZingFx Trend Reversal Indicator - your go-to solution for accurate and reliable trend reversal signals. With its  advanced trading strategy , the indicator offers you Buy and Sell Arrow signals that do not repaint, making it a reliable tool for catching Swing Highs and Swing Lows in any market and any time fr
Price Breakout pattern Scanner is the automatic scanner for traders and investors. It can detect following patterns automatically from your chart. Head and Shoulder - Common tradable pattern. Reverse Head and Shoulder - This pattern is the reverse formation of the Head and Shoulder. Double Top - When the price hits resistance level twice and decline toward the support level, the trader can anticipate sudden bearish breakout through the support level. Double Bottom - The double bottom pattern is
Signaline
Ahmet Metin Yilmaz
SIGNALINE INDICATOR This indicator for all pairs and all timeframes I have just completed the M5 timeframe for deep optimization EURJPY yet. EURJPY M5 Optimization ( TP=150 , SL=130 , IndicatorPeriod=6 , Mov1=22 , Mov2=48 ) (*)Added 20.05.2019 You can find this signal page below https://www.mql5.com/en/signals/583477 Other optimizasyon results will be added on this signalpage. Input Parameters: IndicatorPeriod: Default is 8. Mov1               : Default is 21. Mov2               : Default is 48.
DualVWAP
Kourosh Hossein Davallou
Dual Timeframe VWAP Indicator for MT4  Description Professional VWAP indicator that displays both **Daily** and **Weekly** VWAP simultaneously on your chart.   Features: - Dual VWAP Lines: Blue for Daily, Red for Weekly - Configurable Bands: Two deviation bands for each timeframe - Session Control: Customizable trading hours for Daily VWAP - Clean Visuals: Solid lines for main VWAP, dashed for bands - Optimizable: Parameters can be optimized using Genetic Algorithm Key Settings: - Enable/di
Introduction It is common practice for professional trades to hide their stop loss / take profit from their brokers. Either from keeping their strategy to the themselves or from the fear that their broker works against them. Using this indicator, the stop loss / take profit points will be drawn on the product chart using the bid price. So, you can see exactly when the price is hit and close it manually.  Usage Once attached to the chart, the indicator scans the open orders to attach lines for t
Classic Fractals indicator for MT4, with additional Trendlines connecting the latest couples of fractals ( fractals are showing highest high, and lowest low on each period) Rules for trendlines: -if new top fractal is below the last one = new resistance line -if new bot fractal is above the last one = new support line -Trendlines can be hidden -Fractals can be hidden Fractal Period = can be both even or uneven number, as it is setting for half (one side) of the bars sequence for findin
FiboPlusWaveRunner
Sergey Malysh
3.29 (7)
Expert. Automatic and manual trading. Ready-made trading system based on Elliott waves and Fibonacci retracement levels . It is simple and affordable. Display of the marking of Elliott waves (main or alternative option) on the chart Construction of horizontal levels, support and resistance lines, a channel Superposition of Fibonacci levels on waves 1, 3, 5, A Alert system (on-screen, E-Mail, Push notifications) visual panel for opening orders in manual trading visual panel for setting up automat
Simple supply and demand indicator which should help identify and visualize S&D zones. Settings: Color for supply zones, color for demand zones - default colors are set for dark (black) background. Number of how much zones should be created above and below current price - value "3" means there will be 3 zones above current price and 3 zones below current price. Principle: When price creates "V", reversal zone is registered. Rectangle filled based on zone type (supply / demand) is drawn if price
Mean Reversion Supply Demand Indicator Mean Reversion Supply Demand is the indicator to detect the important supply demand zone in your chart. The concept of supply demand trading relies on the quantity mismatching between buying and selling volumes in the financial market. Typically, supply demand zone serves to predict the turning point. The wave pattern, for any supply demand zone to work as an successful trade, looks like the price must touch the base zone, move away and then return to zone
Introduction to Fibonacci Volatility Indicator Volatility indicator can help you to detect any statistical advantage for your trading. Especially, if you are trading with Price Action and Price Patterns, then we recommend to use the Volatility indicator together with your strategy. Especically, Fibonacci Volatility indicator combines the market volatiltiy with Fibonacci Analysis to provide you more advanced volatiltiy indicator. Main Features Fibonacci Volatility in Z score Configuration Mode Fi
Commodity Channel Index Message is an indicator for the MetaTrader 4 trading platform. Unlike the original indicator, this three in one version has a system of alerts that inform on market situation changes. It consists of the following signals: when the Main line crosses the levels of extreme zones and 50% level; when the Main line crosses the Trend line in the indicator window; Divergence on the last bar. Values of the middle and extreme levels and divergence zones are customizable. Parameter
mql5 version:  https://www.mql5.com/en/market/product/44815 Simple indicator to calculate profit on fibonacci retracement levels with fixed lot size, or calculate lot size on fibonacci levels with fixed profit. Add to chart and move trend line to set the fibonacci retracement levels. Works similar as default fibonacci retracement line study in Metatrader. Inputs Fixed - select what value will be fix, lot or profit Fixed value - value that will be fix on all levels Levels - levels for which to ca
"Supply / Demand Zones" The concepts of supply and demand zones   are undoubtedly two of the most highly discussed attributes of technical analysis. Part of analysing chart of pattern , these terms are used by traders   to refer to price levels i n charts that tend to act as barriers, preventing the price of an asset from getting pushed in a certain direction. At first, the explanation and idea behind identifying these levels seems easy, but as you'll find out, supply and demand zones can come
We present you the indicator "Candle closing counter", which will become your indispensable assistant in the world of trading. That’s why knowing when the candle will close can help: If you like to trade using candle patterns, you will know when the candle will be closed. This indicator will allow you to check if a known pattern has formed and if there is a possibility of trading. The indicator will help you to prepare for market opening and market closure. You can set a timer to create a pre
SMC Venom Model BPR göstergesi, Akıllı Para (SMC) konseptinde çalışan yatırımcılar için profesyonel bir araçtır. Fiyat grafiğinde iki temel modeli otomatik olarak belirler: FVG   (Adil Değer Açığı), ilk ve üçüncü mum arasında boşluk bulunan üç mumun birleşimidir. Hacim desteğinin olmadığı seviyeler arasında bir bölge oluşturur ve bu da sıklıkla fiyat düzeltmesine yol açar. BPR   (Dengeli Fiyat Aralığı), bir "köprü" oluşturan iki FVG modelinin birleşimidir - bir kırılma bölgesi ve fiyatın düşük
Break Moment
Svyatoslav Kucher
5 (2)
Break Moment is a unique proprietary indicator with extensive capabilities and a variety of settings. It can be used as a signal generator or as an auxiliary tool. For the calculations, the price channel is determined. When it is broken, if all conditions of the additional filter are met, it displays a signal in the form of a histogram. Break Moment can be used to determine the main trend, as it has 2 filters for determining it in addition to everything else. If these filters are activated, the
This product is a part of  ON Trade Waves Patterns Harmonic Elliot Wolfe you can test free version on EURJPY from this link  Wolf Waves Indicator Kurt Dalgalarını Keşfedin - En İyi Ticaret Aracınız! Herhangi bir zaman diliminde Kurt Dalgalarını kolayca tespit etmek için güçlü bir araç mı arıyorsunuz? Daha fazla aramayın! Kurt Dalgaları göstergemiz bu işi zahmetsizce halleder. İşte neden sizin için mükemmel olduğunu anlatıyoruz: Ana Özellikler: Otomatik Algılama:   Kurt Dalgaları göstergemiz a
Fibonacci Magic Pivot Levels
Savia Forex Software Solutions
Fibonacci Magic Pivot Levels The  Fibonacci Magic Pivot Levels  is a  powerful yet easy to use indicator . It   continuously monitor s intra-day  price action  and uses complex algorithms to calculate and detect key support, resistance and pivot levels, using the D1 timeframe as a filter.  The    Fibonacci Magic Pivot Levels is optimized for H4, H1, M30, M15, M5 & M1 timeframes and  can be used on ALL Currencies, Indices, Commodities, and Cryptocurrency pairs . Trade with improved confidence an
Gyroscopes
Nadiya Mirosh
Gyroscope        professional forex expert   (for EURUSD, GBPUSD, USDJPY, AUDUSD, USDCHF, EURGBP, EURJPY, NZDUSD, USDCAD, EURCHF, AUDJPY, CADJPY pairs)   alyzing the market using the Elliot Wave Index. Elliott wave theory is the interpretation of processes in financial markets through a system of visual models (waves) on price charts. The author of the theory, Ralph Elliott, identified eight variants of alternating waves (of which five are in the trend and three are against the trend). The mov
You can change the time period of the chart at the touch of a button. You can also change multiple charts at the touch of a button. You can also change multiple charts at the touch of a button, saving you the trouble of changing time periods. We are live-streaming the actual operation of the system. https://www.youtube.com/@ganesha_forex We do not guarantee your investment results. Investments should be made at your own risk. We sharll not be liable for any disadvantage or damage caused by th
Auto AndrewFork
Noor Ghani Rahman
1 (1)
Auto Pitchfork Indicator The indicator calculate the Pitch fork for the previous Day (Selectable) with multiple Support and Resistance lines from the Median price which acts as Magnet for the Price that if price touch the above warning (1) or below warning (1) lines and not cross up or down then there is maximum possibilities that it will return to the Median Line, and thus maintain the Price Action in Cyclic Pattern to the Market Move. You are able to select how many warning lines you want to k
Forex Gump
Andrey Kozak
2.4 (5)
Forex Gump is a fully finished semi-automatic trading system. In the form of arrows, signals are displayed on the screen for opening and closing deals. All you need is to follow the instructions of the indicator. When the indicator shows a blue arrow, you need to open a buy order. When the indicator shows a red arrow, you need to open a sell order. Close orders when the indicator draws a yellow cross. In order to get the most effective result, we recommend using the timeframes H1, H4, D1. There
VR Cub
Vladimir Pastushak
VR Cub , yüksek kaliteli giriş noktaları elde etmenin bir göstergesidir. Gösterge, matematiksel hesaplamaları kolaylaştırmak ve bir pozisyona giriş noktalarının aranmasını basitleştirmek için geliştirildi. Göstergenin yazıldığı ticaret stratejisi uzun yıllardan beri etkinliğini kanıtlamaktadır. Ticaret stratejisinin basitliği, acemi yatırımcıların bile başarılı bir şekilde ticaret yapmasına olanak tanıyan büyük avantajıdır. VR Cub, pozisyon açılış noktalarını ve Kâr Al ve Zararı Durdur hedef sev
MACD Color for GOLD
Chitipat Changsamrit
MACD Color for GOLD  Use for looking moving-way of graph and checking will be buy or sell  Easy for looking by see the color of trand. Red is down / Blue is up.  Can to use it with every time-frame by 1. Long Trade : Use it with time-frame H1 /  H4 /  Daily  2.Short Trade : Use it with  time-frame  M5 / M15  / M 30 /  H1 and you can see when you will open or close the orders by see this indicator by well by see signal line cut with color line again in opposite. and you can use this indicator for
Bu ürünün alıcıları ayrıca şunları da satın alıyor
Gann Made Easy
Oleg Rodin
4.83 (162)
Gann Made Easy , bay teorisini kullanarak ticaretin en iyi ilkelerine dayanan, profesyonel ve kullanımı kolay bir Forex ticaret sistemidir. WD Gann. Gösterge, Zararı Durdur ve Kâr Al Seviyeleri dahil olmak üzere doğru SATIN AL ve SAT sinyalleri sağlar. PUSH bildirimlerini kullanarak hareket halindeyken bile işlem yapabilirsiniz. Satın alma işleminden sonra, alım satım talimatlarını ve harika ek göstergeleri ücretsiz olarak almak için lütfen benimle iletişime geçin! Muhtemelen Gann ticaret yöntem
Auto Optimized Parabolic RSI: Gelişmiş 3D Momentum Motoru Çoğu perakende indikatörü, piyasa volatilitesi değiştiği an çöken statik girdilere dayandığı için başarısız olur. Auto Optimized Parabolic RSI, kendi matematiksel avantajını sürekli olarak yeniden hesaplayarak "indikatör körelmesi" (indicator decay) sorununu çözer ve kurumsal düzeyde kantitatif adaptasyonu doğrudan MT5 terminalinize getirir. Temel Avantaj: Özel Bellek İçi (In-Memory) 3D Optimizasyon   Standart otomatik optimize ediciler,
PZ Harmonacci Patterns
PZ TRADING SLU
3.17 (6)
Trade smarter, not harder: Empower your trading with Harmonacci Patterns This is arguably the most complete harmonic price formation auto-recognition indicator you can find for the MetaTrader Platform. It detects 19 different patterns, takes fibonacci projections as seriously as you do, displays the Potential Reversal Zone (PRZ) and finds suitable stop-loss and take-profit levels. [ Installation Guide | Update Guide | Troubleshooting | FAQ | All Products  ] It detects 19 different harmonic pric
Scalper Inside PRO
Alexey Minkov
4.74 (69)
Scalper Inside PRO – Since 2020. An exclusive indicator that utilizes an innovative algorithm to swiftly and accurately determine the market trend. The indicator automatically calculates opening, closing, and profit levels, providing detailed trading statistics. With these features, you can choose the most appropriate trading instrument for the current market conditions. Additionally, you can easily integrate your own arrow indicators into Scalper Inside Pro to quickly evaluate their statistics
PRO Renko Sistemi, RENKO grafikleri ticareti için özel olarak tasarlanmış son derece hassas bir ticaret sistemidir. Bu, çeşitli ticaret araçlarına uygulanabilen evrensel bir sistemdir. Sistemi etkin piyasa sana doğru ters sinyallerine erişim hakkı denilen ses nötralize eder. Göstergenin kullanımı çok kolaydır ve sinyal üretiminden sorumlu tek bir parametreye sahiptir. Aracı, seçtiğiniz herhangi bir ticaret aracına ve renko çubuğunun boyutuna kolayca uyarlayabilirsiniz. Yazılımımla karlı bir
Quantum Breakout Indicator PRO
Bogdan Ion Puscasu
4.96 (26)
Tanıtım       Quantum Breakout PRO   , Breakout Bölgeleri ile ticaret yapma şeklinizi değiştiren çığır açan MQL5 Göstergesi! 13 yılı aşkın ticaret deneyimine sahip deneyimli tüccarlardan oluşan bir ekip tarafından geliştirilen   Quantum Breakout PRO   , yenilikçi ve dinamik koparma bölgesi stratejisiyle ticaret yolculuğunuzu yeni zirvelere taşımak için tasarlanmıştır. Kuantum Breakout Göstergesi, size 5 kar hedefi bölgesi ile kırılma bölgelerinde sinyal okları ve kırılma kutusuna dayalı olara
The Propfolio Master Suite is the ultimate all-in-one analytical workstation for professional traders. Combining the power of the Beat The Market Maker (BTMM) methodology, Smart Money Concepts (SND/Liquidity), and Advanced Volume Profile, this suite replaces multiple different indicators with one optimized engine. Monitor up to 14 pairs simultaneously from a single chart, instantly identify market cycles, and seamlessly map institutional footprints with the click of a button. The Command Center
Bu indikatörü satın alırsanız, Profesyonel Trade Manager’ımı  + EA   ÜCRETSİZ olarak alacaksınız. Öncelikle, bu Ticaret Sistemi'nin Non-Repainting, Non-Redrawing ve Non-Lagging Göstergesi olduğunu vurgulamak önemlidir, bu da hem manuel hem de robot ticareti için ideal hale getirir. Online kurs, kılavuz ve ön ayarları indir. "Smart Trend Trading System MT5", yeni ve deneyimli tüccarlar için özelleştirilmiş kapsamlı bir ticaret çözümüdür. 10'dan fazla premium göstergeyi birleştiriyor ve 7'den faz
Please send me Direct message on MQL5 CHAT after purchasing the Indicator for Training and Installation Support There are some additional files that is important to use with the Indicator . So be sure to contact me after purchasing the Indicator So that I can add you for training and support . If you find any difficulty with installation then send me Direct message here So that I can connect with you via Anydesk or Teamview for the product installation. " Smart Order Block Indicator " to find m
GoldRush Trend Ok Sinyali GoldRush Trend Ok Sinyali göstergesi, XAU/USD'de yüksek hızlı, kısa vadeli scalperlar için özel olarak tasarlanmış hassas, gerçek zamanlı trend analizi sağlar. 1 dakikalık zaman dilimi için özel olarak tasarlanan bu araç, net giriş noktaları için yön okları gösterir ve scalper'ların değişken piyasa koşullarında güvenle hareket etmelerini sağlar. Gösterge, PRIMARY ve SECONDARY uyarı oklarından oluşur. PRIMARY sinyalleri, trend yönündeki değişikliği gösteren Beyaz ve
Market Makers
Mohamed Hassan
5 (4)
After purchase, contact me privately to receive 1 month of free testing with EA Forex Proton! This advanced MT4 trading robot automatically executes signals from any MT4 indicator, including Market Makers. The latest version also includes AI integration, allowing each trade signal to be analyzed using Artificial Intelligence. Live Signal with EA Forex Proton: Click here Market Makers is a powerful price action trading system designed to identify high-probability Buy and Sell opportunities based
PZ Trend Trading
PZ TRADING SLU
4.8 (5)
Capture every opportunity: your go-to indicator for profitable trend trading Trend Trading is an indicator designed to profit as much as possible from trends taking place in the market, by timing pullbacks and breakouts. It finds trading opportunities by analyzing what the price is doing during established trends. [ Installation Guide | Update Guide | Troubleshooting | FAQ | All Products ] Trade financial markets with confidence and efficiency Profit from established trends without getting whips
GOLD Impulse with Alert
Bernhard Schweigert
4.67 (12)
Bu gösterge, 2 ürünümüz Advanced Currency IMPULSE with ALERT  +   Currency Strength Exotics  'in süper bir kombinasyonudur. Tüm zaman dilimleri için çalışır ve 8 ana para birimi artı bir Sembol için grafiksel olarak güç veya zayıflık dürtüsünü gösterir! Bu Gösterge, Altın, Egzotik Çiftler, Emtialar, Endeksler veya Vadeli İşlemler gibi herhangi bir sembol için para birimi gücü ivmesini göstermek için uzmanlaşmıştır. Türünün ilk örneğidir, Altın, Gümüş, Petrol, DAX, US30, MXN, TRY, CNH vb. içi
Market Structure Patterns MT4
Samuel Manoel De Souza
5 (18)
Market Structure Patterns ,   smart money concepts   (akıllı para kavramları) temelinde geliştirilen ve   SMC/ICT   öğelerini grafik üzerinde gösteren bir göstergedir. Bu öğeler, işlem kararlarınızı bir üst seviyeye taşımanıza yardımcı olur. Grafikte bir unsur oluştuğunda, fiyat bir seviyeyi geçtiğinde veya bir kutu/bölgeye girdiğinde,   uyarılar ,   bildirimler   ve   e-posta mesajları   aracılığıyla anında bilgilendirilirsiniz. Geliştiriciler,   global variables   (küresel değişkenler) aracılı
Advanced Supply Demand
Bernhard Schweigert
4.91 (300)
Özel Ticaret –%40 İndirim Yeni Başlayanlar veya Uzman Yatırımcılar İçin En İyi Çözüm! Bu gösterge, bir dizi özel özellik ve yeni bir formül içerdiği için benzersiz, yüksek kaliteli ve uygun fiyatlı bir işlem aracıdır. Bu güncelleme ile çift zaman dilimi bölgeleri gösterebileceksiniz. Sadece daha yüksek bir zaman dilimini değil, hem grafik zaman dilimini hem de daha yüksek zaman dilimini gösterebileceksiniz: İÇ İÇE GEÇMİŞ BÖLGELER GÖSTERİYOR. Tüm Arz Talep yatırımcıları buna bayılacak. :) Önem
Identify key turning points with reliable fractal analysis This indicator examines the price structure of fractals of different periods to determine possible reversal points in the market, providing timing to positional traders that already have a fundamental or technical valuation model. Unlike its younger brother, Reversal Fractals , this indicator won't miss reversals because of the period selected, and will find reversal fractals on a zig-zag fashion, ignoring those reversals which do not
PZ Support Resistance
PZ TRADING SLU
3.33 (3)
Unlock key market insights with automated support and resistance lines Tired of plotting support and resistance lines? This is a multi-timeframe indicator that detects and plots supports and resistance lines in the chart with the same precision as a human eye would. As price levels are tested over time and its importance increases, the lines become thicker and darker, making price leves easy to glance and evaluate. [ Installation Guide | Update Guide | Troubleshooting | FAQ | All Products ] Boos
" Dynamic Scalper System " göstergesi, trend dalgaları içinde işlem yapmak için scalping yöntemi için tasarlanmıştır. Başlıca döviz çiftleri ve altın üzerinde test edilmiştir, diğer işlem araçlarıyla uyumluluğu mümkündür. Ek fiyat hareketi desteğiyle trend boyunca pozisyonların kısa vadeli açılması için sinyaller sağlar. Göstergenin prensibi. Büyük oklar trend yönünü belirler. Küçük oklar şeklinde scalping için sinyaller üreten bir algoritma trend dalgaları içinde çalışır. Kırmızı oklar yüksel
They say history repeats itself. What if you could prove it in real-time? The Propfolio Ghost Pattern is an advanced algorithmic pattern-matching engine. It empowers you to select any current price action structure on your chart and instantly scan thousands of historical candles to find the exact moment in the past where the market did the exact same thing. Once it finds the highest probability match, it projects the historical outcome into the future as "Ghost Candles"—giving you a highly calcu
Atomic Analyst
Issam Kassas
5 (5)
Öncelikle belirtmek gerekir ki bu Ticaret Göstergesi Yeniden Çizim Yapmaz, Gecikmez ve Gecikme Göstermez, bu da hem manuel hem de robot ticareti için ideal hale getirir. Kullanıcı kılavuzu: ayarlar, girişler ve strateji. Atom Analisti, Piyasada Daha İyi Bir Avantaj Bulmak İçin Fiyatın Gücünü ve Momentumunu Kullanan PA Fiyat Hareketi Göstergesidir. Gürültüleri ve Yanlış Sinyalleri Kaldırmaya ve Ticaret Potansiyelini Artırmaya Yardımcı Olan Gelişmiş Filtrelerle Donatılmıştır. Birden fazla katman
ŞU ANDA %26 INDIRIMLI !!! Bu gösterge, her iki ana göstergemizin ( Advanced Currency Strength 28  &   Advanced Currency IMPULSE with ALERT )  süper bir kombinasyonudur. TICK-UNITS için Para Birimi Gücü değerlerini ve 28 Forex çifti için uyarı sinyallerini gösterir. 11 farklı Tick-Unit kullanılabilir. Bunlar 1, 2, 3, 4, 5, 6, 10, 12, 15, 20 ve 30 Saniyedir. Alt penceredeki Tick-Unit çubuğu, saniyenin zamanlayıcısı içinde en az 1 tik olduğunda gösterilecek ve sola kaydırılacaktır.  Yalnızca BİR
KURAMA GOLD SIGNAL PRO (MT4) — 7 Katmanlı Filtre, Otomatik TP/SL ve Kalite Puanı ile Komple XAUUSD Trading Sistemi REPAINT YOK. YENİDEN ÇİZİM YOK. GECİKME YOK. Her sinyal kalıcıdır. Gördüğün, aldığındır. BONUS: Ömür boyu lisansı al ve AI Zone Radar ($59 değerinde) + tam PDF kılavuzunu ÜCRETSİZ al. Satın aldıktan sonra bana mesaj gönder. AI Zone Radar: https://www.mql5.com/en/market/product/175834 TRADERLAR GÜVENİYOR: Aktif bir Altın trader topluluğu tarafından zaten kullanılıyor. Hassasiyet
Bu göstergeye dayalı bonus EA'yı almak için satın aldıktan sonra benimle iletişime geçin. Self Optimizing Double MA Strategy, parametre tahminlerini ortadan kaldırmak için tasarlanmış profesyonel düzeyde bir ticaret aracıdır. Yerleşik bir otomatik optimizasyon motoruyla desteklenen bu sistem, istatistiksel bir avantajı korumak için arka planda binlerce parametre kombinasyonunu simüle ederek değişen piyasa koşullarına sürekli olarak uyum sağlar. Statik ve güncelliğini yitirmiş ayarlara güvenmek
ŞU ANDA %40INDIRIMLI Yeni Başlayanlar veya Uzman Tüccarlar için En İyi Çözüm! Bu Gösterge benzersiz, yüksek kaliteli ve uygun fiyatlı bir ticaret aracıdır çünkü bir dizi tescilli özellik ve yeni bir formül ekledik. Sadece BİR grafik ile 28 Forex çifti için Döviz Gücünü okuyabilirsiniz! Yeni bir trendin veya scalping fırsatının tam tetik noktasını belirleyebildiğiniz için ticaretinizin nasıl gelişeceğini hayal edin? Kullanım kılavuzu: buraya tıklayın Bu ilk olan, orijinal! Değersiz bir özent
Grafikleri yapılandıran ve döngüsel fiyat hareketlerini belirleyen teknik bir gösterge. Herhangi bir grafik üzerinde çalışabilirim. Birkaç çeşit bildirim var. Grafiğin kendisinde ek oklar var. Tarihe yeniden bakmadan, mumun kapanışına dair çalışmalar. M5 ve üzeri TF önerilir. Kullanımı ve yapılandırması kolay parametreler. Farklı parametrelere sahip 2 indikatörü kullanırken, bunları diğer indikatörler olmadan da kullanabilirsiniz. 2 giriş parametresi vardır Döngüsellik ve Sinyal Süresi Bu 2 pa
KuKl
IGOR KIRIANEN
The indicator is built on a non-standard Zig Zag, it draws accumulations after which if the price leaves this zone and a test of this zone occurs, then a sound signal is given and an arrow appears - after the test candle closes.The indicator does not redraw its signals, it is very easy to use, there are only three settings 1- this is the zig zag parameter 2- this is the minimum price exit from the zone 3- this is the maximum price exit from the zone. The lower the parameter for Zig Zag, the more
Trend Screener
STE S.S.COMPANY
4.79 (95)
Trend Göstergesi, Trend Alım Satım ve Filtreleme için Çığır Açan Benzersiz Çözüm, Tüm Önemli Trend Özellikleriyle Tek Bir Araç İçinde Yerleştirildi! Forex, emtialar, kripto para birimleri, endeksler ve hisse senetleri gibi tüm sembollerde/araçlarda kullanılabilen %100 yeniden boyamayan çoklu zaman çerçevesi ve Çoklu para birimi göstergesidir. SINIRLI SÜRELİ TEKLİF: Destek ve Direnç Tarama Göstergesi sadece 65$ ve ömür boyu mevcuttur. (Orijinal fiyat 250$) (teklif uzatıldı) Trend Screener, grafik
Advanced UT BOT ALERTS for MT4 Profesyonel Çok Katmanlı Trend Tespit Sistemi | Geliştirilmiş UT BOT Motoru Yalnızca yüksek kaliteli göstergeler sunuyoruz. Advanced UT BOT , profesyonel kullanım için tasarlanmıştır. Kararlı sinyal mantığı ve güvenli hesaplama yapısı sayesinde gecikme veya hatalı güncelleme olmaz. Geçmiş sinyalleri yeniden çizmez, değiştirmez veya silmez. Tüm BUY ve SELL sinyalleri mum kapanışı gerçekleştikten sonra oluşturulur ve sabitlenir. Canlı işlem sırasında repaint yoktur
Delta Fusion Pro
Francesco Secchi
5 (2)
Delta Fusion Pro – Gün İçi İşlem için Gelişmiş Emir Akışı Analizi Delta Fusion Pro, MetaTrader 4 için profesyonel bir göstergedir. Agresif emir akışını ortaya çıkarır ve kurumsal baskının yoğunluğunu ve yönünü gerçek zamanlı olarak gösterir. Geleneksel hacim göstergelerinden farklı olarak, Ask ve Bid hacimleri arasındaki delta farkını analiz eder; dönüşleri önceden tahmin eder, trendleri doğrular ve profesyonel ilgi alanlarını belirler. Ana Özellikler Akıllı Otomatik Ayar Sistemi Tüm parametr
ŞU ANDA %40 INDIRIMLI !!! Yeni Başlayanlar veya Uzman Tüccarlar için En İyi Çözüm! Bu gösterge benzersiz, yüksek kaliteli ve uygun fiyatlı bir ticaret aracıdır çünkü bir dizi tescilli özellik ve gizli bir formül ekledik. Yalnızca BİR grafikle 28 döviz çiftinin tümü için Uyarılar verir. Yeni bir trendin veya scalping fırsatının tam tetik noktasını belirleyebildiğiniz için ticaretinizin nasıl gelişeceğini hayal edin! Yeni temel algoritmalar üzerine inşa edilen bu sistem, potansiyel işlemlerin
Yazarın diğer ürünleri
Introduction to X3 Chart Pattern Scanner X3 Cherart Pattern Scanner is the non-repainting and non-lagging indicator detecting X3 chart patterns including Harmonic pattern, Elliott Wave pattern, X3 patterns, and Japanese Candlestick patterns. Historical patterns match with signal patterns. Hence, you can readily develop the solid trading strategy in your chart. More importantly, this superb pattern scanner can detect the optimal pattern of its kind. In addition, you can switch on and off individu
Peak Trough Analysis is the great tool to detect peaks and troughs in your chart. Peak Trough Analysis tool can use three different peaks and troughs detection algorithm. The three algorithm include the orignal Fractals Indicator by Bill Williams, the Modified Fractals indicator and ZigZag indicator. You can use this peak and trough analysis tool to detect the price pattern made up from Equilibrium Fractal-Wave process. For further usage, there are good guide line on how to use this peak trough
FREE
Introduction Harmonic Patterns are best used to predict potential turning point. Traditionally, Harmonic Pattern was identified manually connecting peaks and troughs points in the chart. Manual harmonic pattern detection is painfully tedious and not suitable for everyone. You are often exposed under subjective pattern identification with manual pattern detection. To avoid these limitations, Harmonic Pattern Plus was designed to automate your harmonic pattern detection process. The functionality
Elliott Wave Trend was designed for the scientific wave counting. This tool focuses to get rid of the vagueness of the classic Elliott Wave Counting using the guideline from the template and pattern approach. In doing so, firstly Elliott Wave Trend offers the template for your wave counting. Secondly, it offers Wave Structural Score to assist to identify accurate wave formation. It offers both impulse wave Structural Score and corrective wave Structure Score. Structural Score is the rating to sh
Mean Reversion Supply Demand Indicator Mean Reversion Supply Demand is the indicator to detect the important supply demand zone in your chart. The concept of supply demand trading relies on the quantity mismatching between buying and selling volumes in the financial market. Typically, supply demand zone serves to predict the turning point. The wave pattern, for any supply demand zone to work as an successful trade, looks like the price must touch the base zone, move away and then return to zone
Introduction to EFW Analytics EFW Analytics was designed to accomplish the statement "We trade because there are regularities in the financial market". EFW Analytics is a set of tools designed to maximize your trading performance by capturing the repeating fractal geometry, known as the fifth regularity in the financial market. The functionality of EFW Analytics consists of three parts. Firstly, Equilibrium Fractal Wave Index is an exploratory tool to support your trading logic to choose which r
Introduction This indicator detects volume spread patterns for buy and sell opportunity. The patterns include demand and supply patterns. You might use each pattern for trading. However, these patterns are best used to detect the demand zone (=accumulation area) and supply zone (=distribution area). Demand pattern indicates generally potential buying opportunity. Supply pattern indicates generally potential selling opportunity. These are the underlying patterns rather than direct price action. T
FREE
Introduction to Fractal Pattern Scanner Fractal Indicator refers to the technical indicator that makes use of the fractal geometry found in the financial market. Fractal Pattern Scanner is the advanced Fractal Indicator that brings the latest trading technology after the extensive research and development work in the fractal geometry in the financial market. The most important feature in Fractal Pattern Scanner is the ability to measure the turning point probability as well as the trend probabi
Introduction Harmonic Patterns are best used to predict potential turning point. Traditionally, Harmonic Pattern was identified manually connecting peaks and troughs points in the chart. Manual harmonic pattern detection is painfully tedious and not suitable for everyone. You are often exposed under subjective pattern identification with manual pattern detection. To avoid these limitations, Harmonic Pattern Plus was designed to automate your harmonic pattern detection process. The functionality
Introduction Auto Chart Alert is a convenient tool to set alert for your trading in your chart. With Auto Chart Alert, you can set the alert line in one click in your desired location in your chart. You can even set alert over the sloped lines in your chart. Auto Chart Alert is a great tool when you have to watch out importnat support and resistance levels for your trading. You can receive the sound alert, email and push notification when the price hit the alert line at you desired location. Au
FREE
Introduction To Time Box Indicator Time Box Indicator is a must have indicator for any trader. It will display daily, weekly and Monthly box according to your preferences. Yet, you can extend any important price levels in your chart automatically. You can use them as the significant support and resistance levels. It is very simple but effective tool for your trading. Graphic Setting Use White Chart Line Style for Current Open price Daily Setting Update Timeframe for daily box Number of days to
FREE
Introduction to Fractal Moving Average Fractal Moving Average indicator was designed as part of Fractal Pattern Scanner. Inside Fractal Pattern Scanner, Fractal Moving Average Indicator was implemented as multiple of chart objects. With over thousands of chart object, we find that it was not the best and efficient ways to operate the indicator. It was computationally too heavy for the indicator. Hence, we decide to implement the indicator version of Fractal Moving Average indicator to benefit ou
FREE
Introduction to Fractal Moving Average Fractal Moving Average indicator was designed as part of Fractal Pattern Scanner. Inside Fractal Pattern Scanner, Fractal Moving Average Indicator was implemented as multiple of chart objects. With over thousands of chart object, we find that it was not the best and efficient ways to operate the indicator. It was computationally too heavy for the indicator. Hence, we decide to implement the indicator version of Fractal Moving Average indicator to benefit o
FREE
Introduction This indicator detects volume spread patterns for buy and sell opportunity. The patterns include demand and supply patterns. You might use each pattern for trading. However, these patterns are best used to detect the demand zone (=accumulation area) and supply zone (=distribution area). Demand pattern indicates generally potential buying opportunity. Supply pattern indicates generally potential selling opportunity. These are the underlying patterns rather than direct price action. T
FREE
Peak Trough Analysis is the great tool to detect peaks and troughs in your chart. Peak Trough Analysis tool can use three different peaks and troughs detection algorithm. The three algorithm include the orignal Fractals Indicator by Bill Williams, the Modified Fractals indicator and ZigZag indicator. You can use this peak and trough analysis tool to detect the price pattern made up from Equilibrium Fractal-Wave process. For further usage, there are good guide line on how to use this peak trough
FREE
Introduction to Harmonic Pattern Scenario Planner The present state of Forex market can go through many different possible price paths to reach its future destination. Future is dynamic. Therefore, planning your trade with possible future scenario is an important step for your success. To meet such a powerful concept, we introduce the Harmonic Pattern Scenario Planner, the first predictive Harmonic Pattern Tool in the world among its kind. Main Features Predicting future patterns for scenario
Introduction to Fibonacci Volatility Indicator Volatility indicator can help you to detect any statistical advantage for your trading. Especially, if you are trading with Price Action and Price Patterns, then we recommend to use the Volatility indicator together with your strategy. Especically, Fibonacci Volatility indicator combines the market volatiltiy with Fibonacci Analysis to provide you more advanced volatiltiy indicator. Main Features Fibonacci Volatility in Z score Configuration Mode Fi
Introduction Excessive Momentum Indicator is the momentum indicator to measure the excessive momentum directly from raw price series. Hence, this is an extended price action and pattern trading. Excessive Momentum Indicator was originally developed by Young Ho Seo. This indicator demonstrates the concept of Equilibrium Fractal Wave and Practical Application at the same time. Excessive Momentum detects the market anomaly. Excessive momentum will give us a lot of clue about potential reversal and
Introduction to GARCH Indicator GARCH is the short initial for Generalized Autoregressive Conditional Heteroskedasticity and it is the volatility prediction model commonly used in financial industry. GARCH model was first appeared in the work by Danish Economist, Tim Peter Bollerslev in 1986. The 2003 Nobel Prize winner, Robert F Engle also added much contribution for the refinement of GARCH model with Tim’s work. Our GARCH INM predictor took the original method of Nelder Mead for GARCH model bu
FREE
Introduction to Order Risk Management EA ORM EA is specially designed for fast and accurate market order execution to be used with our Price Action and Econometric Trading strategies listed below. ORM EA is fully automatic and ORM EA is also very easy to use. ORM EA is totally free of charge. You can also use this robust order execution feature of this ORM EA for any other your own trading strategy. Trading Strategy Guide Order Risk Management EA provides the guide for the risk management for y
FREE
Introduction To Time Box Indicator Time Box Indicator is a must have indicator for any trader. It will display daily, weekly and Monthly box according to your preferences. Yet, you can extend any important price levels in your chart automatically. You can use them as the significant support and resistance levels. It is very simple but effective tool for your trading. Graphic Setting Use White Chart Line Style for Current Open price Daily Setting Update Timeframe for daily box Number of days to
FREE
Introduction to Order Risk Management EA ORM EA is specially designed for fast and accurate market order execution to be used with our Price Action and Econometric Trading strategies listed below. ORM EA is fully automatic and ORM EA is also very easy to use. ORM EA is totally free of charge. You can also use this robust order execution feature of this ORM EA for any other your own trading strategy. Trading Strategy Guide Order Risk Management EA provides the guide for the risk management for y
FREE
Introduction Auto Chart Alert is a convenient tool to set alert for your trading in your chart. With Auto Chart Alert, you can set the alert line in one click in your desired location in your chart. You can even set alert over the sloped lines in your chart. Auto Chart Alert is a great tool when you have to watch out importnat support and resistance levels for your trading. You can receive the sound alert, email and push notification when the price hit the alert line at you desired location. Au
FREE
Introduction to GARCH Indicator GARCH is the short initial for Generalized Autoregressive Conditional Heteroskedasticity and it is the volatility prediction model commonly used in financial industry. GARCH model was first appeared in the work by Danish Economist, Tim Peter Bollerslev in 1986. The 2003 Nobel Prize winner, Robert F Engle also added much contribution for the refinement of GARCH model with Tim’s work. Our GARCH INM predictor took the original method of Nelder Mead for GARCH model bu
FREE
How to use Pair Trading Station Pair Trading Station is recommended for H1 time frame and you can use it for any currency pairs. To generate buy and sell signal, follow few steps below to apply Pair Trading Station to your MetaTrader terminal. When you load Pair Trading Station on your chart, Pair Trading station will assess available historical data in your MetaTrader platforms for each currency pair. On your chart, the amount of historical data available will be displayed for each currency pai
Price Breakout pattern Scanner is the automatic scanner for traders and investors. It can detect following patterns automatically from your chart. Head and Shoulder - Common tradable pattern. Reverse Head and Shoulder - This pattern is the reverse formation of the Head and Shoulder. Double Top - When the price hits resistance level twice and decline toward the support level, the trader can anticipate sudden bearish breakout through the support level. Double Bottom - The double bottom pattern is
Introduction to Sideways Market Analyzer Notable period of Low volatility and non-trending movements in the financial market is considered as Sideways Market. Sooner or later, the low volatility will increase and the price will pick up a trend after Sideways Market. In terms of trading point of view, Sideways Market can serve as the very good entry timing for traders. Sideways Market is also quite often the representation of accumulation of large orders from big investors. Therefore, knowing the
Introduction to Harmonic Pattern Scenario Planner The present state of Forex market can go through many different possible price paths to reach its future destination. Future is dynamic. Therefore, planning your trade with possible future scenario is an important step for your success. To meet such a powerful concept, we introduce the Harmonic Pattern Scenario Planner, the first predictive Harmonic Pattern Tool in the world among its kind. Main Features Predicting future patterns for scenario
Introduction to Smart Renko The main characteristics of Renko Charting concern price movement. To give you some idea on its working principle, Renko chart is constructed by placing a brick over or below when the price make the movement beyond a predefined range, called brick height. Therefore, naturally one can see clear price movement with less noise than other charting type. Renko charting can provide much clearer trend direction and it helps to identify important support and resistance level
Introduction to Support Resistance Indicator Support and Resistance are the important price levels to watch out during intraday market. These price levels are often tested before development of new trend or often stop the existing trend causing trend reversal at this point. Highly precise support and resistance are indispensable for experienced traders. Many typical trading strategies like breakout or trend reversal can be played well around these support and resistance levels. The Precision Sup
Filtrele:
Değerlendirme yok
Değerlendirmeye yanıt