CCI TrendLine Divergency Message
- Göstergeler
- Sürüm: 1.1
- Güncellendi: 20 Kasım 2021
- Etkinleştirmeler: 5

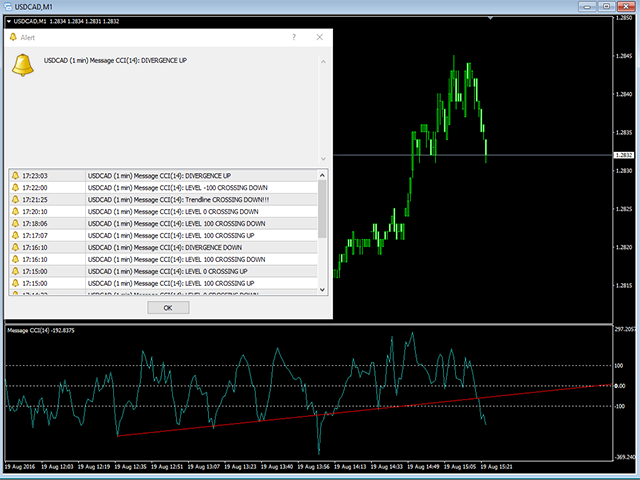
Commodity Channel Index Message is an indicator for the MetaTrader 4 trading platform. Unlike the original indicator, this three in one version has a system of alerts that inform on market situation changes. It consists of the following signals:
- when the Main line crosses the levels of extreme zones and 50% level;
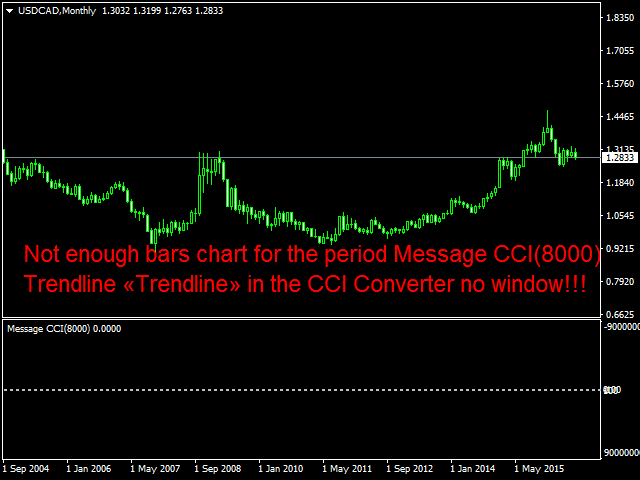
- when the Main line crosses the Trend line in the indicator window;
- Divergence on the last bar.
Values of the middle and extreme levels and divergence zones are customizable.
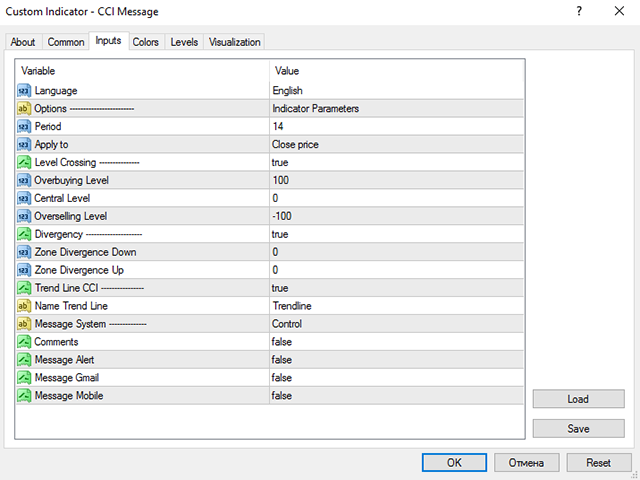
Parameters
- Language – choose language: English or Russian;
- Options – indicator settings: select CCI averaging period by the applied price: close, open, high, low, median, typical, average weighted;
- Level Сrossing – enable/disable alerts when CCI line crosses overbought, oversold and median levels;
- Divergency – enable/disable notifications when the main window price deviates from the indicator window one on the last bar;
- Trend Line CCI – enable/disable alerts when CCI line crosses the trend line in the indicator window. You should plot the tend line and rename Name Trend Line accordingly in the indicator properties;
- Message System – message system.
Signals are displayed as comments in the main chart window, as alerts, push notifications sent to the mobile terminal installed on your mobile device or as email messages. The convenience of the indicator is that it allows you to receive and track signals away from your PC (on your mobile device) so that you can control position opening and closing.
Happy trading!
Thanks for this usefull indicator. A great help in trading.