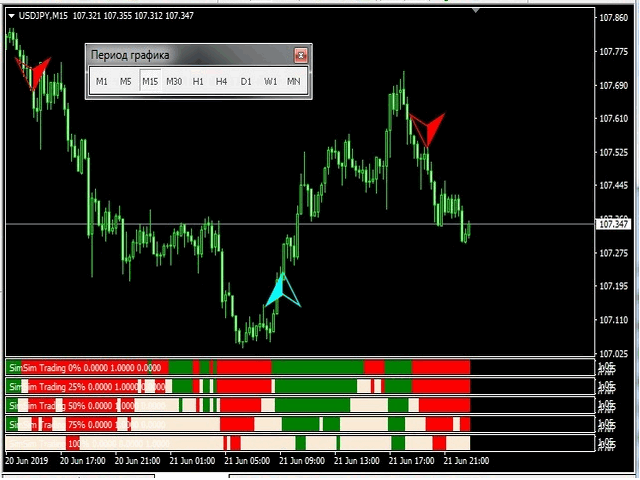
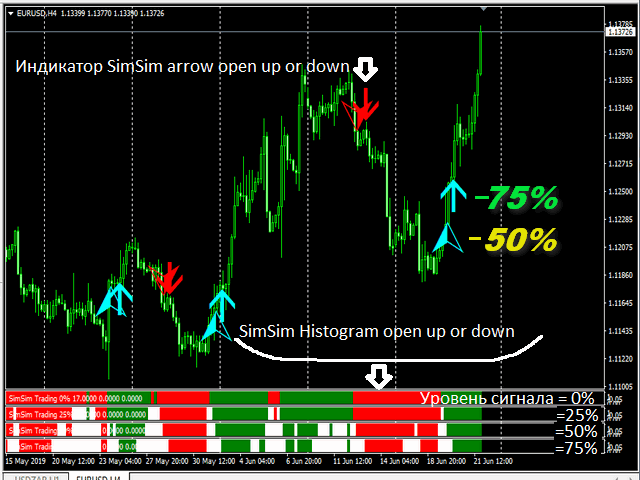
SimSim Histogram open up or down
- Göstergeler
- Sürüm: 2.1
- Güncellendi: 23 Haziran 2020
- Etkinleştirmeler: 9

SimSim Histogram open up or down
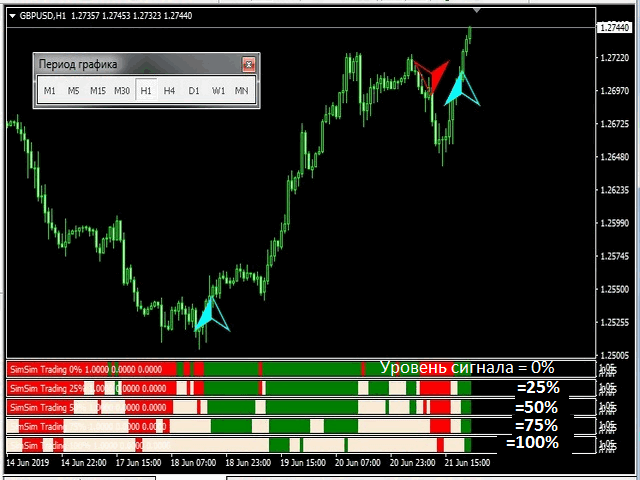
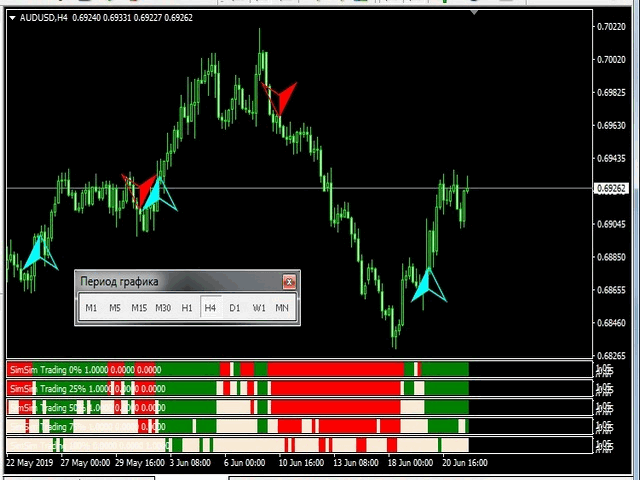
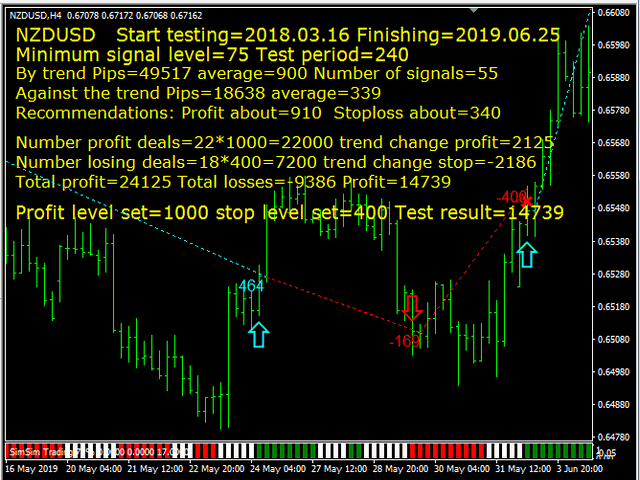
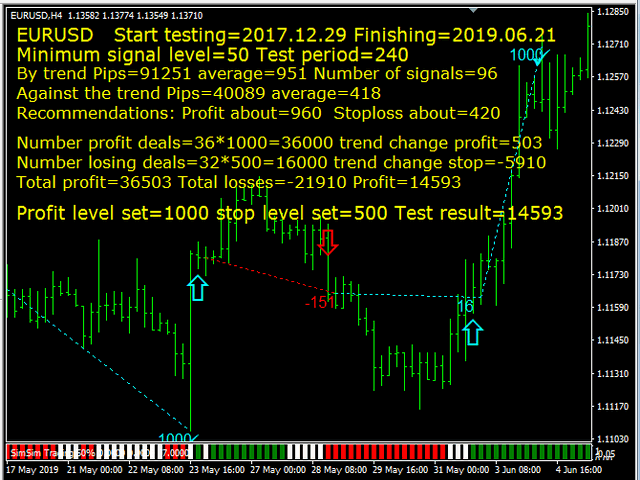
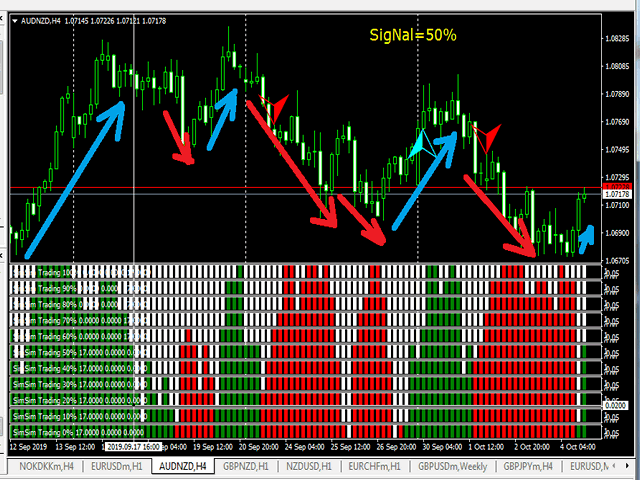
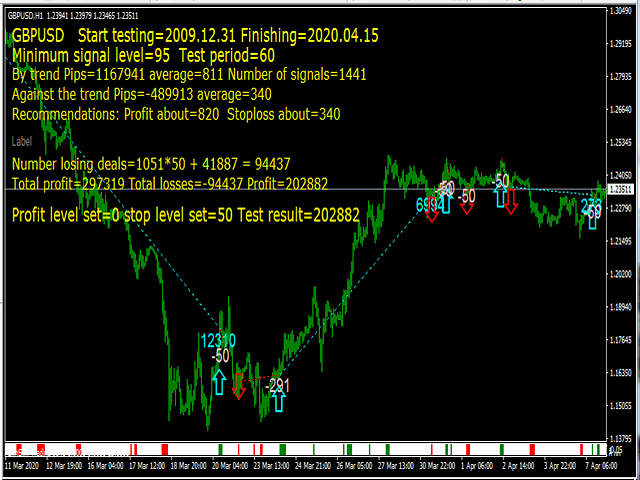
The indicator calculates and summarizes data from 25 standard indicators. What standard indicators to use, the trader determines for himself. As a result of the calculation, we obtain the current signal level, and color the histogram by color: buy, sell or neutral value.
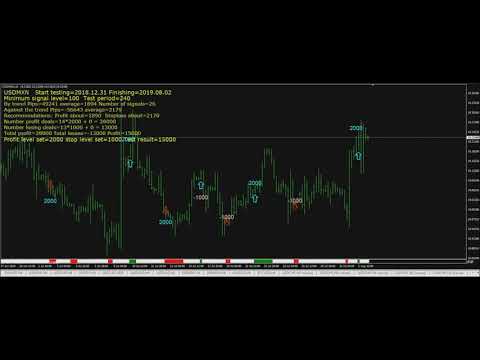
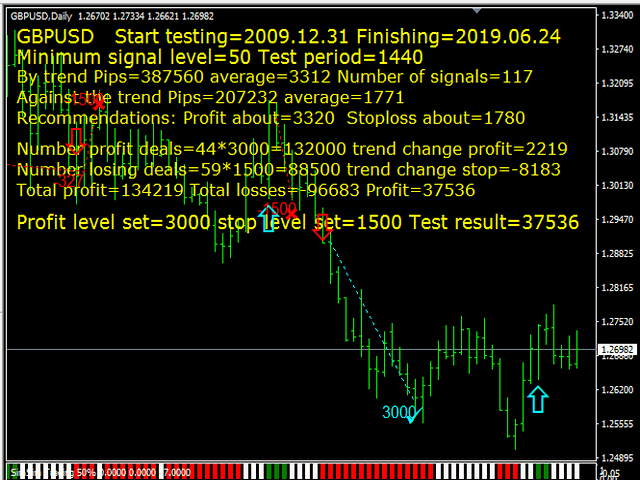
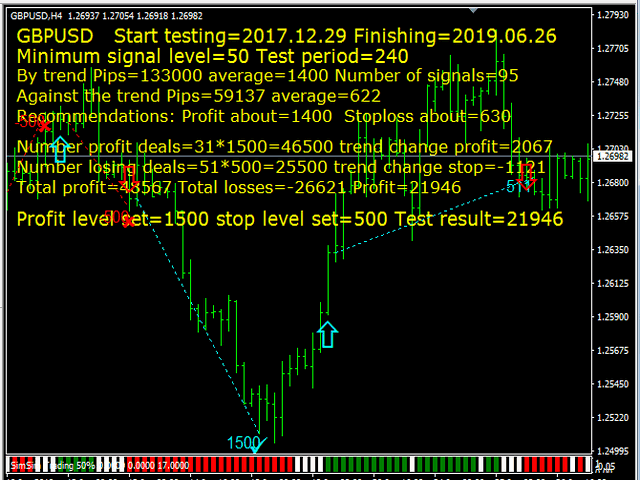
The indicator implements a testing system that can be tested by downloading the demo version.
An indicator can be a good addition to your trading strategy.
FIRST Trial on TRIAL - THEN RENT or PURCHASE !!!
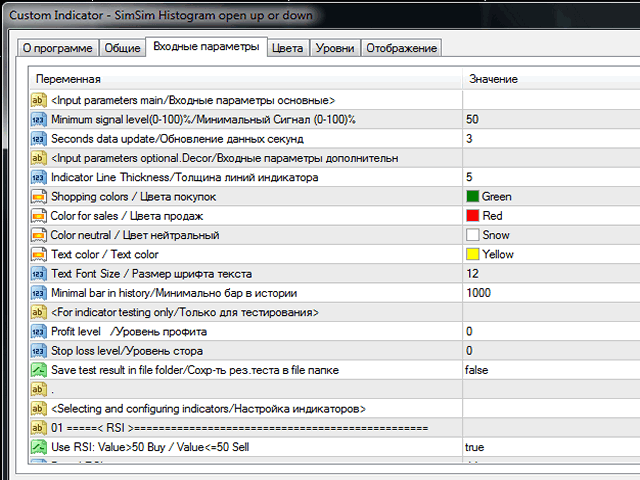
Input parameters
Minimum signal level (0-100)%
Seconds data update
Input parameters optional
Indicator Line Thickness
Shopping colors
Color for sales
Color neutral
Text color
Text Font Size
Minimal bar in history
For indicator testing only
Profit level
Stop loss level
Save test result in file folder
Parameters of standard indicators for calculating the signal. True - participates in the calculation, False - does not participate.
No. 01 Use RSI: Value> 50 Buy / Value <= 50 Sell - If the indicator value is above 50 - the Buy signal, if the Sell signal is lower than or equal to 50.
No. 03 Use CCI: Value> 0 Buy / Value <= 0 Sell - If the indicator value is above 0 - the Buy signal, if the Sell signal is lower or equal to 0.
No. 05 Use ADX: PLUSDI> MINUSID Buy / PLUSDI <= MINUSID Sell - If the indicator line is PLUSDI> MINUSID - Buy signal, if PLUSDI <= MINUSID Sell signal.
. . .
No. 25 Use RVI: Value> 0 Buy / Value <= 0 Sell - If the indicator value is above 0 - the Buy signal, if the Sell signal is lower or equal to 0.