SimSim Line KijunSen Plus MA MT5
- Göstergeler
- Sürüm: 2.0
- Güncellendi: 3 Ağustos 2024
- Etkinleştirmeler: 7

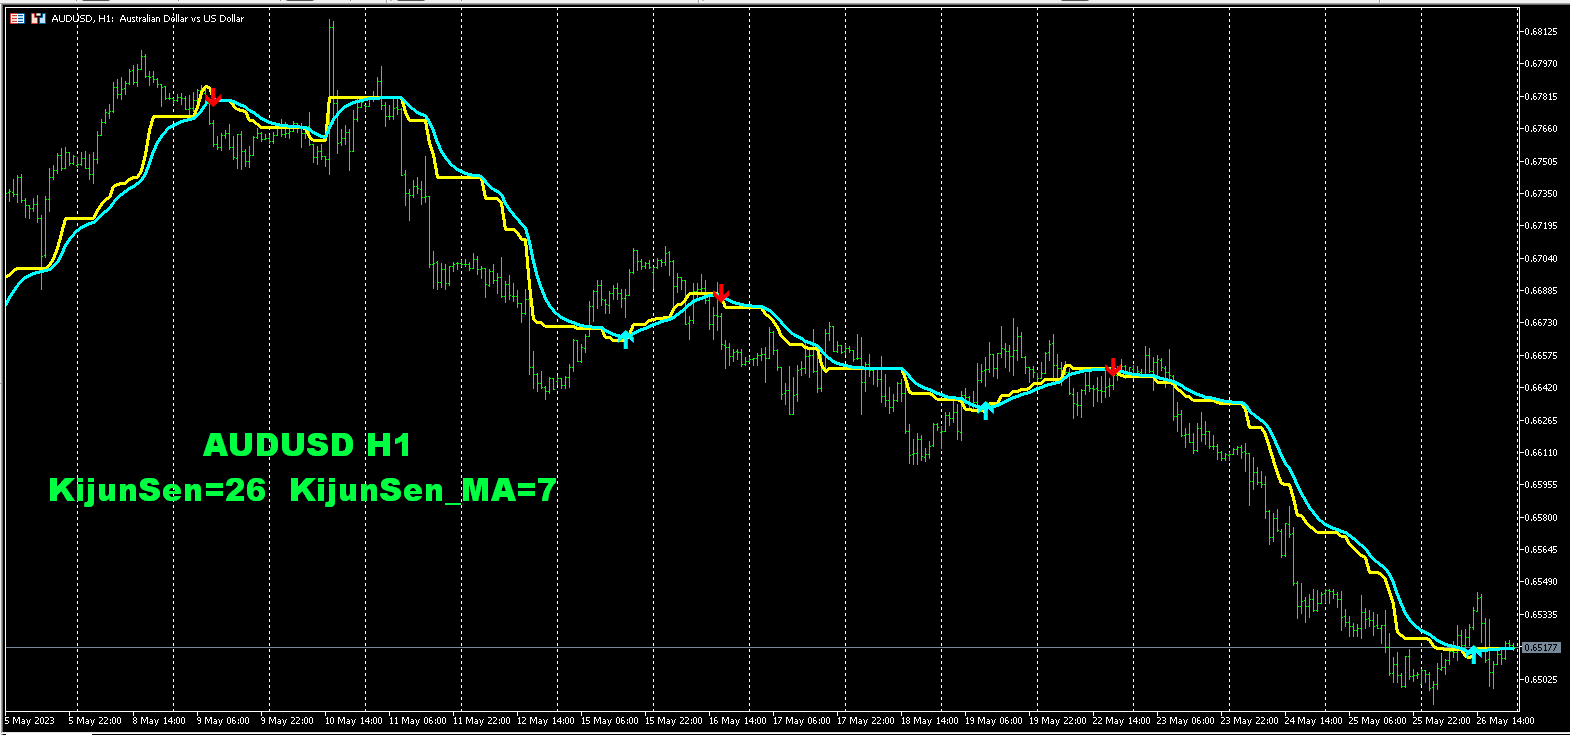
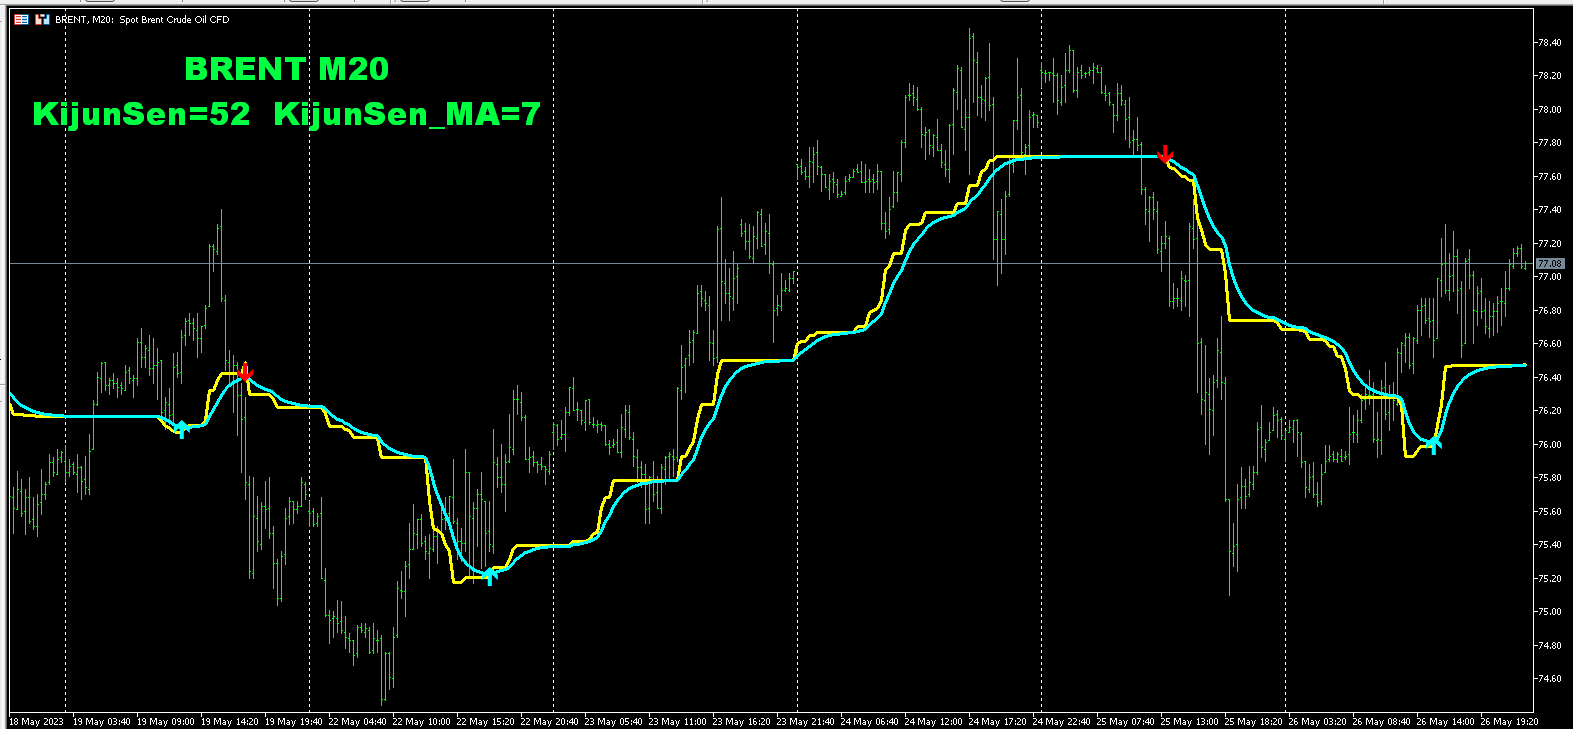
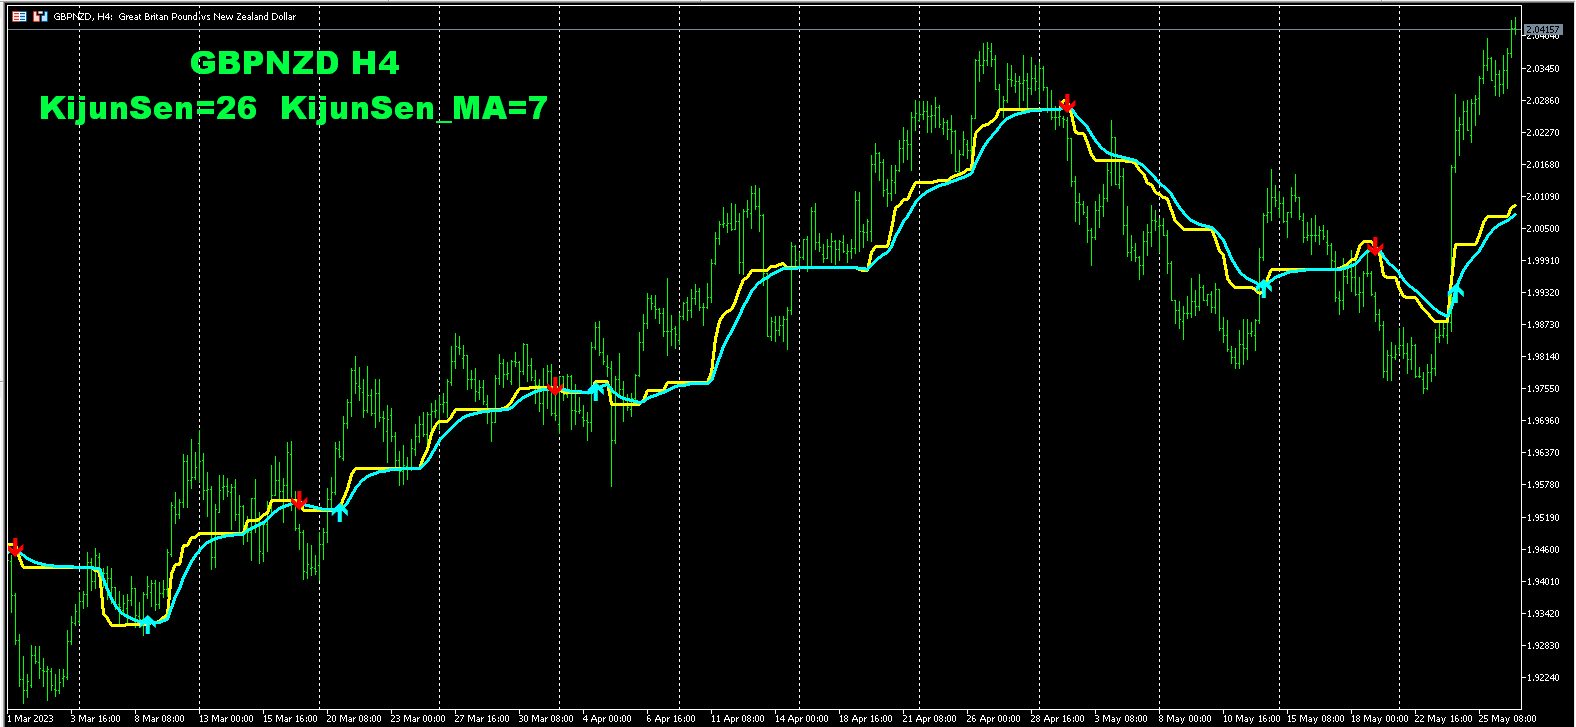
Çok basit ama etkili bir gösterge.
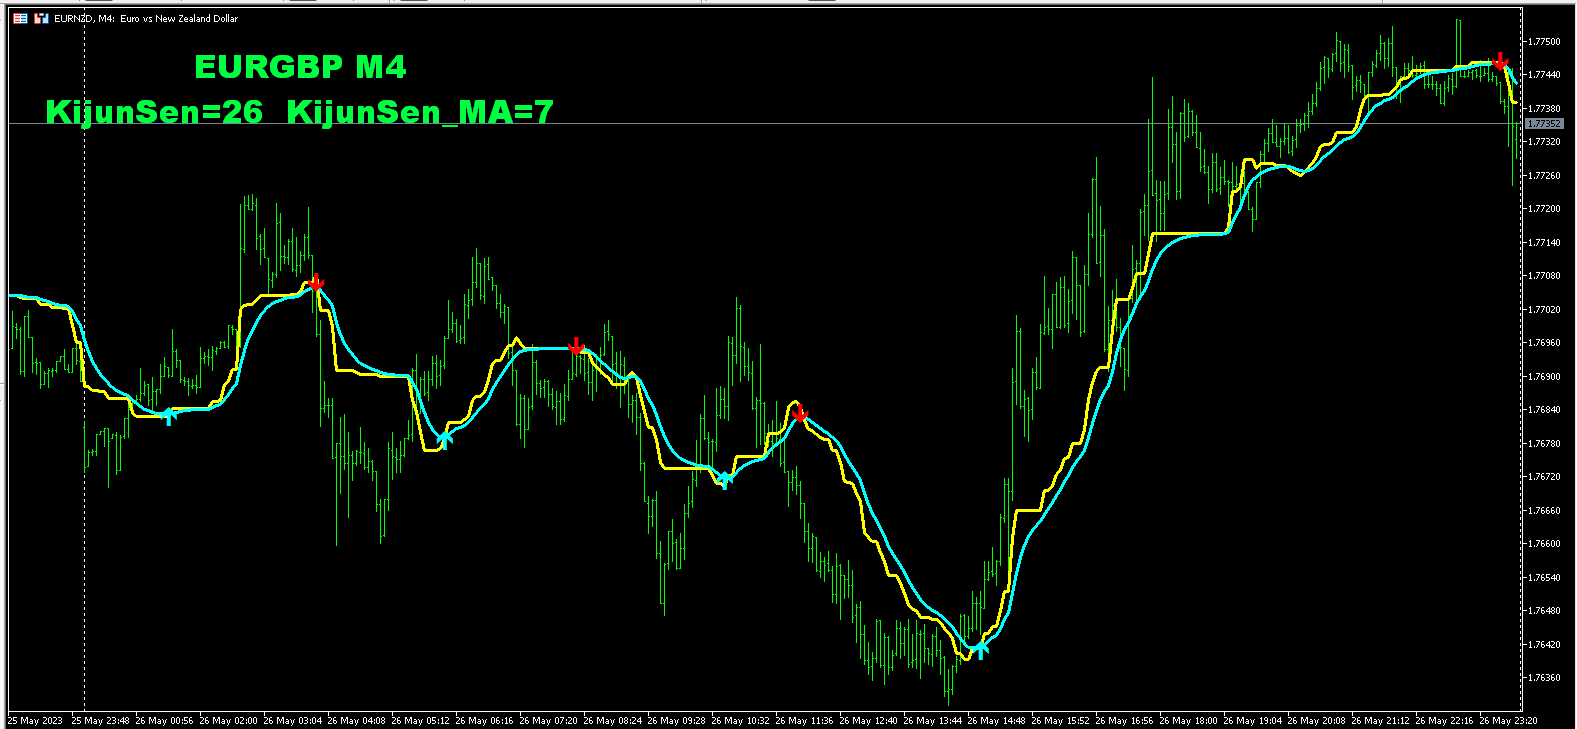
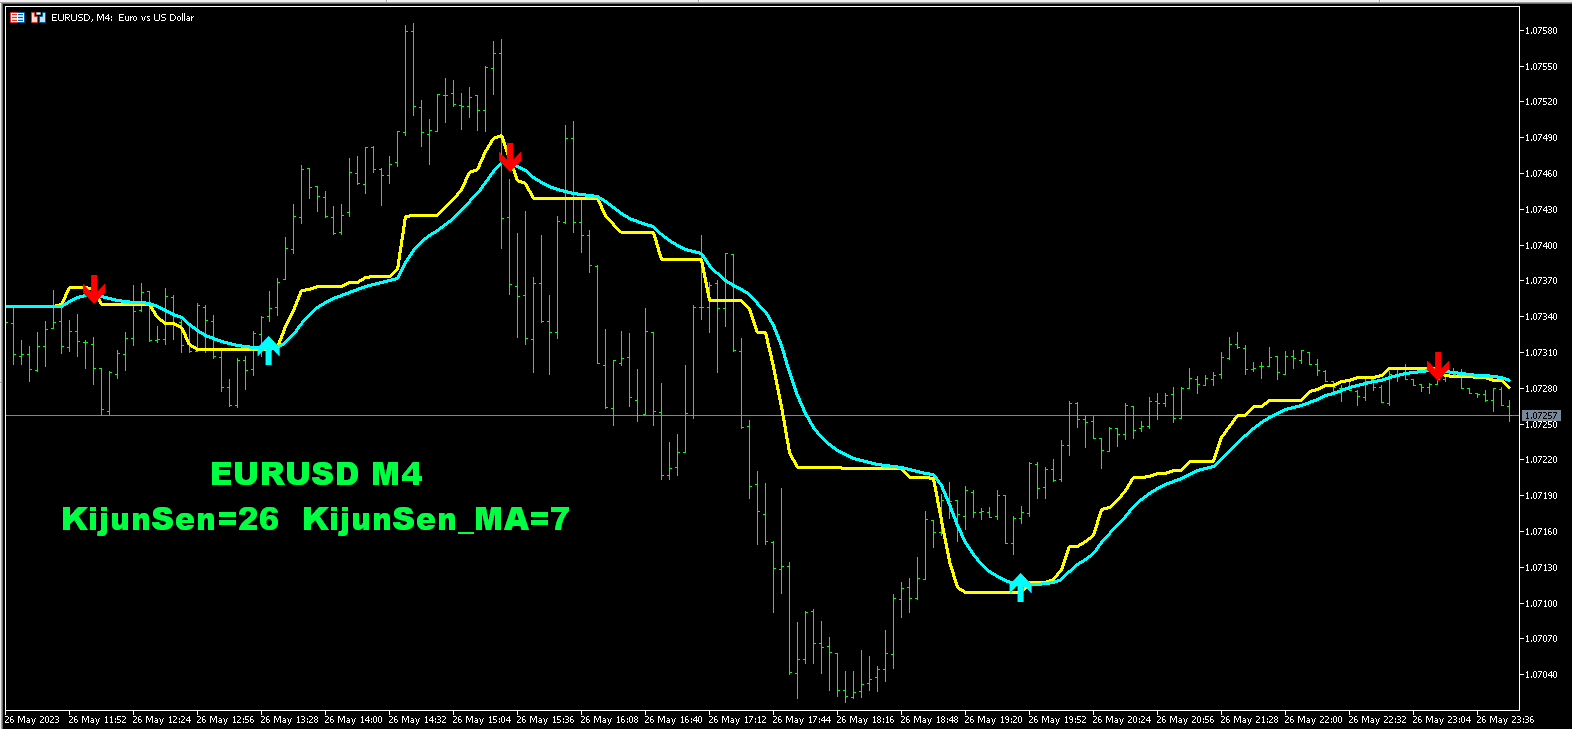
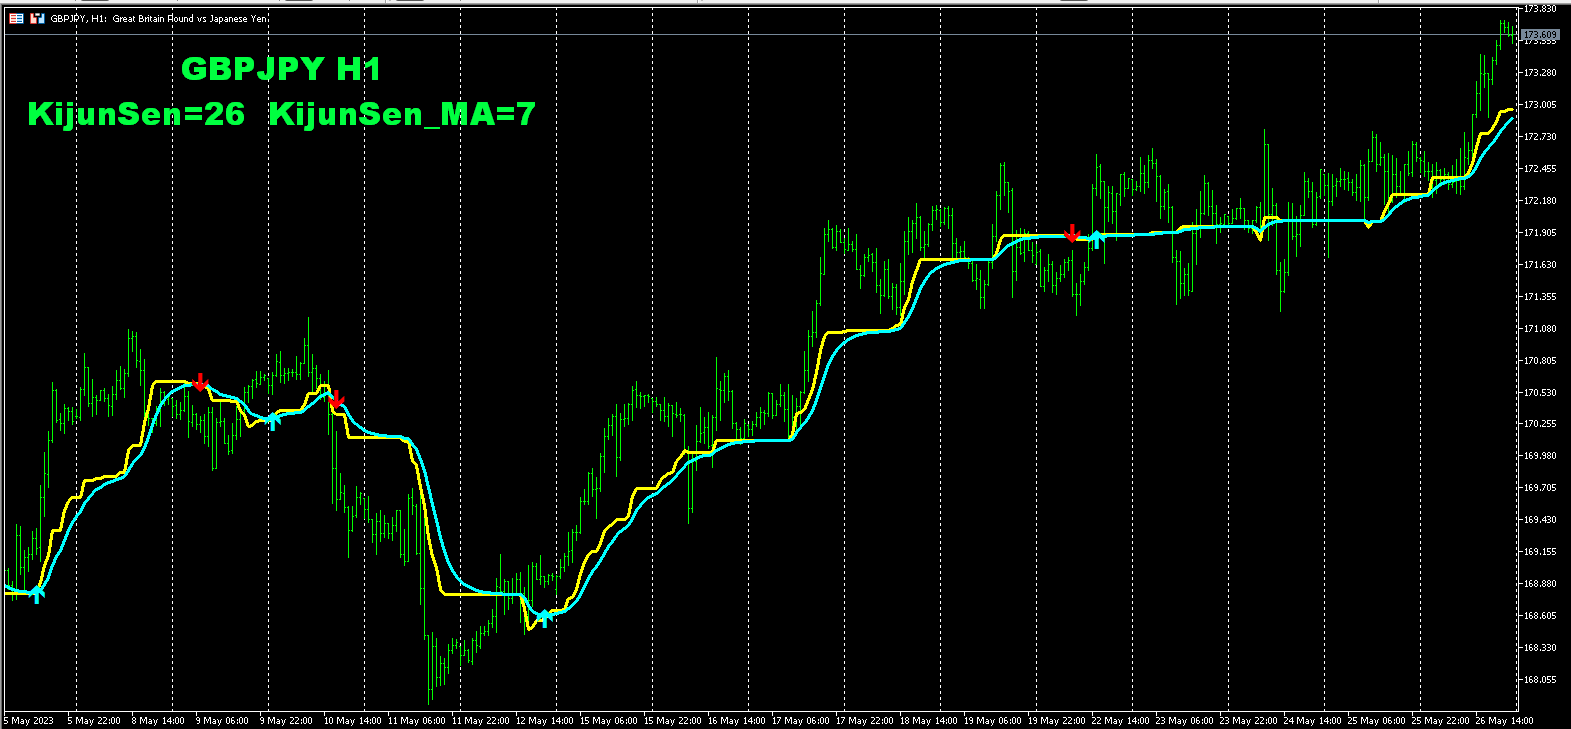
Hareketli ortalama MA'nın oluşturulduğu Ichimoku göstergesinin KijunSen çizgisine dayanmaktadır. Bu iki çizgi kesiştiğinde alım veya satım sinyalleri oluşur. Ticaretim için sıklıkla KijunSen gösterge çizgisini kullanırım: Fiyat bu çizginin ÜSTÜNDE olduğunda yalnızca SATIN ALMAYA odaklanırım, ALTINDA olduğunda ise SATMAYA odaklanırım.
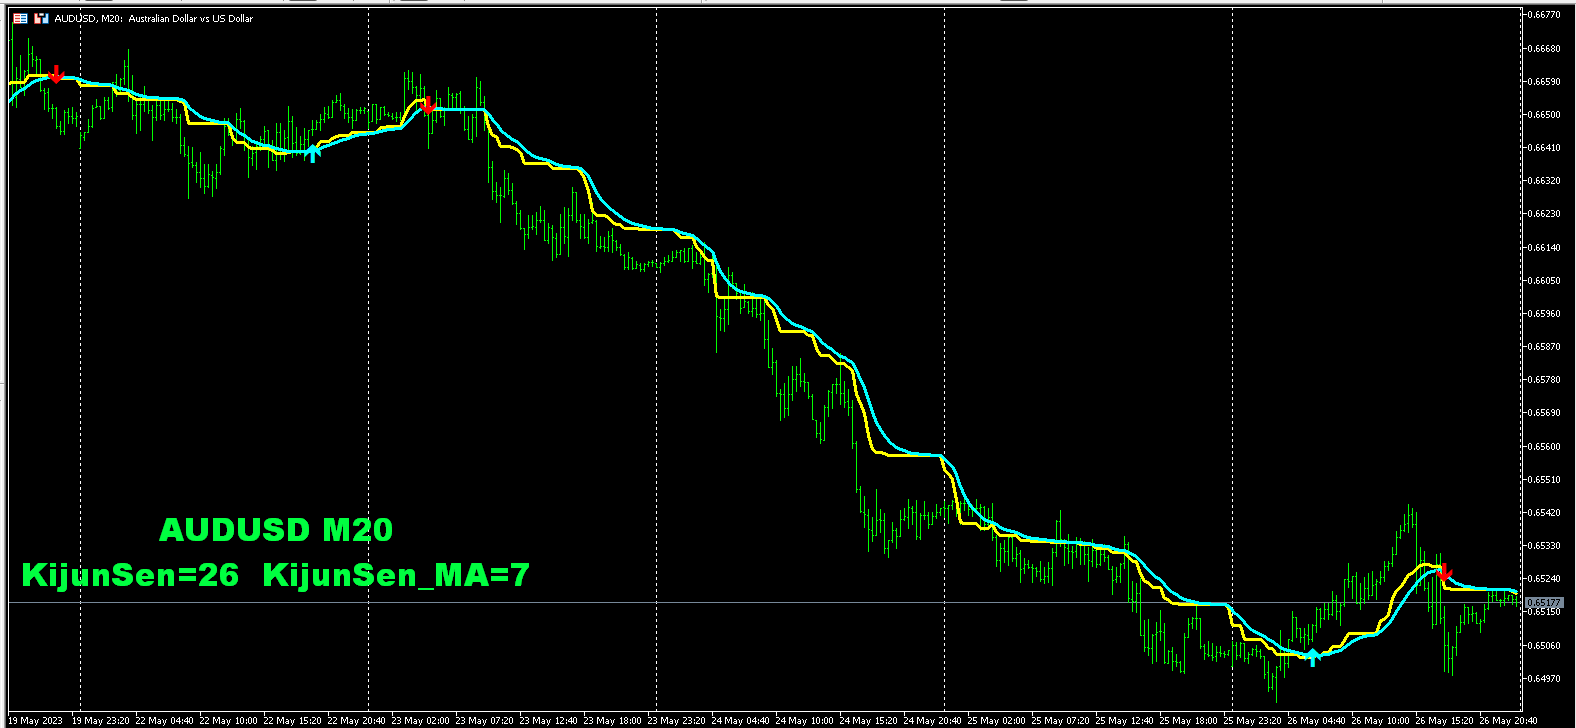
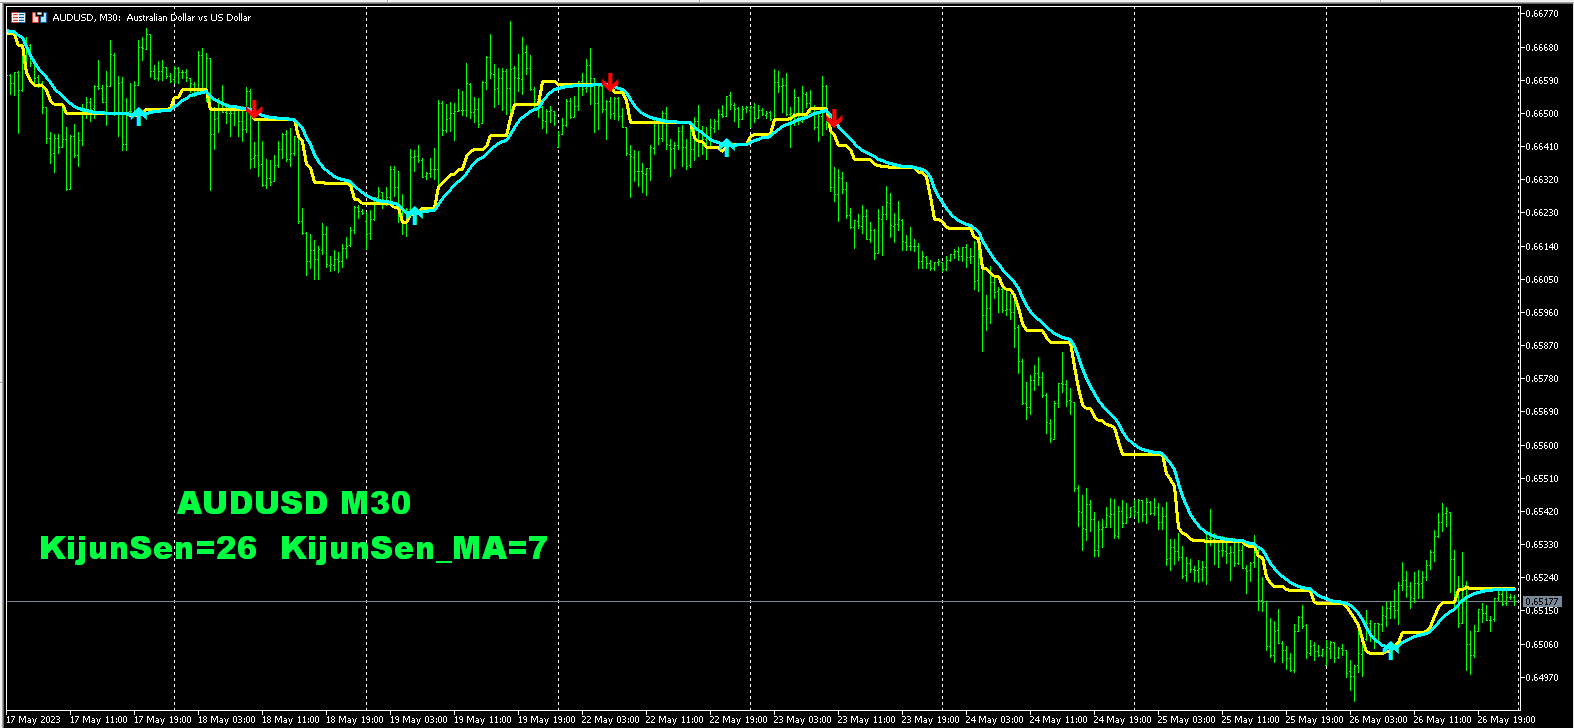
Ayrıca KijunSen çizgisinin ortalaması alınıp KijunSen hareketli ortalaması oluşturulduktan sonra bu çizgilerin ana kesişim noktaları belirginleşerek daha parlak ve daha güvenilir ticaret sinyalleri sunar. Bu kesişme noktaları yalnızca fırsatları belirtmekle kalmaz, aynı zamanda piyasada akıllı kararlar almak için katalizör görevi görür ve yatırımcının değişiklikleri net ve güvenli bir şekilde algılamasına olanak tanır. Sonuç olarak KijunSen sadece bir araç değil, aynı zamanda finansal dalgalanmalar okyanusunda yol gösterici bir yıldız haline geliyor.
Göstergenin MT4 sürümüne bağlantı:
https://www.mql5.com/ru/market/product/96120
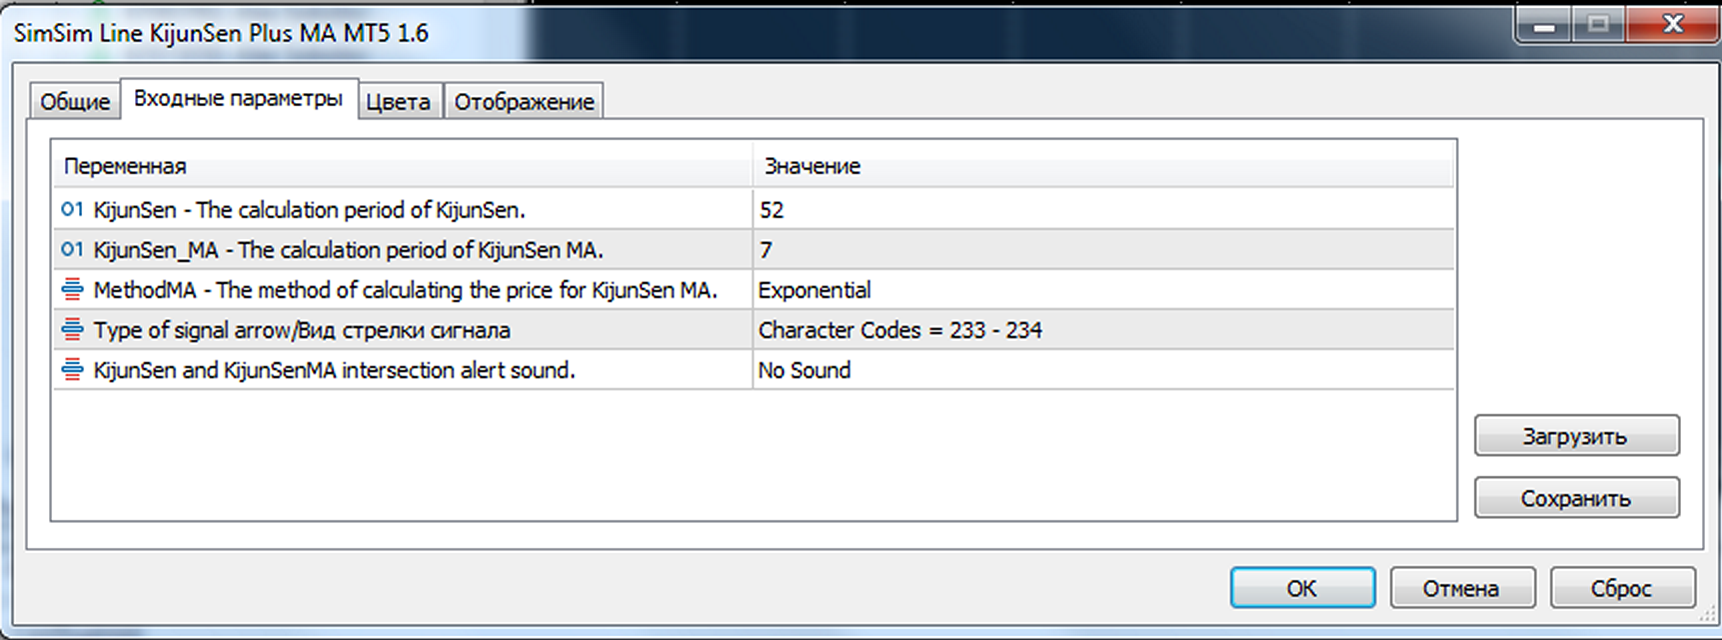
Gösterge parametreleri:
KijunSen - KijunSen'in hesaplama dönemi.
KijunSen_MA - KijunSen MA'nın hesaplama dönemi.
MethodMA - KijunSen MA fiyatını hesaplama yöntemi.
ArroyBuySell - Sinyal okunun türü
Ses - Sesli bildirim.
Danışmanlarla iletişim için gösterge tamponları.
Tampon No. 0 - KijunSen gösterge çizgisi. Tampon No. 0 göstergenin Kijun Sen çizgisidir.
Tampon No. 1 - Göstergenin KijunSen MA hattı. Tampon No. 1, göstergenin Kijun Sen MA çizgisidir.
2 Numaralı Arabellek - Arabellek boş değil = satın alma. Arabellek boş değil = SATIN AL.
3 Numaralı Tampon - Tampon boş değil = satış. Tampon boş değil = SATIŞ.
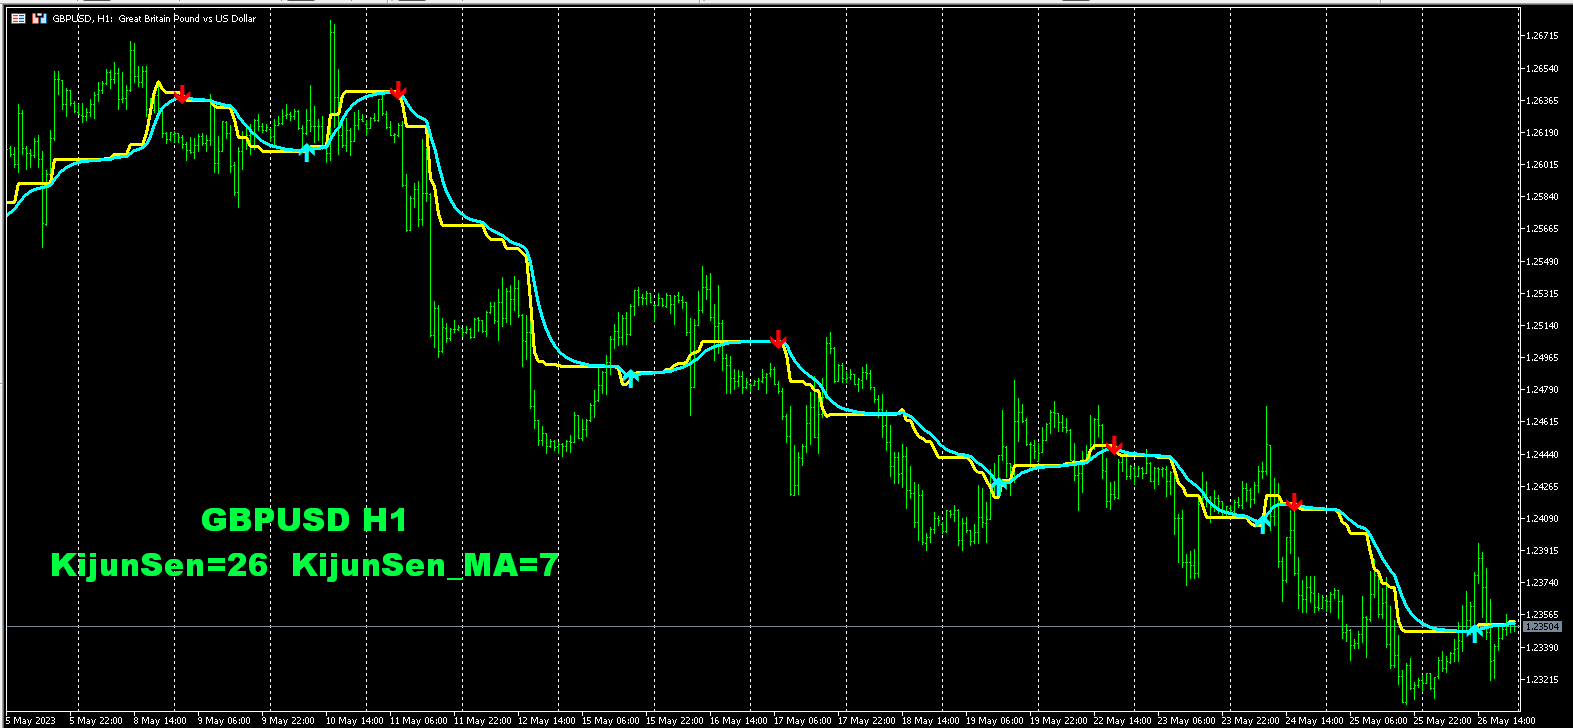
Hareketli ortalama MA'nın oluşturulduğu Ichimoku göstergesinin KijunSen çizgisine dayanmaktadır. Bu iki çizgi kesiştiğinde alım veya satım sinyalleri oluşur. Ticaretim için sıklıkla KijunSen gösterge çizgisini kullanırım: Fiyat bu çizginin ÜSTÜNDE olduğunda yalnızca SATIN ALMAYA odaklanırım, ALTINDA olduğunda ise SATMAYA odaklanırım.
Ayrıca KijunSen çizgisinin ortalaması alınıp KijunSen hareketli ortalaması oluşturulduktan sonra bu çizgilerin ana kesişim noktaları belirginleşerek daha parlak ve daha güvenilir ticaret sinyalleri sunar. Bu kesişme noktaları yalnızca fırsatları belirtmekle kalmaz, aynı zamanda piyasada akıllı kararlar almak için katalizör görevi görür ve yatırımcının değişiklikleri net ve güvenli bir şekilde algılamasına olanak tanır. Sonuç olarak KijunSen sadece bir araç değil, aynı zamanda finansal dalgalanmalar okyanusunda yol gösterici bir yıldız haline geliyor.
Göstergenin MT4 sürümüne bağlantı:
https://www.mql5.com/ru/market/product/96120
Gösterge parametreleri:
KijunSen - KijunSen'in hesaplama dönemi.
KijunSen_MA - KijunSen MA'nın hesaplama dönemi.
MethodMA - KijunSen MA fiyatını hesaplama yöntemi.
ArroyBuySell - Sinyal okunun türü
Ses - Sesli bildirim.
Danışmanlarla iletişim için gösterge tamponları.
Tampon No. 0 - KijunSen gösterge çizgisi. Tampon No. 0 göstergenin Kijun Sen çizgisidir.
Tampon No. 1 - Göstergenin KijunSen MA hattı. Tampon No. 1, göstergenin Kijun Sen MA çizgisidir.
2 Numaralı Arabellek - Arabellek boş değil = satın alma. Arabellek boş değil = SATIN AL.
3 Numaralı Tampon - Tampon boş değil = satış. Tampon boş değil = SATIŞ.

Good indicator and simple idea.