Super Power Beeta
- Göstergeler
- Sürüm: 2.0
- Etkinleştirmeler: 5

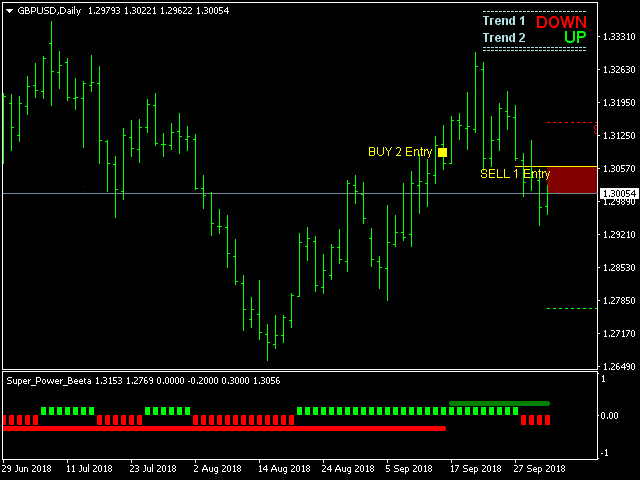
This indicator displays Super Power Beeta trend movement.Indicator is version 2 .
Features
- Multiplier - displays multiplier movement.
- Multiplier2 - displays multiplier2 movement.
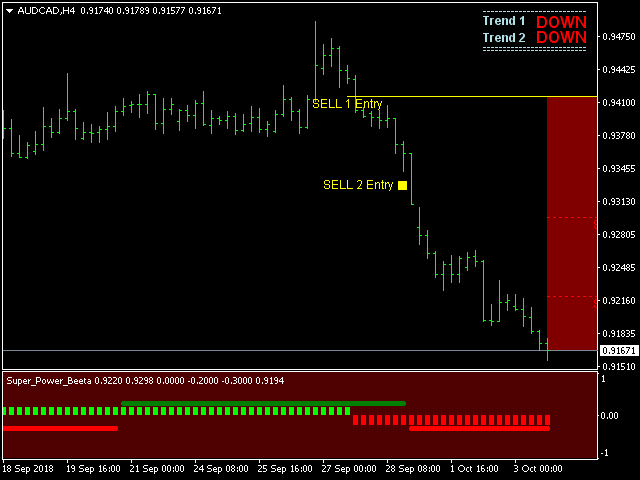
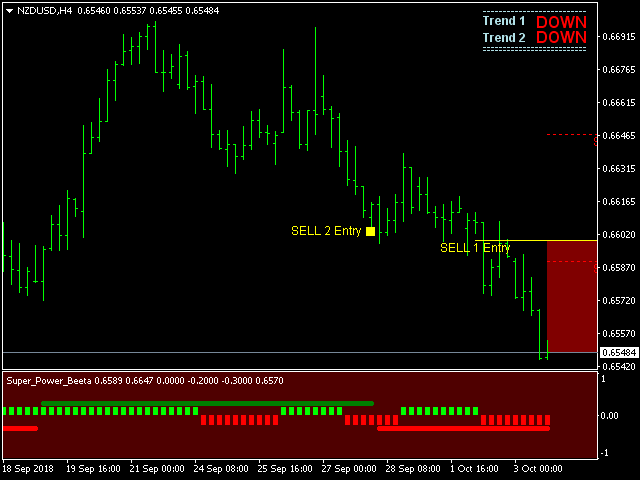
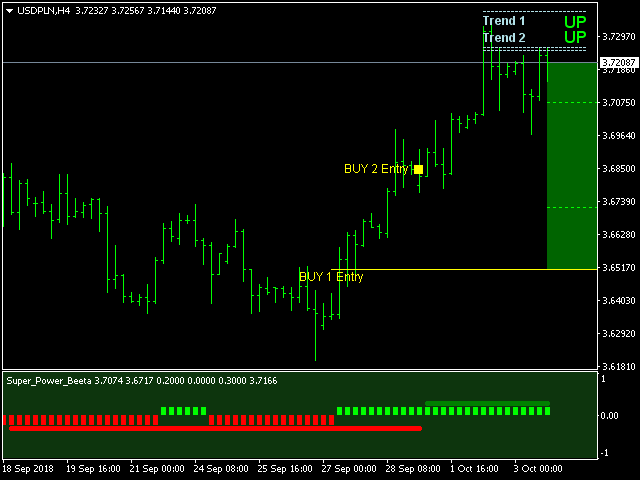
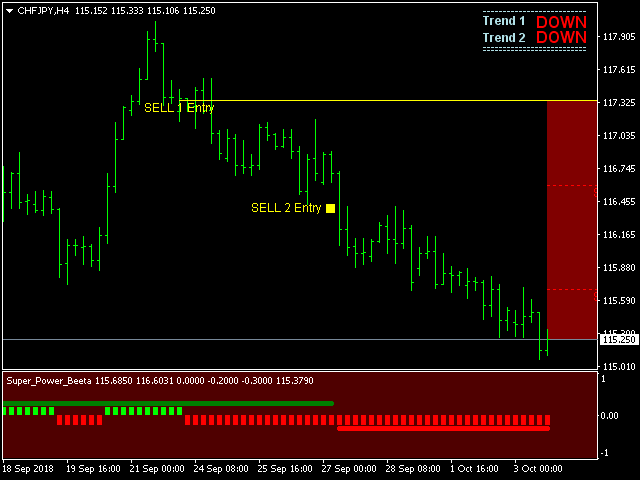
- Trend - displays indicator trend 1 and trend 2 (true/false).
- Background:color - displays background color (true/false).
- separate_window - displays trend separate window.(0-1....)
- separate_window2 - displays trend (background color )separate window.(1-2....)
- X - move the trend left and right.
- Y - move the trend up and down.
How to understand the status:
- Buy 1 Entry - trend is up.(short)
- Buy 2 Entry - trend is up.(long)
- Sell 1 Entry - trend is down.(short)
- Sell 2 Entry - trend is down.(long)
- Sell Stop 1 - Sell 1 Entry (stop)
- Sell Stop 2 - Sell 2 Entry (stop)
- Buy Stop1 -Bay 1 Entry (stop)
- Bay Stop 2 -Bay 2 Entry (stop)
- If the Trend color is green, trend is up.
- If the Trend color is red, trend is down.