RFX Market Speed
- Göstergeler
- Sürüm: 1.50
- Güncellendi: 25 Ağustos 2022
- Etkinleştirmeler: 5

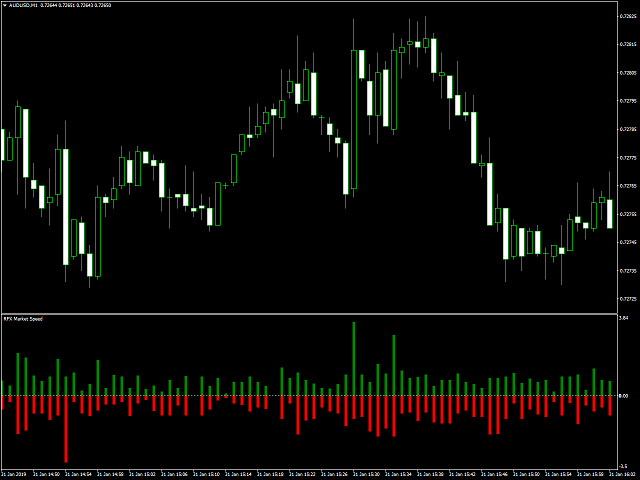
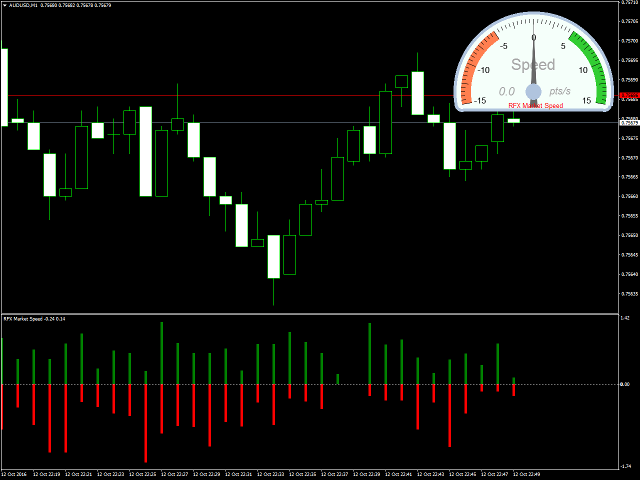
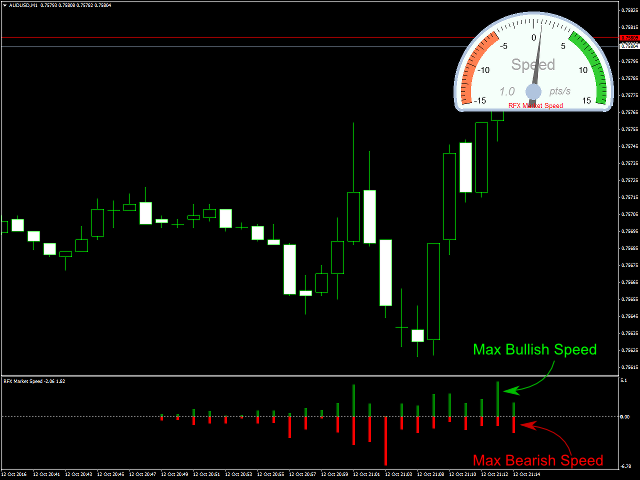
RFX Market Speed is an indicator designed to measure a new dimension of the market which has been hidden from the most traders. The indicator measures the speed of the market in terms of points per second and shows the measurements graphically on the chart, and saves the maximum bullish and bearish speeds per each bar. This indicator is specially designed to help the scalpers of any market with their decisions about the short bias of the market.
Note: The indicator uses real-ticks and CANNOT be tested in the strategy tester.
Symbols: Any
Time Frame: Any (recommended M1 and M5)
Input Settings
- Select Price Type: Three different price types can be selected: Bid, Ask and (Bid+Ask)/2.
- Maximum Range (pts/s): The value identifies the extreme speed to show on the gauge.
- Notification Threshold (pts/s): A threshold that if the current speed exceed it, an alert will be generated according the following settings,
- Play Sound?: If it is set to Yes, an alert sound will be played.
- Send Notification?: If it is set to Yes, a notification will be sent.
- Send Email?: If it is set to Yes, an email will be sent.
- Panel Size? The user can select the speed meter size on the screen between Small, Medium and Big size. The user can select to hide the panel on the chart.