RFX Market Speed
- Indicadores
- Versión: 1.50
- Actualizado: 25 agosto 2022
- Activaciones: 5

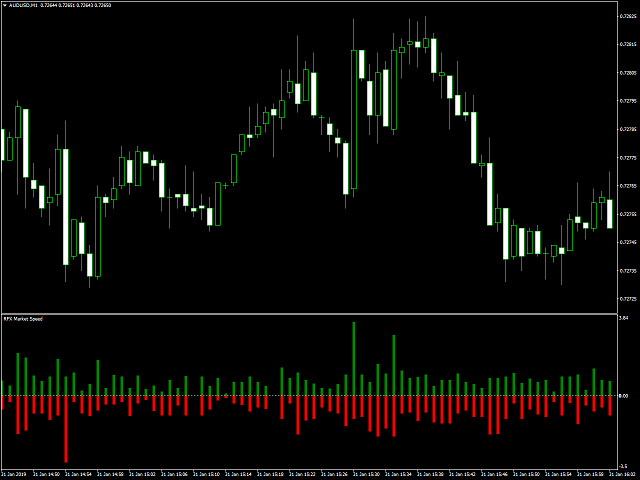
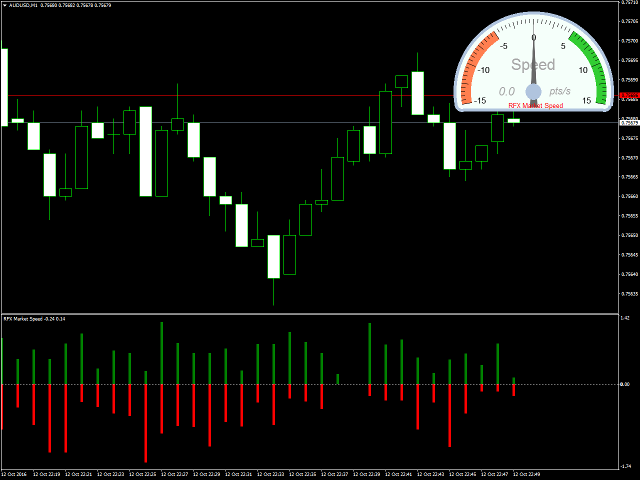
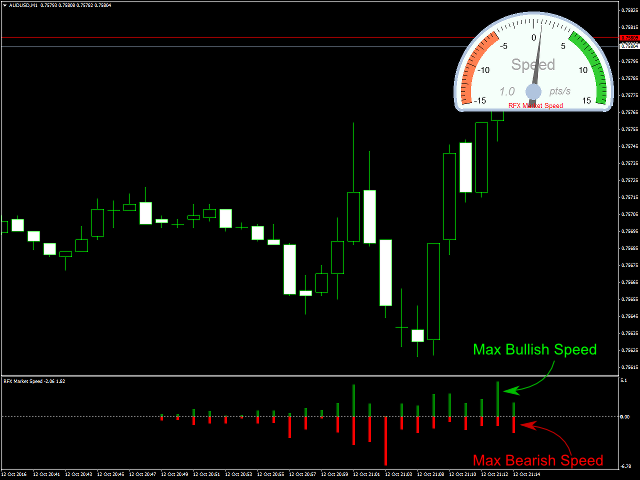
RFX Market Speed es un indicador diseñado para medir una nueva dimensión del mercado que ha estado oculta para la mayoría de los operadores. El indicador mide la velocidad del mercado en términos de puntos por segundo y muestra las medidas gráficamente en el gráfico, y guarda las velocidades máximas alcistas y bajistas por cada barra. Este indicador está especialmente diseñado para ayudar a los scalpers de cualquier mercado con sus decisiones sobre el sesgo corto del mercado.
Nota: El indicador utiliza ticks reales y NO puede ser probado en el probador de estrategias.
Símbolos: Cualquier
Marco temporal: Cualquiera (recomendado M1 y M5)
Ajustes de entrada
- Seleccionar tipo de precio: Se pueden seleccionar tres tipos de precio diferentes: Oferta, Demanda y (Oferta+Demanda)/2.
- Rango Máximo (pts/s): El valor identifica la velocidad extrema a mostrar en el indicador.
- Umbral de notificación (pts/s): Un umbral que si la velocidad actual lo supera, se generará una alerta de acuerdo con los siguientes ajustes,
- ¿Reproducir Sonido? Si está configurado como Sí, se reproducirá un sonido de alerta.
- ¿Enviar Notificación? Si está configurado en Sí, se enviará una notificación.
- Enviar correo electrónico: Si está configurado como Sí, se enviará un correo electrónico.
- ¿Tamaño del panel? El usuario puede seleccionar el tamaño del medidor de velocidad en la pantalla entre Pequeño, Mediano y Grande. El usuario puede seleccionar ocultar el panel en el gráfico.