FlatOut Movings Indicator

FlatOut Movings Robot: Yatay piyasanın (flat) mutlak kontrolü. Trendde güvenli navigasyon.
Hareketli ortalamalara (moving average) dayalı indikatör stratejilerinin ortak bir kabusu vardır. Piyasa faz değiştirdiği an, bakiyeniz erimeye başlar. Klasik hareketli ortalamalar, yatay piyasada onlarca sahte kesişim üretir. Standart filtreler ise acımasızca gecikir. Geceleri terminal başında stres içinde oturur ve hareketin tam bitiş noktasında işleme girersiniz.
Bu yazılım belirli bir görevi çözmek için tasarlandı. Robot, grafiği sürekli tarar ve piyasa yapısını tıpkı derin bir derinlik penceresi (order book) bilgisi gibi okur. Hem tam bir yatay bantta hem de güçlü trend impulslarında aynı etkinlikte işlem yapar. Sistem, gerçek kırılımı sahte çıkışlardan adeta bir neşter gibi cerrahi bir hassasiyetle ayırır.
⏳ Piyasa kaosunun çağlarında zaman testi
Yazılımın matematiksel çekirdeği, birbirini izleyen on yıllık kaotik fiyat fırtınası döngülerinden geçirilmiştir. Algoritma, her türlü küresel finansal krize ve piyasa dönemi değişikliklerine dayanacak şekilde tasarlanmıştır.
⚡ İmpuls avcısı: Robot, fiyatın en az direnç vektörü boyunca uçtuğu geri dönüşü olmayan noktada işleme girer. Girişler o kadar hassastır ki, pozisyonlar kural olarak neredeyse hiç toksik ters fiyat baskısına maruz kalmaz.
🤖 Seri dominant: Robot kaotik dalgalanmalar bilmez. Davranışı katı bir matematiksel düzene tabidir. Bir dalga yakalarsa, yoğun ve kesintisiz bir kapalı işlem kaskadı oluşturur. Algoritma trende inatla tutunur, piyasa impulsu tükenene kadar birbiri ardına başarılı pozisyonlar inşa eder. Nadir görülen stop-loss'lar onun için bir trajedi değil, sadece nişangah ayarıdır.
↕️ Çift yönlü derinlik süpürme: Robot, Long ve Short yönlerinde aynı etkinlikte çalışır. Rapordaki yönlerin sayısı eşdeğerdir. Tarihsel verilere göre rastgele manuel parametre uydurması (overfitting) kesinlikle yoktur.
⚙️ Demir Grid stratejisti: Uzun süren yatay piyasa veya sahte kırılım anlarında, en ufak bir yüzen zararda (drawdown) pozisyonu hemen kesmez. Robot, esnek ve dağıtılmış bir emir ızgarası (grid) açarak pozisyonel kuşatma modunu devreye sokar. Yüzen riski soğukkanlılıkla absorbe ederek marj baskısını tamamen kontrol altında tutar.
🎯 Soğukkanlı keskin nişancı: Yazılım, mükemmel bir matematiksel etkinlik ve güçlü bir toparlanma faktörü (recovery factor) sağlayarak ideal giriş noktasını bekler.
🎁 Algoritmayı ücretsiz test edin
Artık monitör başında sinirlerinizi ve zamanınızı tüketerek 7/24 stres içinde yaşamak zorunda değilsiniz. Bu teknolojik çözüm tamamen çalışmaya hazırdır. Başkalarının sözlerine inanmayı bırakın; algoritmayı gerçek geçmiş veriler üzerinde kendiniz test edin.
Mevduat koruma aracınızı hemen şimdi alın!

   1. Bu Market sayfasındaki "Demoyu İndir" butonuna tıklayın.
   2. Terminalinizdeki strateji test ediciyi açın ve geçmişten herhangi bir zaman dilimini seçin.
   3. Testi başlatın ve sistemin piyasa gürültüsünü nasıl kestiğine bizzat şahit olun.

------------------------------
SSS:

   1. Bu ürün hangi pariteler için yapılandırılmıştır?
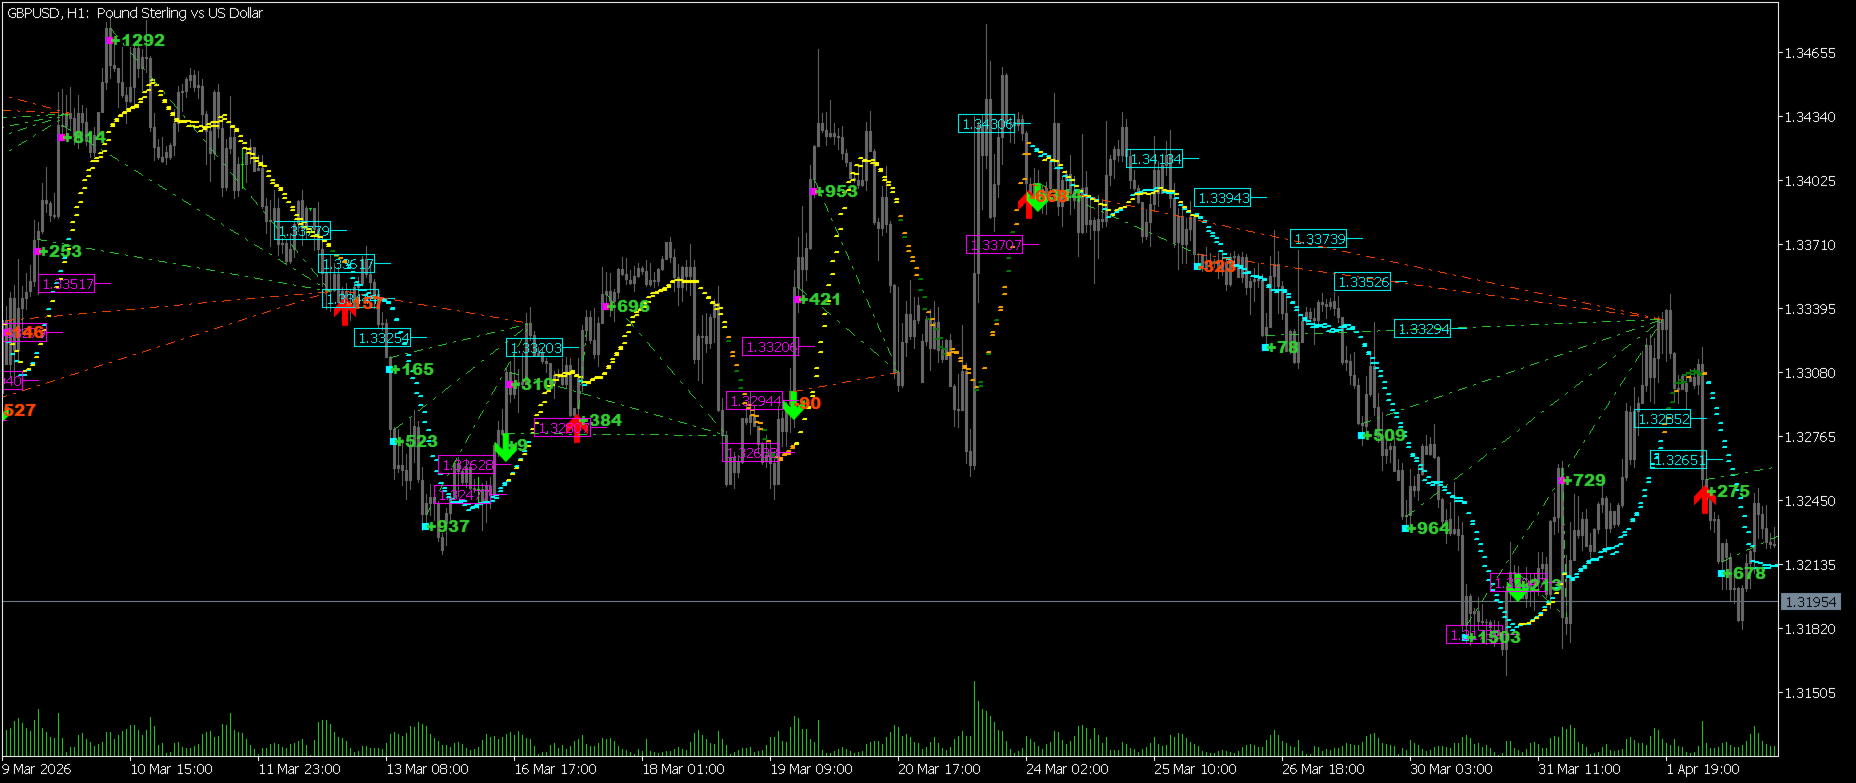
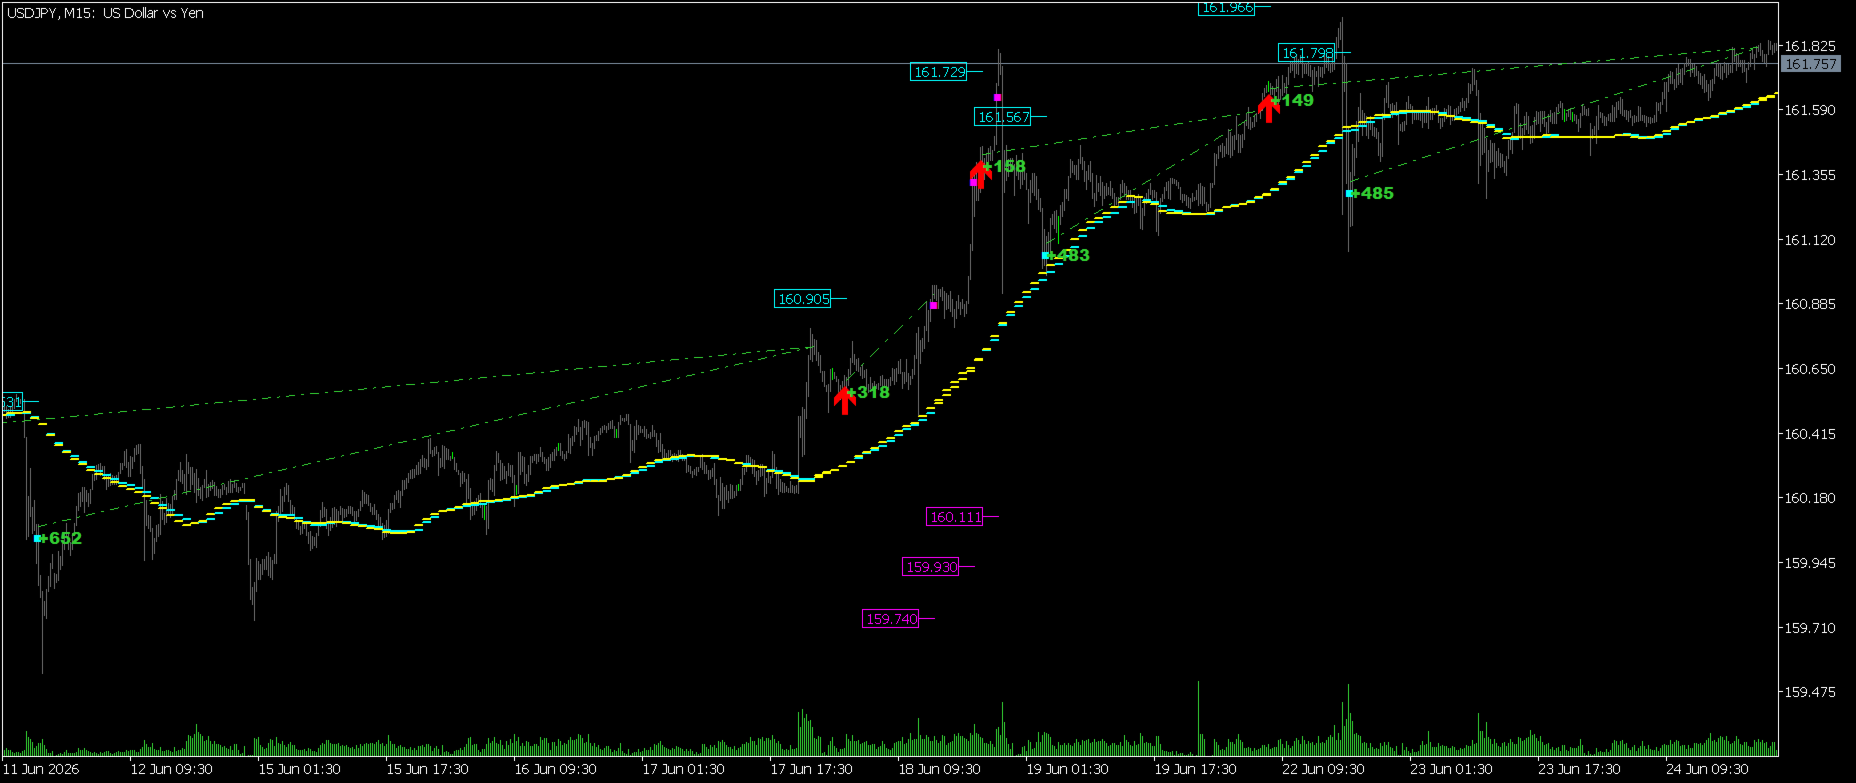
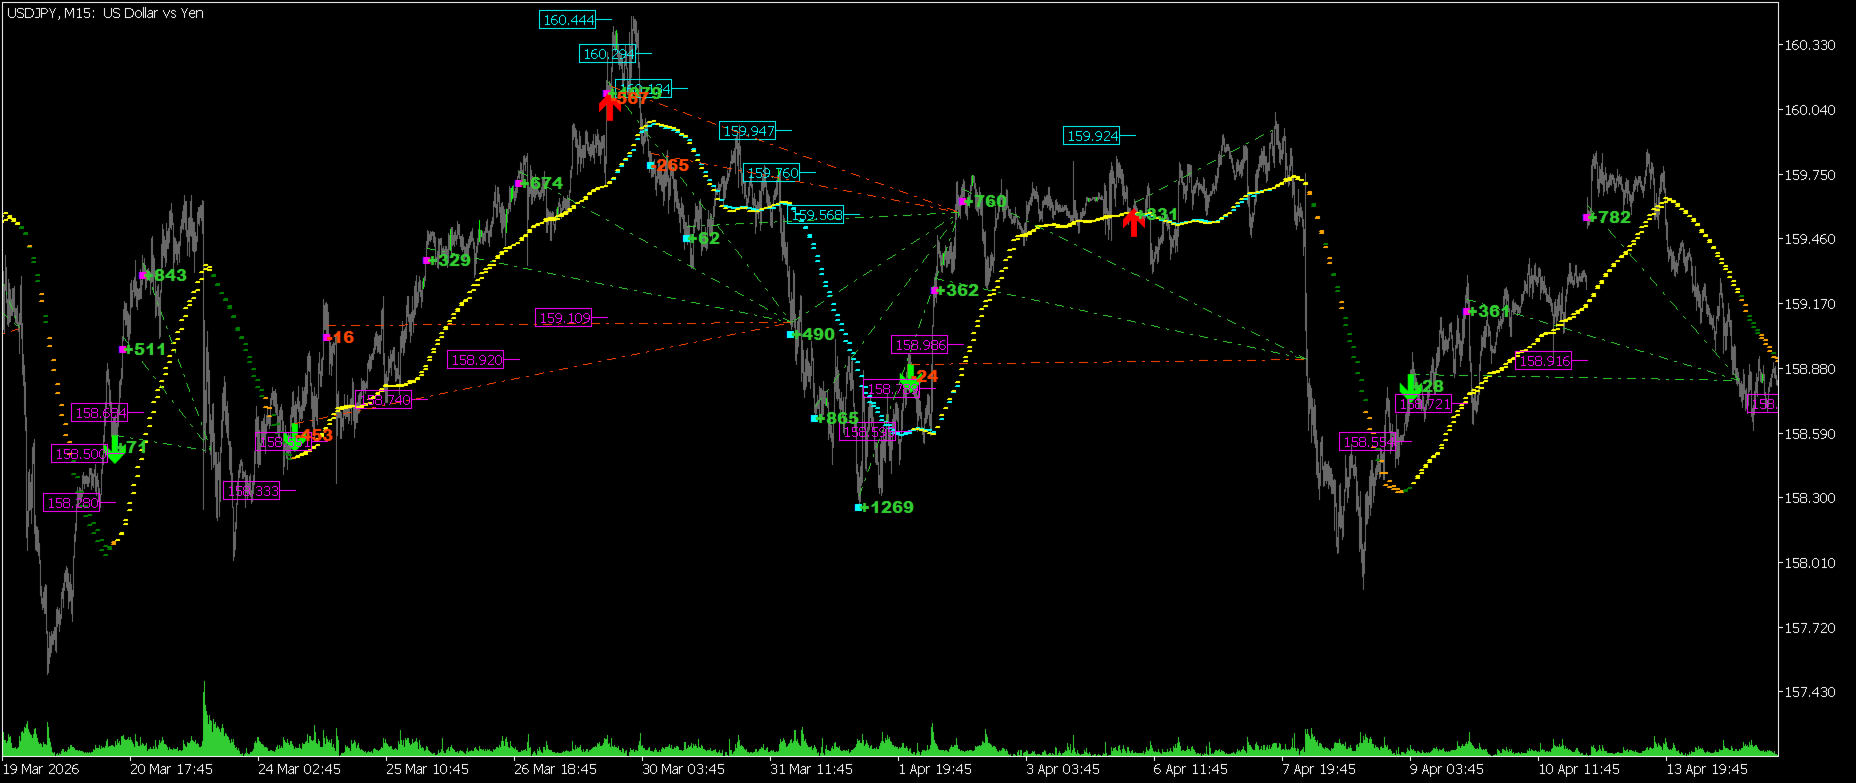
   Bu uzman danışman (Indicator) teknik olarak her paritede çalışır ve varsayılan ayarları kullanır. Ancak, özellikle EURUSD, GBPUSD ve USDJPY üzerinde çalışmak üzere optimize edilmiştir.
   Tam olarak bu paritelerde kendi etkinliğini maksimum düzeyde gösterir.
   2. En iyi hangi zaman diliminde (timeframe) çalıştırılır?
   🦎 Adaptif bukalemun: Onun için zaman dilimi sadece optik bir lenstir. Küçük adımlarda (M15, M30, H1) hızlı bir scalper gibi davranır. Büyük periyotlarda (H2 ve H4) ise adımını büyüterek piyasa yoğunluğunu monolitik, filtrelenmiş pozisyonel kararlara dönüştürür. Robot, mum yoğunluğuna mükemmel şekilde uyum sağlar ve aracı kurumun mum içi gürültüsünü tamamen filtreler.
   Böylece ürünü M15, M30, H1, H2, H4 zaman dilimlerinde çalıştırabilirsiniz.
   3. Uzman danışman için ne tür bir hesap uygundur?
   Standart Netting sistemi teknik olarak robotun mantığıyla uyumsuz olduğundan, karşıt emirlere (Hedging) izin veren bir hesap gerekecektir. En iyi seçim ECN/Raw (büyük meblağlar için), Cent (10.000 $'a kadar olan mevduatlar için) veya 1:100'den başlayan kaldıraçlı Swap-Free (İslami) hesap türleri olacaktır.
   4. Hangi minimum mevduat ile ticarete başlanabilir?
   Tek bir parite için standart hesapta 800-1000 $ (veya cent hesapta 10 $) gereklidir. İki veya üç parite için bu miktar orantılı olarak artar: standart hesapta 2K/3K $ (veya cent hesapta 20/30 $).
   5. Danışmanın geçmiş verilerdeki maksimum düşüşü (drawdown) nedir?
   55 yıllık geçmiş verilerde özkaynak bazındaki (Equity) maksimum yüzen düşüş şu şekilde gerçekleşmiştir: EURUSD için %7.08, GBPUSD için %9.31 ve USDJPY için sadece %4.17.
   Bakiye bazındaki göreceli düşüş ise geçmişte %2.27 – %16.95 civarında dalgalanmıştır.
   6. Üç döviz çiftinin tümünü bir arada çalıştırabilir miyim (farklı magic number ile)?
   Evet, ve bu oldukça mantıklıdır. EURUSD, GBPUSD ve USDJPY üzerinde farklı Magic Number'lar ile eşzamanlı olarak çalıştırmak bir portföy (ensemble) etkisi yaratır: pariteler bağımsız olarak ticaret yapar, birbirlerinin düşüşlerini dengeler ve istikrarlı, çeşitlendirilmiş bir ticaret akışı oluşturur.
   7. Başlangıçta hangi ayarlar kullanılmalıdır?
   📦 Kutudan çıktığı gibi tam otonomi: Manuel parametre ayarlamayı ve yüzlerce sayfalık kılavuzları okumayı unutun. Ürün, temel döviz çiftlerinin karakterine göre başlangıçta optimize edilmiştir. Robot grafiği otomatik olarak tarar, pariteyi tanır ve anında işe koyulur. Birkaç tıklama ile başlamak çok kolaydır. Tek yapmanız gereken uzman danışmanı önerilen paritenin grafiğine yerleştirmek, istediğiniz zaman dilimini seçmek ve çeşitlendirme için benzersiz bir Magic Number belirlemektir.
   8. Danışmanın çalışmaya başladığını nasıl anlarım?
   Her şey çok basit:  ayarlardan Enable: Detailed operational logs parametresini aktif hale getirin; ekranın kendisinde sistem durumunu gösteren bir metin belirecek ve «Uzmanlar» sekmesinde çalışma günlükleri (her 1-4 saatte bir detaylı raporlar sunmak üzere) güncellenmeye başlayacaktır.
   9. Zaman dilimini değiştirirken ekranda neden donmalar oluyor?
   📸 Piyasanın kuantum anlık görüntüsü: İlk başlatmada, zaman dilimi değiştirildiğinde veya bağlantı koptuğunda terminal, tüm geçmişin eksiksiz bir denetimini gerçekleştirerek kısa bir süreliğine donacaktır. Sistem, fiyat sapmalarını tamamen dışlamak ve pozisyon korumaya yönelik kusursuz bir matematiksel model açmak için kısa bir ara verir.
   10. Emir neden açılmadı ama sistem onu açılmış gibi saydı?
   🔒 Dijital otonomi: Robotun iç matematiği piyasa gerçekliğinin üzerindedir. Bu, uzman danışmanın benzersiz bir koruma özelliğidir. Bağlantı kopması veya aracı kurumun fiyat kaymaları (slippage) nedeniyle bir emir gerçekte açılmadıysa, robot bunu modelin belleğinde anında sanal olarak hesaba katar. Robot için kendi matematiksel modelinin bütünlüğünü korumak — ki bu onun piyasa kaosuna karşı ana kalkanıdır — her şeyden önemlidir; bu yüzden sistem tek bir grid üzerinde minimum teknik zarara bilerek izin verir. Böyle bir senaryo son derece nadir yaşanır, çünkü robot fiyat mum açılışına yakın dalgalandığı sürece emri açmak için 10'a kadar deneme yapar.
   11. İndikatör sinyallerini yeniden çizer mi (repaint) ve bilgisayar kapatılırsa ne olur?
   İndikatör gecikme yapmaz ve sinyallerini yeniden çizmez. Terminali kapatırsanız uzman danışman hiçbir şey kaybetmez: yeniden başlatıldığında, emirlerinizin Magic Number'ına göre tüm matematiksel modeli geçmişin başından itibaren anında yeniden hesaplar. Bilgisayarı kapatmanın ana tehlikesi, gridin kârla (take-profit) kapanma anını kaçırmaktır, bu nedenle kesinlikle bir VPS sunucusu kullanılması önerilir.
   12. İndikatörün neden buffer'ları yok ve ürün hangi tempoda çalışıyor?
   İndikatör buffer kullanmaz, sinyalleri grafik nesneleri (çizgiler, oklar) aracılığıyla ekrana yansıtır. Bu, hafızada gereksiz geçmiş verilerin depolanmasını engeller ve hesaplamaları kat kat hızlandırır. Fiyat iğnelerine (spike) karşı bağışıklık: Bu üründe sistem her tick'te veya bar içinde güncellenmez, kesinlikle H1 veya H4 mumlarının açılış fiyatlarına bağlıdır — bu durum algoritmayı piyasa gürültüsünden, sahte iğnelerden ve stop avlarından tamamen korur.
   13. Ya aracı kurum hedeflerimi görür ve pozisyonlarımı patlatmak için sahte bir fiyat iğnesi oluşturursa?
   🥷 Görünmezlik modu: Görünmezlik modu sayesinde bu durum imkansızdır. Robot, sanal emir algoritması kullanır: tüm gerçek fiyat seviyeleri ve hedefler yalnızca uzman danışmanın hafızasında bulunur ve aracı kurumun sunucusundan tamamen gizlenir. Stoplarınızın avlanması teknik olarak imkansızdır, çünkü aracı kurum sistemin pozisyonları tam olarak nerede kapatmayı planladığını göremez.
   14. Ya emir ızgarası (grid) çok büyürse?
   🛡️ Sermaye sigortası: Bu durum için bir sermaye sigortası öngörülmüştür — Risk: Enable grid depth protection parametresi. Izgaradaki maksimum emir sayısını katı bir şekilde sınırlandırabilirsiniz (örneğin en fazla 8). Piyasa sistemin tersine giderse ve düşüş (drawdown) derinliği bu kritik eşiğe ulaşırsa, robot ana mevduatınızı maksimum düzeyde korumak adına riskleri keserek yükü otomatik olarak hafifletir.


Yazarın diğer ürünleri
Golden section price action indicator - is a trend-scalping complete system with enter and exit points. Indicator is based on most powerfull price action japan patterns that are filtered by volume, volatility, market phase. Pattern is not a simple combinations of candles. Patterns must have "weight" to move market in right direction. "Weight" - is the summary of pattern's volume, the size of pattern candles according to last average volatility and ofcourse pattern must appear in correct market p
SupportResistancePeaks Indicator indicator - is the combination of dynamic support/resitance and price action pattern. As a rule support/resistance indicators uses already calculated, history levels. The most disadvantage of this method - new(incomming) levels always are not the same as were on history, in other words accuracy is not so high as expected. My indicator is looking for dynamic/live levels that are forming right now after trend lost it's power and choppy market starts. As a rule exac
Trend deviation scalper - is the manual system to scalp choppy market places. Indicator defines bull/bear trend and it's force. Inside exact trend system also defines "weak" places, when trend is ready to reverse. So as a rule, system plots a sell arrow when bull trend becomes weak and possibly reverses to bear trend. For buy arrow is opposite : arrow is plotted on bear weak trend. Such arrangement allows you to get a favorable price and stand up market noise. Loss arrows are closing by common p
Trend driver bars is the manual trading system, which defines current trend continue or it's pull-back/reverse. "Driver" bars - are price action patterns that has powerfull affect on market, defining it's near future direction. Generally, driver bars represents trend "skeleton" and often anticipates new market impulse. System plots arrows when market shows 3 pattenrs in a row(most powerfull combo-pattern), and makes fast scalping of incomming movement. Loss positions closes by common profit. Lot
Wave Impulse OmegaScalper - is the manual system for scalping. In many cases Indicator "eats" almost all possible trend wave. System defines up price wave and down price wave. Inside the exact wave - system defines true trend movement and choppy market. Indicator plots signals while market is trending, powerfull and has quiet good volatility. This is complete system with enter and exit points. Main Indicator's Features Signals are not repaint,non-late or disappear(exept cases when system recalcu
Reverse side scalper is the manual trading system, that works on choppy(anti-trend) market. As a rule markets are on 80% choppy and only 20% is trend phase. System is based on custom step Moving and RSI and reverse pattern. System defines up movement, down movement, trend / choppy phases. Indicator plots Buy signal arrow when current direction is down and phase is trend, Sell signal arrow is plotted when currently is up movement and phase is trend. As a rule it allows to "catch" local maximum/mi
Binary step clouds - is the complete trading system with enter and exit points. System is based on double smoothed exponential step moving and volume weighted simple step moving.Generally each movings define trend direction and places when trend is in active phase. Signals plots when both movings approache to active trend phase and market speed is high.  Main Indicator's Features Signals are not repaint,non-late or disappear(exept cases when system recalculates all history datas,refreshing main
Acceleration Force Meter Indicator - is a trend system that join market in trend phase and after trend pull-back. AFM indicator - is the system that watchs market phases from flat to extreme volatility and prefers to enter in market when it's active, more volatility, ignoring most flat places. This is 100% complete trading system including enter and exit points. It works well with profitable trades - maximizing take profit targets(analysis of recent market volatility, its pips range to adapt cur
ImbaTrend Runner - is the trend following manual system for forex/crypto market. It defines medium-term trends and works with it in intraday mode. System shows enter points, profit and loss targets. As a rule profit targets are 2-3 X bigger than loss targets. Indicator is AutoAdaptive and it automatically updates it's settings during trading. Indicator is sensitive to market changes, regular updates helps to stay in relevant trend. Main Indicator's Features Signals are not repaint, late or disap
Early WPR divergence - is the manual system to define trend reverse. Green histogram shows main trend, Orange one - shows "short"/local trend. System is looking for clear divergence between both trends and pick up position(plot buy/sell arrows). When main trend is up, but local trend reverses to bearish trend and get's big power - sell arrow is plotted;    When main trend is down, but local trend reverses to bullish trend and get's big power - buy arrow is plotted;  Main inputs are : mediumTrend
Bull bear pressure indicator - is the manual system which defines bull/bear market. When lines is above zero level - market is strong bullish, and when lines below zero level - market is bearish. First line represents global trend and second one are smoothed and shows local market's mood. Main inputs are : MainPeriod- main indicator's period for global trend calculation; SignalPeriod - period for   smoothed and shows local market's trend; Main Indicator's Features Signals are not repaint,non-la
ROC acceleration-deceleration is the manual system for medium-term scalping. Indicator based on custom ROC system which defines bullish/bearish market and especially  acceleration-deceleration of tendention in the market's main direction. Buy arrow is plotted during bearish market when current trend decelerates and sell  arrow is plotted during bullish market when current trend decelerates. Main Indicator's Features Signals are not repaint,non-late or disappear(exept cases when system recalculat
ASI fractals with DPO filter - is the manual trend-following system. ASI fractals are the base of every trend. System plots an arrow when fractal pattern appears on ASI indcator and DPO direction is same as incomming signal. System has several ways of usage : simply indicator, indicator with suggested arrows, arrows with single targets and arrows with common profit targets. User can simply switch indicator's modes directly from chart. Main Indicator's Features Signals are not repaint,non-late or
Trend reversal index - is the manual trading system that works with overbought , oversold levels and reversal patterns. Sell arrow is plotted when indicator is higher than overbought level and here forms reversal pattern, all pattern points  located higher than overbought level. Opposite with buy arrow : ndicator is lower than oversold level and here forms reversal pattern, all pattern points located lower than overbought level.  Main Indicator's Features Signals are not repaint, late or disapp
Demarker pullback system - is the manual trading system for choppy markets. It show 2 colored histogram.  When histogram is blue - market is quite bullish, when histogram ir orange - market is more bearish. Up arrow is plotted when histogram is in oversold zone but blue color. Down arrow is plotted when histogram is in overbought zone but orange color. These patterns shows false breakout and possible soon reverse(price is overbought but shows bearish signs and price is oversold but shows bullis
TPM Cross (trend power moving cross) - is a trend following strategy based on custom signal points. Indicator consists from main custom moving chart line and trend power line. Indicator defines up and down movements by it's trend power and custom moving direction. When current market's trend looses it's power and opposite trend starts - power trend line  crosses moving and indicator plots an arrow.  Main indicator's adjustable inputs : movingPeriod - period of moving line  trendPeriod  - period
Impulse fractals indicator - is counter-trend oriented complex market fractal pattern.  Market creates bull/bear impulse, trend starts, fractals on impulsed wave are an agressive pullback signals. Buy arrow is plotted when market is bearish and it's impulse showed up-side fractal, and sell arrow is plotted when market is bullish and it's impulse showed dn-side fractal. Main indicator's adjustable inputs : impulsePeriod - main period of impulse histogram  filterPeriod  - smoothes impulse accordi
Floating peaks oscillator - it the manual trading system. It's based on Stochastik/RSI type of oscillator with dynamic/floating  overbought and oversold levels. When main line is green - market is under bullish pressure, when main line is red - market is under bearish pressure. Buy arrow appears at the floating bottom and sell arrow appears at floating top. Indicator allows to reverse signal types. Main indicator's adjustable inputs : mainTrendPeriod; signalTrendPeriod; smoothedTrendPeriod; tre
Trend speed vector - is the oscillator for manual trading. System measures trend direction and it's speed. Histogram shows 4 colors: Lime --> Strong up movement with good gain speed; Green --> Up movement with low gain speed Red --> Strong down movement with good gain speed; Orange --> Down movement with low gain speed Green and Orange histograms show weak market's movements and thуese places excluded from signal points. Buy arrow is plotted during strong down movement when bearish gain speed i
Floating gain meter is the manual trading system that works with local trends and it's scalping. Histogram represents  bull/bear floating trend gain. Green color histogram shows choppy market with bullish pressure, Orange - shows choppy market with bearish pressure. Lime and Red colors shows "boiled" places in market. As a rule buy arrow is placed after strong Down movement when it's power becomes weak and choppy market starts. And sell arrow is plotted after strong Up movement when it's power
Pullback points indicator - is the manual trading system, that shows most popular market prices. Indicator measures bull/bear waves pressure and looks for "consensus" prices. As a rule these points are crossed up and down very often and opened trade has several chances to be closed in positive zone. Mainly, such points is the good base for "common profit" types of strategies. Indicator also represents   "common profit"  scalping method of trading as default one.  Main Indicator's Features Signa
Noize Absorption Index MT4
Ekaterina Saltykova
5 (1)
Noize Absorption Index - is the manual trading system that measures the difference of pressure between bears forces and bulls forces. Green line - is a noize free index that showing curent situation. Zero value of index shows totally choppy/flat market.Values above zero level shows how powerfull bullish wave is and values below zero measures bearish forces.Up arrow appears on bearish market when it's ready to reverse, dn arrow appears on weak bullish market, as a result of reverse expectation. S
Looking for EA to automate your trading strategy on the Forex market? TrendRocWaves Robot — your faithful companion in the world of trading! This 100% automated EA offers unique features: - works exclusively on high timeframes (H1 and H4) for confirmed response to market changes. - uses the most popular and liquid currency pairs such as EURUSD,GBPUSD with minimal spreads and fast transaction execution. - applies a scalping method based on a medium-term trend to achieve local goals and reduce r
Introducing the trading system Dynamic Trend Cycles Robot  — a powerful tool for H1-H4 trading with volatility pairs! Technical capabilities - pairs to trade : EURUSD,GBPUSD,XAUUSD;  - timeframes : M30,H1,H4; Why Choose Dynamic Trend Cycles Robot (DTC)? - Accurate Trend Analysis: DTC adapts to current market volatility, providing precise tracking of price trends. This allows you to confidently open positions in line with the main trend and maximize your profits. - Filtering False Signals: In t
Introducing to your attention an innovative expert advisor created specifically for the most juicy and volatility    currency     basket: GBPUSD and XAUUSD. This EA is designed using the main features of this market's movement, making it an ideal choice for dynamic trading on high-trending and medium-volatile pairs. The advisor is focused on minimizing trading risks, aiming to reduce losses to a minimum. Main features: EA is designed to open and close orders at the begginning of trading session
Introducing to your attention unique trading advisor, Squeeze roc xau points, exclusively designed for trading on the XAU/USD pair. We analyzed predominantly all objectively important timeframes and identified unique characteristics of gold movements relative to the dollar to create this product. These insights can be extremely useful in predicting market reversal points on timeframes from M30 to H8 for the XAU/USD pair. You can choose your favorite timeframe to receive signals or use multiple
Introducing to your attention a unique trading advisor "Detrended scalper jpy points robot", designed for trading with major JPY crosses. The idea is based on a modified indicator, detrended price oscillator, whose task is to eliminate the influence of the trend on price movements. This greatly simplifies the process of determining overbought/oversold cycles. The focus is on analyzing short cycles: long market cycles consist of several short ones. By analyzing the short components, we can more
Introducing the automated trading system "Flexi trend tracker robot" — a powerful instrument for hour+ timeframe trading with medium/soft volatility pairs! This EA offers unique features:  wide range of applications: This strategy can be used on various time intervals: H1 and H4 timeframes, making the trading advisor a highly versatile tool for trading.  the system works on comfortable USD crosses: USDCAD, USDCAD, and USDCAD pairs where you won't see overwhelming trends that wipe out deposits b
Hybrid Trend Impulse robot – is an advanced EA that combines modern approaches to trend and impulse analysis, offering unique capabilities for effective deposit management. Key advantages of the HybridTrendImpulse_robot: Nonlinear dynamics: The method of interaction between opening prices forms a unique nonlinear model that is particularly sensitive to significant price fluctuations, increasing their significance and making the indicator ideal for working in high volatility conditions. Enhanced
SynRhythmic Points Robot is an innovative trading strategy based on the combination of two analytical approaches, one focusing on short-term price changes and the other on identifying stable trends and dependencies. This synergy allows for obtaining excellent signals for entering the market while minimizing the influence of random fluctuations and reducing false signals. Additionally, the EA can easily adapt to various market conditions and be automated, making it convenient for both experienced
Filtrele:
Değerlendirme yok
Değerlendirmeye yanıt