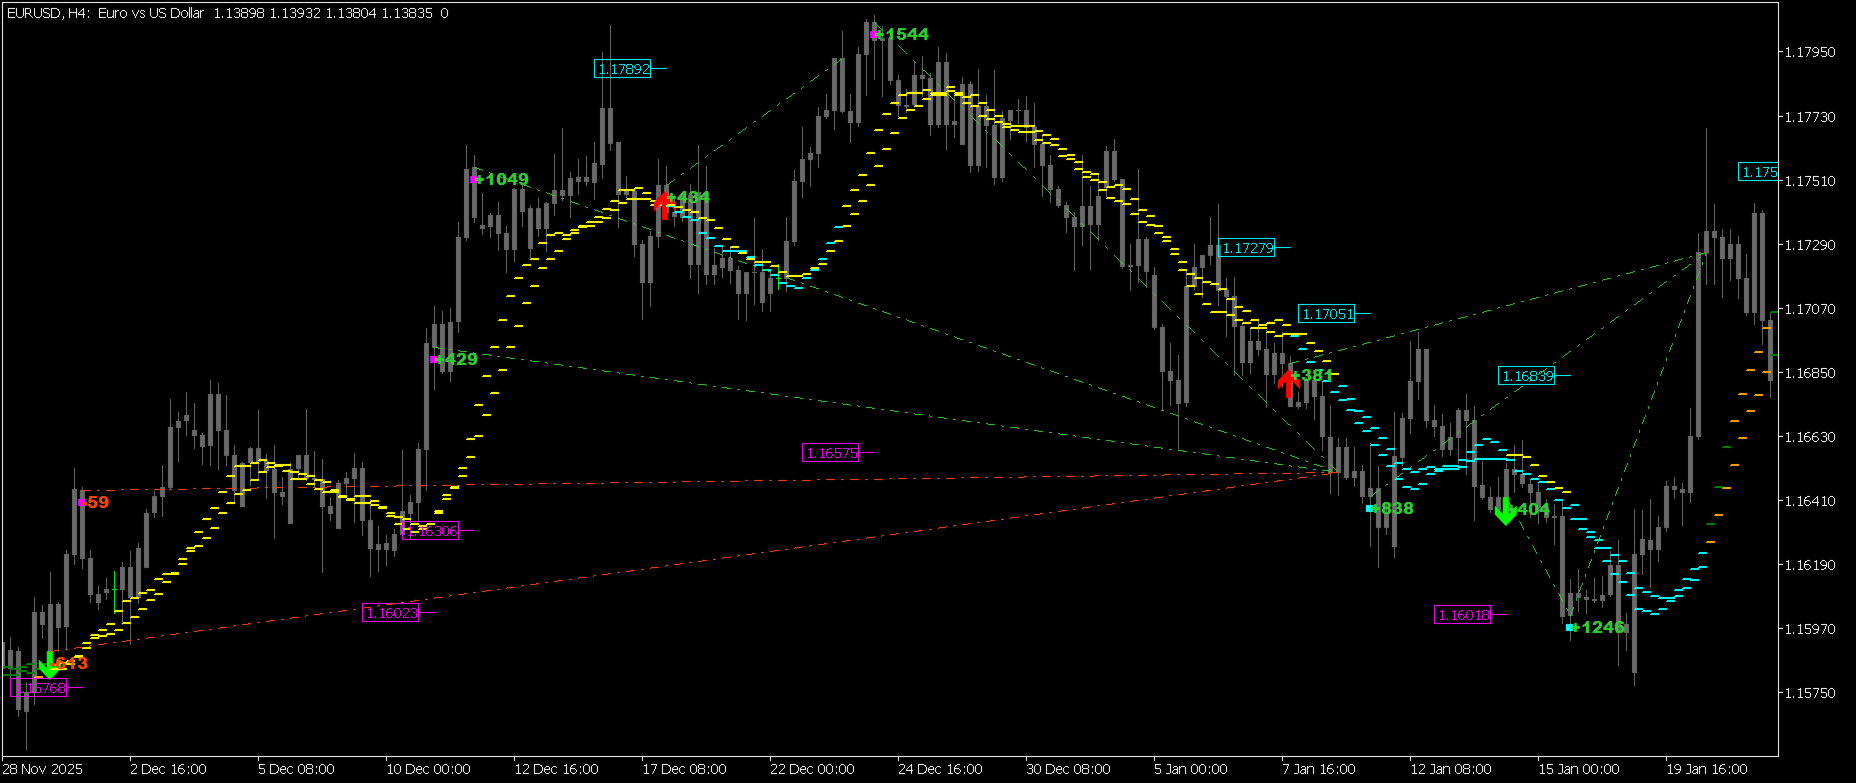
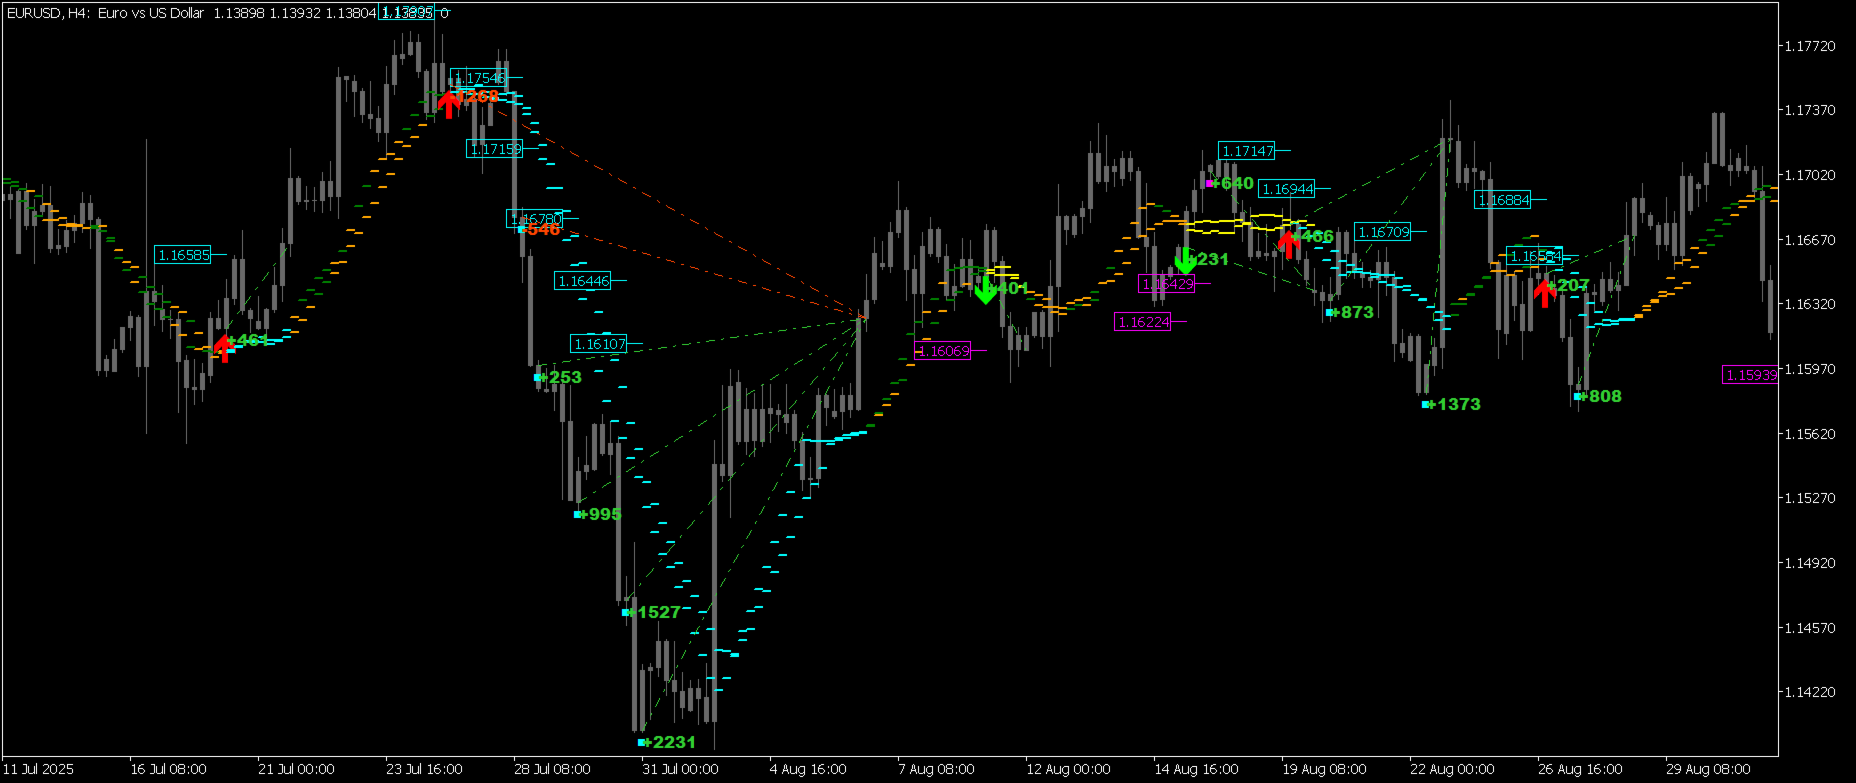
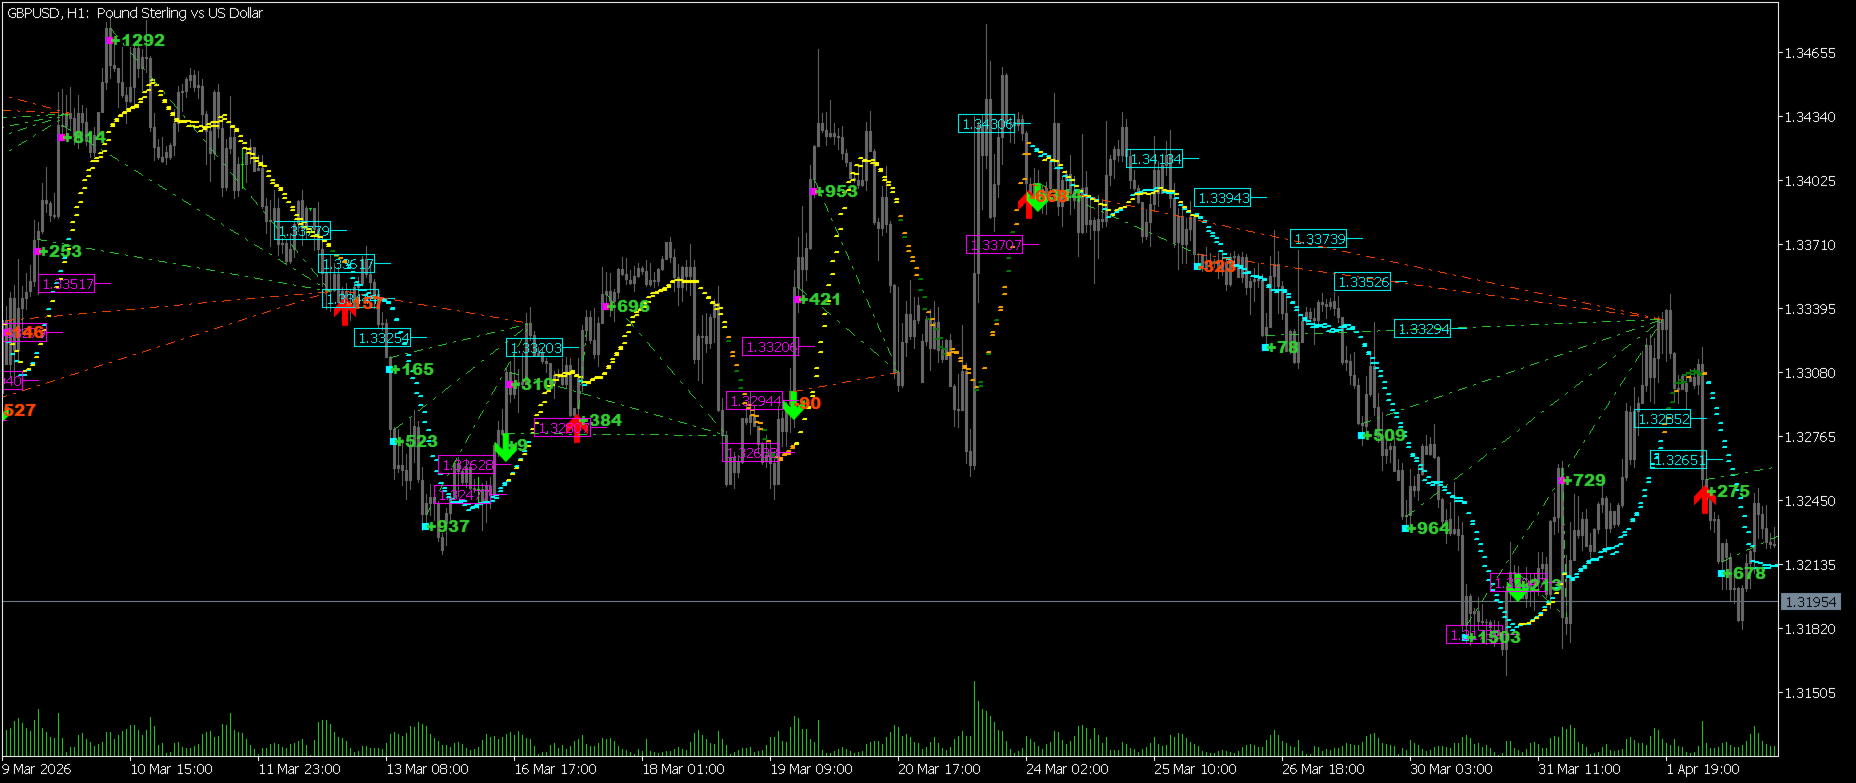
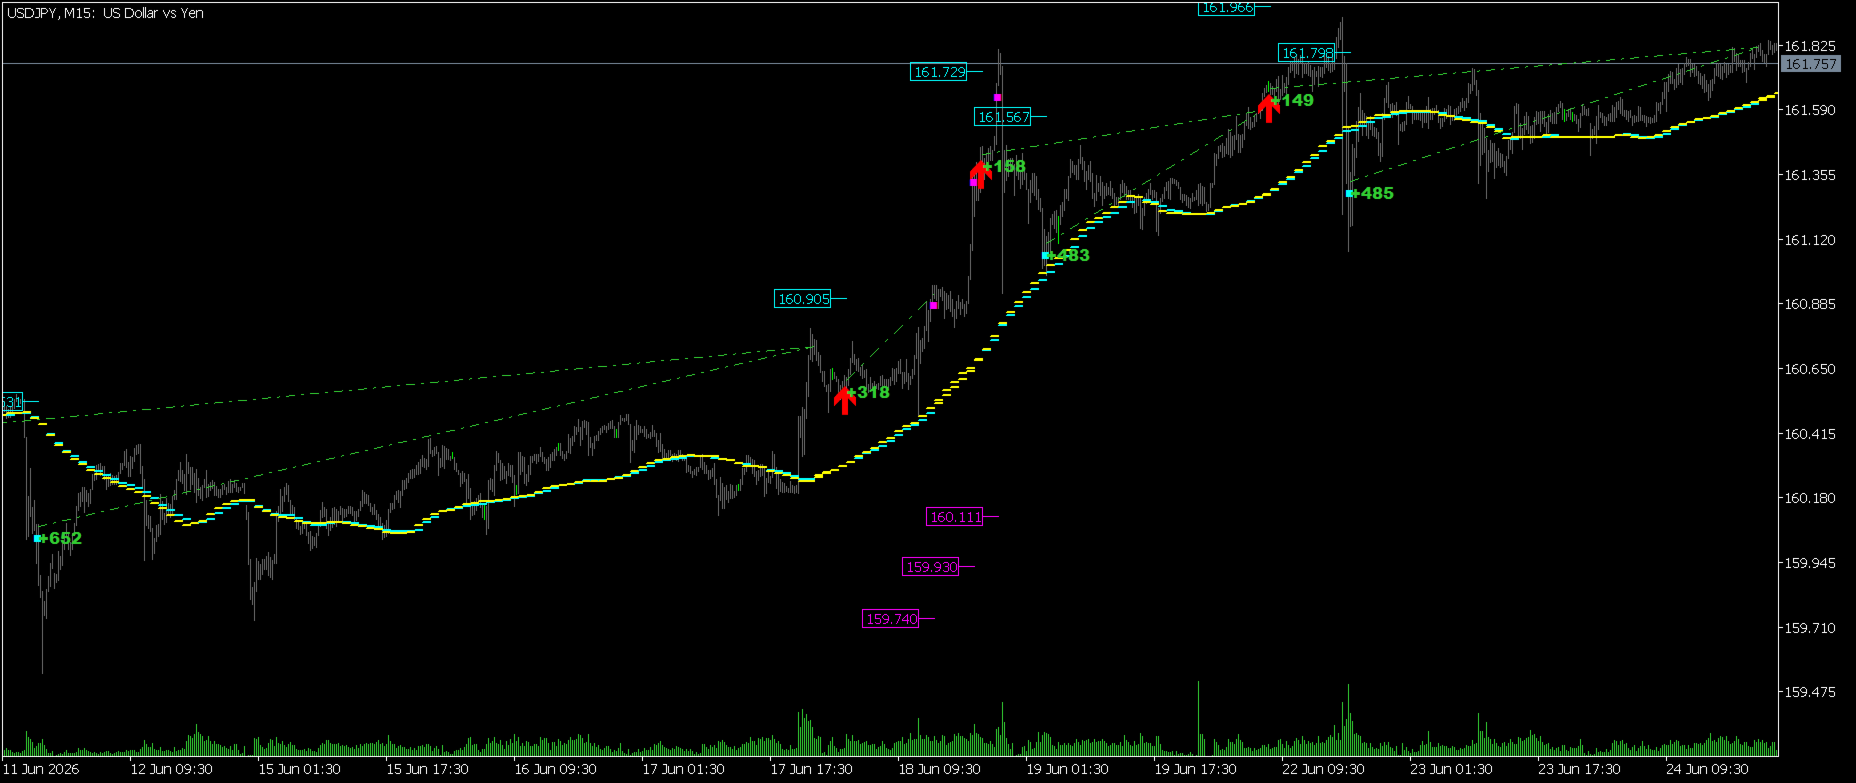
FlatOut Movings Indicator

FlatOut Movings Robot : Contrôle absolu du flat. Navigation sereine en tendance.
Les stratégies basées sur les moyennes mobiles partagent toutes un même cauchemar. Dès que le marché change de phase, votre capital commence à fondre comme neige au soleil. Les moyennes mobiles classiques génèrent des dizaines de faux croisements durant les phases de latéralisation. Quant aux filtres standards, ils accusent un retard impitoyable. Vous passez vos nuits stressé devant votre terminal, pour finir par entrer au tout dernier souffle du mouvement.
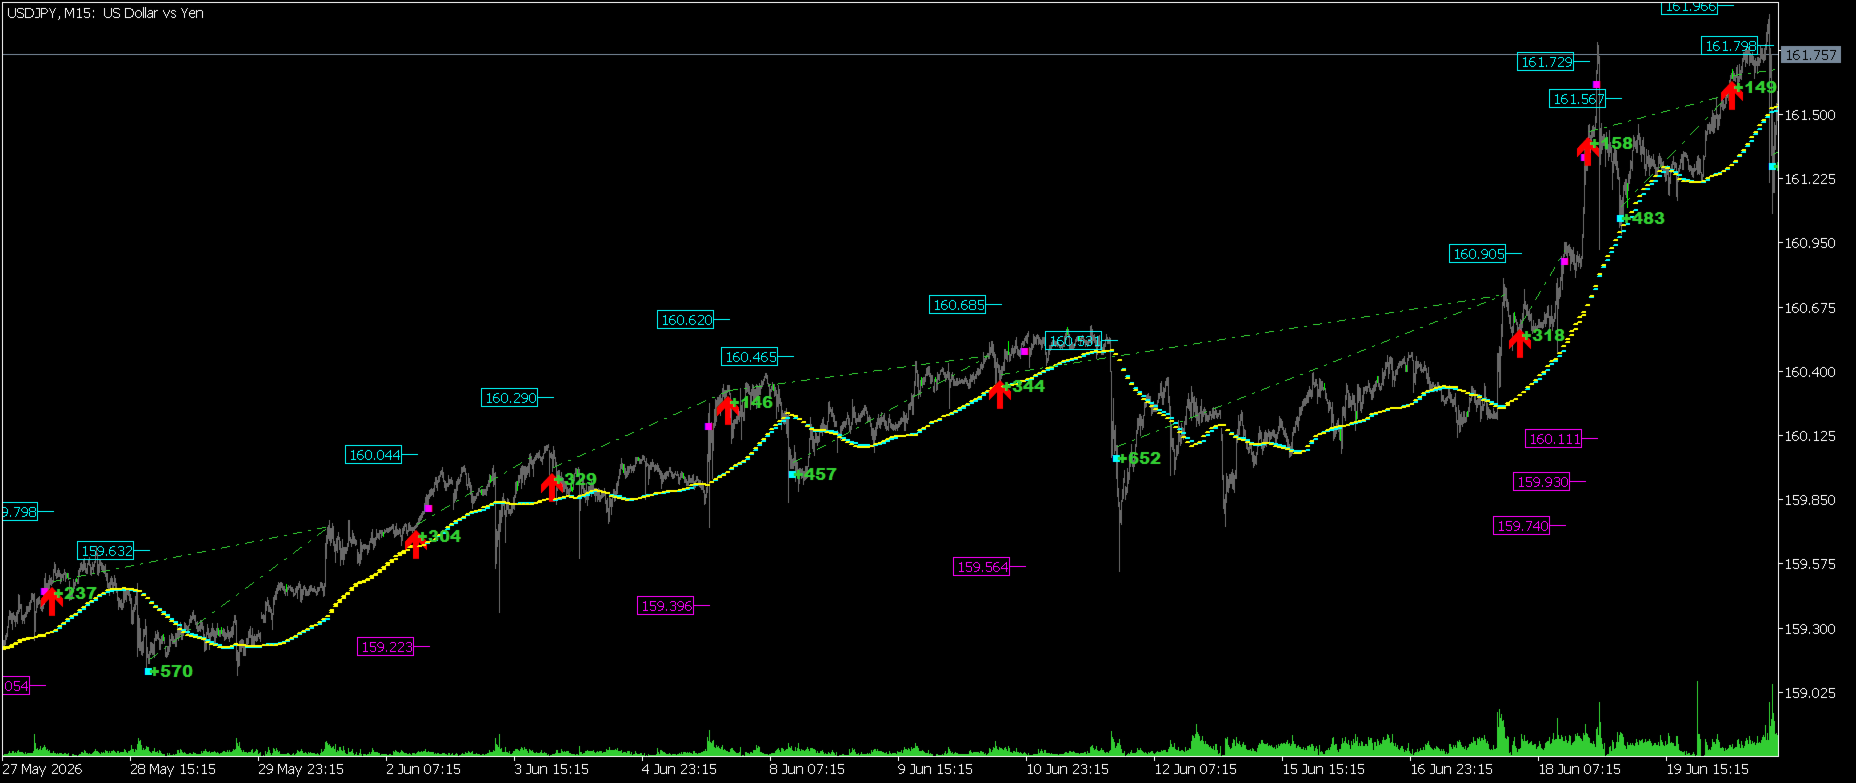
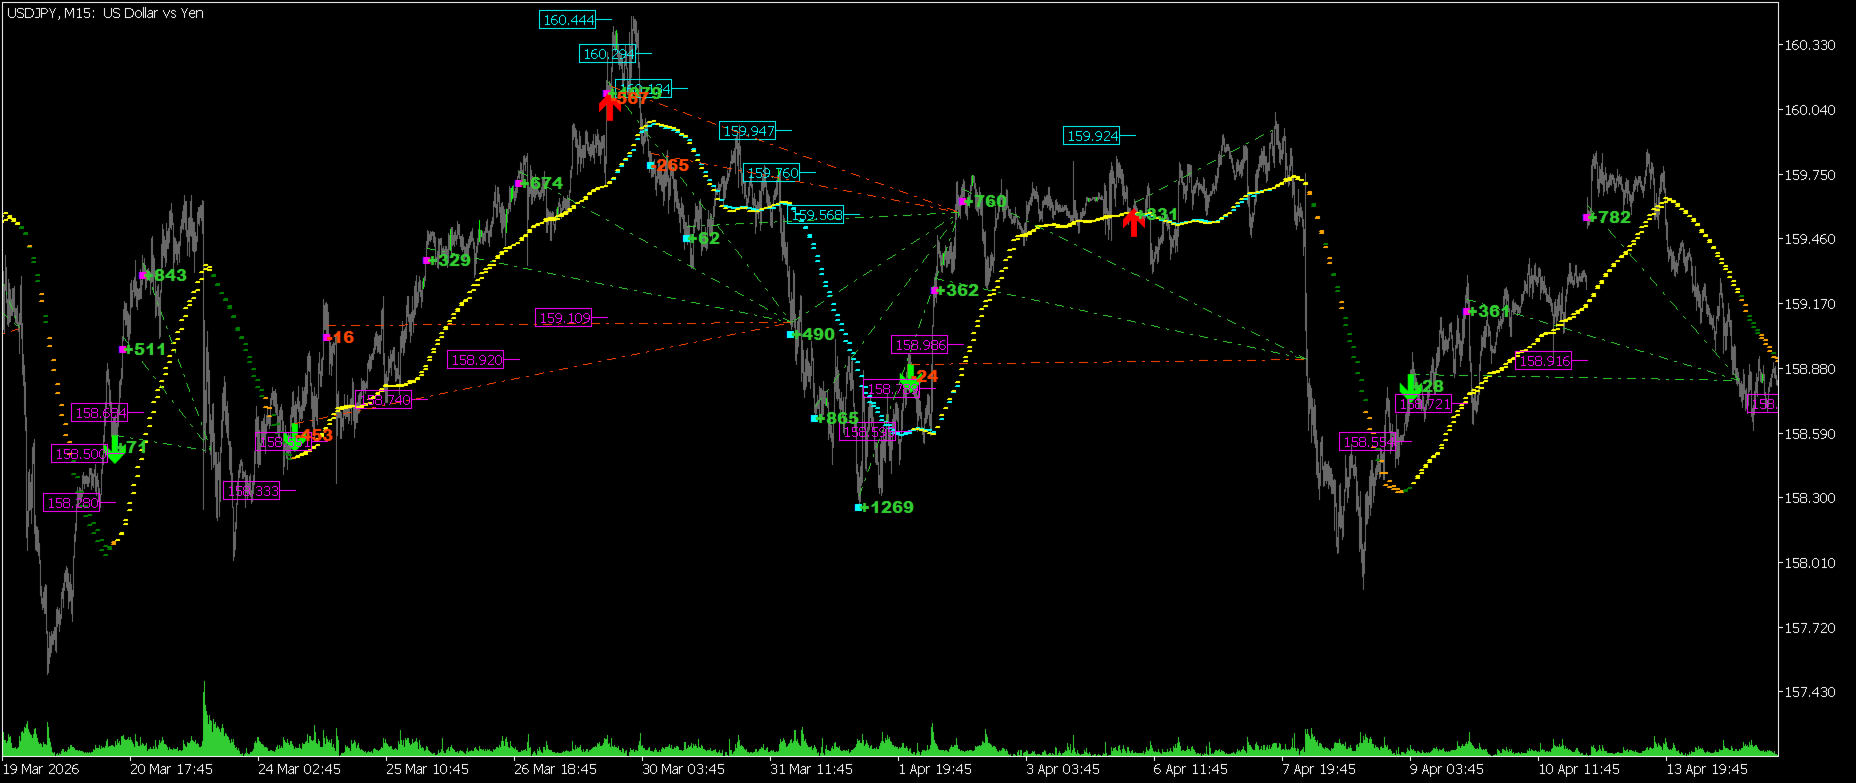
Ce logiciel a été conçu pour résoudre un problème bien précis. Le robot scanne le graphique en continu et déchiffre la structure du marché comme s'il en connaissait les secrets les plus intimes. Il négocie avec la même efficacité dans un range léthargique que lors d'impulsions tendancielles puissantes. Le système sépare d'un geste chirurgical la cassure réelle de la fausse sortie vers le canal de trading.
⏳ L'épreuve du temps face au chaos des marchés
Le cœur mathématique du logiciel a été éprouvé à travers dix ans de cycles de tempêtes de prix chaotiques qui se succèdent. L'algorithme est taillé pour résister à n'importe quelle crise financière globale et aux changements d'ères de marché.
⚡ Le chasseur d'impulsions : Le robot entre en position au point de non-retour, lorsque le prix s'élance sur la trajectoire de la moindre résistance. Les entrées sont si millimétrées que les positions ne subissent généralement presque aucune pression toxique à contre-tendance.
🤖 Le dominateur en série : Le robot ignore les errances chaotiques. Son comportement est soumis à un ordre mathématique rigoureux. S'il attrape la vague, il génère une cascade dense et continue de transactions clôturées. L'algorithme s'agrippe obstinément à la tendance, érigeant une position gagnante après l'autre, jusqu'à épuiser le souffle de l'impulsion du marché. Pour lui, les rares stop-loss ne sont pas une tragédie, mais un simple ajustement de sa ligne de mire.
↕️ Le balayage bilatéral du carnet d'ordres : Le robot fonctionne avec la même efficacité à l'achat (Long) qu'à la vente (Short). Le nombre de directions dans le rapport est équivalent. Aucun ajustement manuel aléatoire des paramètres sur l'historique.
⚙️ Le stratège Grid de fer : Dans les moments de flat prolongé ou de fausses cassures, il ne coupe pas sa position à la moindre baisse. Le robot enclenche un mode de siège positionnel, déployant une grille d'ordres élastique et répartie. Il absorbe de sang-froid le risque flottant, maintenant la pression de la marge sous un contrôle absolu.
🎯 Le sniper de sang-froid : Le logiciel attend patiemment le point d'entrée idéal, garantissant une efficacité mathématique remarquable et un puissant facteur de récupération.
🎁 Testez l'algorithme gratuitement
Vous n'êtes plus condamné à vivre jour et nuit sous tension devant votre écran, à consumer vos nerfs et votre temps. Cette solution technologique est clé en main. Cessez de croire les paroles d'autrui : éprouvez l'algorithme sur l'historique réel.
Saisissez dès maintenant votre outil de protection de capital !

   1. Cliquez sur le bouton « Télécharger la démo » sur cette page du Market.
   2. Ouvrez le testeur de stratégies dans votre terminal et sélectionnez la période historique de votre choix.
   3. Lancez le test et constatez par vous-même comment le système filtre le bruit du marché.

------------------------------
FAQ :

   1. Pour quelles paires ce produit est-il configuré ?
   Ce conseiller fonctionne techniquement sur n'importe quelle paire et utilise des paramètres par défaut. Néanmoins, il a été spécialement affûté pour opérer sur l'EURUSD, le GBPUSD et l'USDJPY.
   C'est précisément sur ces paires qu'il déploie toute son efficacité.
   2. Sur quelle unité de temps vaut-il mieux le lancer ?
   🦎 Le caméléon adaptatif : Pour lui, l'unité de temps n'est qu'une lentille optique. Sur les horizons courts (M15, M30, H1), il agit comme un scalper à tir rapide. Sur les périodes supérieures (H2 et H4), il élargit son pas, métamorphosant la densité du marché en décisions positionnelles monolithiques et filtrées. Le robot s'ajuste parfaitement à la densité des bougies, éliminant totalement le bruit de courtage intra-bougie.
   Vous pouvez ainsi lancer le produit sur M15, M30, H1, H2, H4.
   3. Quel type de compte convient au conseiller ?
   Un compte prenant en charge les ordres croisés (Hedging) est requis, car le système standard Netting est techniquement incompatible avec la logique du conseiller. Le meilleur choix sera les types de comptes ECN/Raw (pour les capitaux importants), Cent (pour les dépôts inférieurs à 10 000 $) ou Swap-Free, avec un effet de levier à partir de 1:100.
   4. Avec quel dépôt minimal peut-on commencer à trader ?
   Pour une seule paire, il faut compter 800 à 1000 sur un compte standard (ou 10 sur un compte cent). Pour deux ou trois paires, le montant augmente proportionnellement : 2K / 3K sur un compte standard (ou 20 / 30 sur un compte cent).
   5. Quel a été le drawdown historique du conseiller ?
   Le drawdown flottant maximal sur l'équité (Equity) au cours de 55 ans d'historique s'est élevé à : 7.08% pour l'EURUSD, 9.31% pour le GBPUSD et seulement 4.17% pour l'USDJPY.
   Le drawdown relatif sur le solde a oscillé historiquement autour de 2.27% – 16.95%.
   6. Peut-on faire fonctionner les three paires de devises en ensemble (avec des numéros magiques différents) ?
   Oui, et c'est tout à fait judicieux. Le lancement simultané sur l'EURUSD, le GBPUSD et l'USDJPY avec des Magic Numbers distincts active un effet de synergie : les paires s'échangent de manière indépendante, compensent mutuellement leurs drawdowns et génèrent un flux de trading stable et diversifié.
   7. Quels paramètres faut-il utiliser au démarrage ?
   📦 Autonomie totale dès la sortie de la boîte : Oubliez l'ajustement manuel des paramètres et la lecture de centaines de pages de manuels. Le produit est nativement optimisé selon le tempérament des paires de devises clés. Le robot scanne automatiquement le graphique, reconnaît la paire et se met instantanément au travail. Débuter est un jeu d'enfant en quelques clics. Il vous suffit d'attacher le conseiller au graphique d'une paire recommandée, de choisir l'unité de temps souhaitée et de configurer un Magic Number unique pour la diversification.
   8. Comment savoir si le indicator a commencé à travailler ?
   C'est très simple : activez le paramètre Enable: Detailed operational logs dans les réglages. Un texte indiquant le statut du système s'affichera directement sur l'écran, et les journaux d'activité commenceront à s'actualiser dans l'onglet « Experts » (générant des rapports détaillés toutes les 1 à 4 heures).
   9. Pourquoi l'écran se fige-t-il lors du changement d'unité de temps ?
   📸 L'instantané quantique du marché : Lors du premier lancement, d'un changement d'unité de temps ou d'une déconnexion, le terminal se fige un court instant pour mener un audit complet de tout l'historique. Le système s'accorde une pause afin d'exclure la moindre distorsion des prix et déployer un modèle mathématique irréprochable de protection des positions.
   10. Pourquoi l'ordre ne s'est-il PAS ouvert alors que le système l'a comptabilisé ?
   🔒 Autonomie numérique : La mathématique interne du robot prévaut sur la réalité du marché. C'est une fonctionnalité de protection unique du conseiller. Si, en raison d'une coupure de connexion ou de slippages du courtier, un ordre ne s'est pas ouvert dans la réalité, le robot l'intègre instantanément de manière virtuelle dans la mémoire de son modèle. Pour le robot, il est plus crucial de préserver l'intégrité stricte de son modèle mathématique — son bouclier ultime face au chaos du marché —, quitte à accepter une perte technique minime sur une grille. Un tel scénario reste extrêmement rare, car le robot effectue jusqu'à 10 tentatives pour ouvrir l'ordre tant que le prix oscille à l'ouverture de la bougie.
   11. L'indicateur repeint-il ses signaux et que se passe-t-il si j'éteins l'ordinateur ?
   L'indicateur ne accuse aucun retard et ne repeint pas ses signaux. Si vous éteignez votre terminal, le conseiller ne perdra rien : lors du redémarrage, il recalculera instantanément l'intégralité du modèle mathématique depuis le début de l'historique en se basant sur le Magic Number de vos ordres. Le principal danger lié à l'extinction du PC est de rater le moment de la fermeture de la grille au take-profit. C'est pourquoi l'utilisation d'un serveur VPS est vivement recommandée.
   12. Pourquoi l'indicateur n'a-t-il pas de buffers et à quel rythme le produit travaille-t-il ?
   L'indicateur n'utilise pas de buffers, mais affiche ses signaux via des objets graphiques (lignes, flèches). Cela évite de stocker un historique inutile en mémoire et accélère les calculs de manière exponentielle. Immunité face aux pics de prix : Le produit ne s'actualise pas à chaque tick ni à l'intérieur d'une barre, mais se corrèle strictement aux prix d'ouverture des bougies H1 ou H4. Cela protège intégralement l'algorithme contre le bruit du marché, les mèches trompeuses et les chasses aux stops.
   13. Que se passe-t-il si le courtier voit mes objectifs et provoque un pic de prix pour liquider mes positions ?
   🥷 Le mode furtif : C'est techniquement impossible grâce au mode invisibilité. Le robot s'appuie sur un algorithme d'ordres virtuels : tous les niveaux de prix réels et les objectifs résident exclusivement dans la mémoire du conseiller et demeurent totalement masqués pour le serveur du courtier. La chasse à vos stop-loss est irréalisable, car le courtier ne voit tout simplement pas où le système prévoit de dénouer ses positions.
   14. Que se passe-t-il si la grille d'ordres devient trop importante ?
   🛡️ Le fusible de capital : Pour parer à cette éventualité, un fusible de sécurité est intégré — le paramètre Risk: Enable grid depth protection. Vous pouvez limiter strictement le nombre maximal d'ordres au sein de la grille (par exemple, pas plus de 8). Si le marché se retourne contre le système et que la profondeur du drawdown atteint ce seuil critique, le robot déleste automatiquement la charge, coupant court aux risques afin de préserver au maximum votre capital principal.

Produits recommandés
Indicateur de momentum Squeeze pour MT5 Découvrez des opportunités de marché explosives grâce au puissant indicateur de momentum Squeeze, développé par des professionnels pour MetaTrader 5. Cet indicateur avancé de volatilité et de momentum aide les traders à identifier les périodes de faible volatilité avant les mouvements de marché majeurs. Combinant la puissance des bandes de Bollinger et des canaux de Keltner, il révèle les phases de « compression » du marché, annonçant une cassure immine
AURUM MID-QUANT PRO v5.60 L'Excellence Quantitative pour le Trading de l'Or (XAU/USD) & de la Volatilité Prenez une longueur d'avance sur les marchés institutionnels avec AURUM MID-QUANT PRO , le moteur de détection de motifs d'action des prix ( Price Action ) et de cassures de niveaux ( Breakout Engine ) le plus abouti sur MetaTrader 5. Développé sur mesure pour capturer la volatilité de l'Or et des actifs majeurs, cet indicateur combine une détection algorithmique ultra-précise et une cartog
Introduction to Fractal Pattern Scanner Fractal Indicator refers to the technical indicator that makes use of the fractal geometry found in the financial market. Fractal Pattern Scanner is the advanced Fractal Indicator that brings the latest trading technology after the extensive research and development work in the fractal geometry in the financial market. The most important feature in Fractal Pattern Scanner is the ability to measure the turning point probability as well as the trend probabil
Obrigado por adquirir o detector de picos otimizado. Para instalação, ativação, atualizações ou suporte técnico, entre em contato comigo pelo WhatsApp: +258 86 756 5485. O Optimized Spike Detector Pro para MT5 é um indicador técnico de nível profissional projetado para identificar e capitalizar movimentos de preço bruscos e impulsivos (picos) em qualquer instrumento financeiro. Utilizando um núcleo sofisticado com múltiplos algoritmos, ele distingue expansões significativas de volatilidade do r
Trend Arrow Super Special offer -  https://www.mql5.com/en/users/bossik2810 The indicator does not redraw and does not change its data. Professional but very easy to use Forex system. The indicator gives accurate BUY\SELL signals. Trend Arrow Super is very easy to use, you just need to attach it to the chart and follow simple trading recommendations. Buy signal: Arrow + histogram in green color, enter immediately on the market to buy. Sell signal: Arrow + Histogram in red color, enter imme
Il s'agit d'un scanner multi-symboles et multi-unités de temps pour notre indicateur ACB Breakout Arrows . Avec les paramètres par défaut, il analyse les signaux d'achat/vente sur 28 paires de devises et 9 unités de temps simultanément .  Fonctionnalités Peut analyser 252* combinaisons de symboles et d’unités de temps depuis un seul graphique. Ouvrez le graphique du signal avec un modèle prédéfini en un seul clic.  Déplacement facile du panneau n’importe où sur le graphique par glisser-déposer.
MFOP Market Forecast
Oscar Josue Pin Bacuzoy
Develop this indicator for periods of 30 minutes or more, focus on getting market trends right and making sure they are met. MFOP v8.1 gets straight to the point: it scans the market and tells you exactly when there is enough strength to enter a trade. This indicator doesn't do magic, it uses mathematical algorithms to filter out market noise, not enter into false breakouts and show you clear BUY (blue arrow) and SELL (red arrow) opportunities. It is designed and optimized specifically to take
Cet indicateur est un indicateur d'analyse automatique des vagues, parfait pour le trading pratique ! Cas... Remarque :   je n'ai pas l'habitude d'utiliser des noms occidentaux pour l'évaluation des vagues. En raison de l'influence de la convention de dénomination de Tang Lun (Tang Zhong Shuo Zen), j'ai nommé la vague de base comme   un stylo   et la bande d'onde secondaire comme   un segment   . en même temps, le segment a la direction de la tendance.Le   segment de tendance principal   est no
CISD Levels Pro automatically draws CISD Buy and Sell levels directly on your chart. It highlights pending levels while they are forming, then marks confirmed levels after the confirmation candle closes. Optional confirmation arrows help you spot the signal quickly. This tool is designed for traders who want clean, simple CISD level visualization without extra indicators or clutter. Key Features Draws Bullish (BUY) CISD levels and Bearish (SELL) CISD levels Shows Pending levels (dashed) and
The indicator scans for TD Combo signals in multiple timeframes for the all markets filtered and shows the results on Dashboard. Key Features Dashboard can be used for all markets It can scan for signals on MN1, W1, D1, H4, H1, M30, M15 ,M5, M1 timeframes Parameters UseMarketWatch: Set true to copy all symbols available in market watch MarketWatchCount : Set the number of symbols that you want to copy from the market watch list. CustomSymbols: Enter the custom symbols that you want to be availa
Harraz Master HUD
Muhammad Azraf Bin Dzul Fauzi
HARRAZ MASTER HUD v4.4 - The Ultimate Neural Trading Command Center ​ Transform your MetaTrader 5 into a professional, institutional-grade trading terminal. Harraz Master HUD is not just an indicator; it is a complete Artificial Intelligence ecosystem designed specifically for XAUUSD (Gold) and major pairs. ​ EXCLUSIVE FEATURES: ​1. Live Neural AI Typewriter (Jarvis Mode) Experience a live, animated Heads-Up Display that types out real-time market sentiment and advice. It acts as your persona

Xtrade Trend Detector
Dago Elkana Samuel Dadie
Xtrade Trend Detector est un indicateur capable de trouver les meilleures opportunités pour prendre position sur n'importe quel marché boursier. En effet, il est taillé pour les scalpers mais aussi pour les Daytraders. Vous pourriez donc vous en servir pour repérer les zones à trader, il s’intègre facilement sur graphique. Je l'utilise pour detecter les tendances sur les grandes unités de temps et prendre positions sur les petites unités de temps. N’hésitez pas à me contacter si vous avez des qu
Indicateur Crypto_Forex « Histogramme de tendance » pour MT5, sans refonte. - L'indicateur Histogramme de tendance est beaucoup plus sensible et efficace que les moyennes mobiles croisées standard. - L'indicateur est disponible en deux couleurs : jaune (doré) pour une tendance baissière et vert pour une tendance haussière (les couleurs peuvent être modifiées dans les paramètres). - L'Histogramme de tendance intègre des alertes mobiles et PC. - Il est judicieux de combiner cet indicateur avec d'
Link to our best products: LINK Link to our Trading Dashboard: LINK !!!!!!! Attention, you can find premium discounts by clicking on arrows!!!!!! Setting of this indicator candles mode: Show zones from the beginning Swing number for highs and lows Show background color Color of Premium Color of Discount show level 0% line show level 25% line show level 50% line show level 75% line show level 100% line The Premium and Discount concept is a core principle of Smart Money Concepts (SMC) used to i
Smart Reversal Prophets
Loys Steve Dzene Tagne
Vous avez toujours rêvé de pouvoir entrer dans le marché juste après la clôture d'une bougie… et voir le marché partir immédiatement dans votre direction ? Vous avez toujours voulu détecter les retours plus tôt, éviter les faux signaux, et surtout capturer les longues tendances avant la majorité des traders ? Alors aujourd'hui, je vais vous présenter mon nouvel indicateur : Prophète du retournement intelligent. Contrairement aux indicateurs classiques qui réagissent avec retard, Smart Reversal
L'indicateur aide à entrer dans un commerce en suivant la tendance, en même temps, après une certaine correction. Il trouve de forts mouvements de tendance d'une paire de devises sur un nombre donné de barres, et trouve également des niveaux de correction à cette tendance. Si la tendance est suffisamment forte et que la correction devient égale à celle spécifiée dans les paramètres, l'indicateur le signale. Vous pouvez définir différentes valeurs de correction, les valeurs de 38, 50 et 62 (nive
Sigma VWAP Bands Sigma VWAP Bands (Rolling) is a technical analysis indicator that plots upper and lower bands based on the statistical deviation of price from a rolling Volume-Weighted Average Price (VWAP). The indicator is designed to visualize price dispersion around VWAP using a user-defined lookback window and a configurable standard deviation multiplier. Parameters Lookback Period Number of bars used for VWAP and standard deviation calculations. Sigma Factor Multiplier applied to the cal
Apex Institutional Reversal
Sami Eid Fahid Almashaqbeh
Apex Institutional Reversal is an advanced Smart Money Concepts (SMC) and ICT trading framework designed to identify high-probability market reversals, continuation phases, and institutional exhaustion zones before they become obvious to retail traders. This is not another lagging oscillator or generic overbought/oversold tool. Apex Institutional Reversal acts as a market regime intelligence system that combines statistical trend analysis, fractal market behavior, and institutional momentum dia
. . is designed for traders who want a clean and practical way to identify bullish and bearish trend changes directly on the MT5 chart. The indicator uses a dual high/low smoothing engine to detect market direction and show a clear active trend line. When the market confirms a bullish or bearish flip
Trading concept: When price touches or exceeds the upper circle boundary = potential sell signal (overbought) When price touches or falls below the lower circle boundary = potential buy signal (oversold) The circle acts like a dynamic support/resistance band around the opening price The numbered points (1-24) help identify where in the cycle the price currently is This is similar to using Bollinger Bands or other envelope indicators, but with a fixed radius instead of standard deviations.
the fundamental technical indicator Informative Trend, which allows you to assess the current market situation in order to enter the market of the selected currency pair in a trend and with minimal risk. It basically uses the process of identifying the rate of change in price growth and allows you to find entry and exit points from the market. The indicator was created on the basis of the original indicators for searching for extreme points and is well suited for determining a reversal or a la
This indicator is based on a mathematical formula which gives you the possibility to seek and find the right frequency of the movement, and to determine its key level; just adjust the frequency parameter! Simple and highly effective; using this indicator you can easily predict the next support and  resistance    levels of the day. Also, this indicator determines the range and the next two importants levels of the movement outside this range so far. SGFL3 and RGFL3  are levels with high certainty
The  OBV MTF  is an Enterprise-grade On-Balance Volume indicator that transforms standard OBV into a complete trading system. It combines gradient-aware momentum analysis, divergence detection, multi-timeframe alignment, and dynamic customisable midpoint-filtering in a single intuitive professional volume analysis tool. Core Features 1. 5-State Momentum Engine Aqua (Strong Bullish) : OBV slope rising with positive acceleration SteelBlue (Weak Bullish) : OBV rising but losing momentum Gray (Neutr
Visual Trend Reversals — Professional Trend Reversal Indicator for MetaTrader 5 Visual Trend Reversals is a modern and efficient indicator for MetaTrader 5, specifically designed for the timely identification of trend reversal points and analysis of market conditions on any instrument: forex, cryptocurrencies, stocks, indices, and commodities. The indicator is optimized to improve entry quality, minimize false signals, and maximize clarity for traders of any experience level. Key Advantages of V
This indicator works on atr with some edited . The AI ​​MACD FILTER indicator is used for confirmation. Certainly, the indicator contains an alert when the signal appears, and you use the exit of the deal on the saturation that occurs at the AI ​​MACD. The accuracy of the work is high on gold, the time frame is five minutes, while staying away from trading at the time of news that occurs on the US dollar. And using high liquidity trading times, which are two hours before the opening of the Lond
LZ Candle Timer
Lukasz Tomasz Zychal
LZ Candle Timer displays the remaining time before the current bar closes and a new bar forms. It helps you manage entries and exits around candle closes. The indicator uses server time, updates every second, and is optimized for smooth display with minimal CPU use. Feature highlights - Selectable location: place the timer in any of the four chart corners (Upper Left, Upper Right, Lower Left, Lower Right). Offsets and padding are configurable. - Alarm colour: when fewer than X seconds remain
FREE
Linear Trend Predictor - Un indicateur de tendance qui combine des points d'entrée et des lignes de support de direction. Fonctionne sur le principe de franchissement du canal des prix haut/bas. L'algorithme de l'indicateur filtre le bruit du marché, prend en compte la volatilité et la dynamique du marché. Capacités de l'indicateur  À l'aide de méthodes de lissage, il montre la tendance du marché et les points d'entrée pour l'ouverture d'ordres d'ACHAT ou de VENTE.  Convient pour déterminer l
ForexFanclub(FFC) : For detailed instructions and our official website, please visit my profile ! InteractiveMA: Real-Time Moving Average Control Stop wasting time opening settings dialogs just to tweak your Moving Average. InteractiveMA puts complete control of your trend analysis directly at your fingertips, allowing you to cycle through MA types and periods instantly on the chart. Whether you are a scalper needing rapid adjustments or a long-term trader refining your entry, this tool makes yo
FREE
If you are unsure how to use this indicator, please feel free to reach out to me. I will explain it to you and provide reading materials to help you make the most of it. TD Sequential Scanner: An Overview The TD Sequential scanner is a powerful technical analysis tool designed to identify potential price exhaustion points and trend reversals in financial markets. Developed by Tom DeMark, this method is widely used by traders to gauge market cycles and potential turning points with precision. Ho
Les acheteurs de ce produit ont également acheté
Neuro Poseidon MT5
Daria Rezueva
4.85 (54)
Neuro Poseidon is a new indicator by Daria Rezueva. It combines precise trading signals with adaptive TP/SL levels - creating best possible trades as a result! Message me and get  Neuro Poseidon Assistant  as a gift to automize your trading process! What makes it stand out? 1. Proven profitability on all assets and timeframes 2. Only confirmed BUY and SELL signals present on the chart 3. Adaptive TP & SL levels generated by the software for each trade 4. Easy to understand - suitable for al
L'indicateur UZFX {SSS} Scalping Smart Signals v4.0 MT5 est un indicateur de trading haute performance sans « repaint », conçu pour les scalpers, les day traders et les swing traders qui recherchent des signaux précis et en temps réel sur des marchés très volatils. Développé par (UZFX-LABS), cet indicateur combine l'analyse de l'action des prix, la confirmation de tendance et un filtrage intelligent pour générer des signaux d'achat et de vente à forte probabilité, des signaux d'alerte et des opp
Gem SIGNAL
Shengzu Zhong
5 (1)
GEM Signal Pro GEM Signal Pro est un indicateur de suivi de tendance pour MetaTrader 5, conçu pour les traders qui souhaitent des signaux plus clairs, des configurations de trade plus structurées et une gestion du risque plus pratique directement sur le graphique. Au lieu d’afficher simplement une flèche, GEM Signal Pro aide à présenter l’idée complète du trade de manière plus claire et plus lisible. Lorsque les conditions sont confirmées, l’indicateur peut afficher le prix d’entrée, le stop los
Ace Trend
Mikhail Sergeev
5 (3)
Nous vous présentons un indicateur révolutionnaire qui change les règles du jeu dans le monde du trading de tendance. L'indicateur est conçu pour repenser les performances et élever votre expérience de trading à un niveau sans précédent. Notre indicateur dispose d'une combinaison unique de fonctionnalités avancées qui le distinguent de ses concurrents. La technologie de pointe "Real Pricing Factors" offre une durabilité inégalée, même dans les conditions de marché les plus difficiles et les plus
Azimuth Pro
Ottaviano De Cicco
5 (7)
Azimuth Pro V2: Synthetic Fractal Structure and Confirmed Entries for MT5 Overview Azimuth Pro is a multi-level swing structure indicator by Merkava Labs . Four nested swing layers, swing-anchored VWAP, ABC pattern detection, three-timeframe structural filtering, and closed-bar confirmed entries — one chart, one workflow from micro-swings to macro-cycles. This is not a blind signal product. It is a structure-first workflow for traders who care about location, context, and timing. ️ Summer Sale
PrimeScalping
Temirlan Kdyrkhan
PrimeScalping is a powerful trading companion designed to generate high-probability entry signals with dynamic TP/SL/DP levels based on volatility. Built-in performance tracking shows win/loss stats, PP1/PP2 hits, and success rates — all updated live. Key Features: Buy/Sell signals with adaptive volatility bands Real-time TP/SL/DP levels based on ATR Built-in MA Filter with optional ATR/StdDev volatility Performance stats panel (Success, Profit/Loss, PP1/PP2) Alerts via popup, sound, push, or e
TrendMaestro5
Stefano Frisetti
note: this indicator is for METATRADER4, if you want the version for METATRADER5 this is the link:  https://www.mql5.com/it/market/product/108106 TRENDMAESTRO ver 2.5 TRENDMAESTRO recognizes a new TREND from the start, he never makes mistakes. The certainty of identifying a new TREND is priceless. DESCRIPTION TRENDMAESTRO identifies a new TREND in the bud, this indicator examines the volatility, volumes and momentum to identify the moment in which there is an explosion of one or more of these da
FX-AIEA Smart Supply and Demand Zone Identification Indicator (Supply and Demand Indicators MT5) Version: 2.51 | Compatible Platform: MetaTrader 5  Why do trades need supply and demand zones? Supply and demand zones are the core manifestation of institutional order flow, reflecting real buying and selling power more accurately than traditional support and resistance. However, manual drawing is not only time-consuming but also highly subjective and prone to missing key areas. FX-AIEA Supp
AriX
Temirlan Kdyrkhan
1 (4)
AriX Indicator for MT5 A powerful trend-following and signal-evaluation tool AriX is a custom MT5 indicator that combines Moving Averages and ATR-based risk/reward logic to generate clear buy/sell signals. It visualizes dynamic SL/TP levels, evaluates past trade outcomes, and displays win/loss statistics in a clean on-chart panel. Key features include: Buy/Sell signals based on MA crossovers ATR-based SL/TP1/TP2/TP3 levels with visual lines and labels Signal outcome tracking with real-time stat
SmartScalping
Temirlan Kdyrkhan
SmartScalping is a powerful trading companion designed to generate high-probability entry signals with dynamic TP/SL/DP levels based on volatility. Built-in performance tracking shows win/loss stats, PP1/PP2 hits, and success rates — all updated live. Key Features: Buy/Sell signals with adaptive volatility bands Real-time TP/SL/DP levels based on ATR Built-in MA Filter with optional ATR/StdDev volatility Performance stats panel (Success, Profit/Loss, PP1/PP2) Alerts via popup, sound, push, or e
ScalpPoint
Temirlan Kdyrkhan
ScalpPoint is a powerful trading companion designed to generate high-probability entry signals with dynamic TP/SL/DP levels based on volatility. Built-in performance tracking shows win/loss stats, PP1/PP2 hits, and success rates — all updated live. Key Features: Buy/Sell signals with adaptive volatility bands Real-time TP/SL/DP levels based on ATR Built-in MA Filter with optional ATR/StdDev volatility Performance stats panel (Success, Profit/Loss, PP1/PP2) Alerts via popup, sound, push, or emai
ZAB Supply Demand MTF automatically detects institutional supply and demand zones across up to 9 timeframes and draws them directly on your chart. Based on Sam Seiden's methodology, this indicator identifies the exact zones where banks and institutions placed their orders. Why This Indicator? Unlike basic support/resistance tools, ZAB Supply Demand MTF classifies every zone by its formation pattern and merges overlapping zones from different timeframes into high-probability confluence areas. Key
RelicusRoad Pro MT5
Relicus LLC
4.96 (24)
RelicusRoad Pro : Système d'Exploitation Quantitatif du Marché 70% DE RÉDUCTION ACCÈS À VIE (DURÉE LIMITÉE) - REJOIGNEZ 2 000+ TRADERS Pourquoi la plupart des traders échouent-ils même avec des indicateurs "parfaits" ? Parce qu'ils tradent des concepts isolés dans le vide. Un signal sans contexte est un pari. Pour gagner, il faut de la CONFLUENCE . RelicusRoad Pro est un Écosystème Quantitatif complet . Il cartographie la "Fair Value Road", distinguant le bruit des cassures structurelles. Arrête
KT Alpha Hunter Arrows MT5
KEENBASE SOFTWARE SOLUTIONS
La plupart des indicateurs à flèches vous donnent un signal, puis vous laissent gérer tout le reste seul. KT Alpha Hunter Arrows vous fournit un plan de trading complet. Chaque flèche de signal apparaît avec un plan complet déjà tracé : ligne d’entrée, stop loss, quatre niveaux de take profit et un verdict d’edge en temps réel qui vous indique si ce symbole et cette unité de temps valent la peine d’être tradés maintenant. Le Trade Manager EA inclus prend en charge l’exécution après votre entrée,
VTrende Pro
Andrii Diachenko
5 (1)
VTrende Pro - MTF indicator for trend trading with a display panel for MT5 *** Videos can be translated into any language using subtitles (video language - Russian) Although the signals of the VTrende Pro indicator can be used as signals of a full-fledged trading system, it is recommended to use them in conjunction with the Bill Williams TS. VTrende Pro is an extended version of the VTrende indicator. Difference between Pro version and VTrende: - Time zones - Signal V - signal 1-2 waves -    S
TrendProMaster
Temirlan Kdyrkhan
MasterTrend Indicator for MT5 A powerful trend-following and signal-evaluation tool MasterTrend   is a custom MT5 indicator that combines Moving Averages and ATR-based risk/reward logic to generate clear buy/sell signals. It visualizes dynamic SL/TP levels, evaluates past trade outcomes, and displays win/loss statistics in a clean on-chart panel. Key features include: Buy/Sell signals based on MA crossovers ATR-based SL/TP1/TP2/TP3 levels with visual lines and labels Signal outcome tracking wit
MasterTrend
Temirlan Kdyrkhan
MasterTrend Indicator for MT5 A powerful trend-following and signal-evaluation tool MasterTrend   is a custom MT5 indicator that combines Moving Averages and ATR-based risk/reward logic to generate clear buy/sell signals. It visualizes dynamic SL/TP levels, evaluates past trade outcomes, and displays win/loss statistics in a clean on-chart panel. Key features include: Buy/Sell signals based on MA crossovers ATR-based SL/TP1/TP2/TP3 levels with visual lines and labels Signal outcome tracking wit
L’indicateur met en évidence les zones où un intérêt est déclaré sur le marché , puis montre la zone d’accumulation des ordres . Il fonctionne comme un carnet d’ordres à grande échelle . C’est l’indicateur destiné aux grands capitaux . Ses performances sont exceptionnelles. Quel que soit l’intérêt présent sur le marché, vous le verrez clairement . (Il s’agit d’une version entièrement réécrite et automatisée – l’analyse manuelle n’est plus nécessaire.) La vitesse de transaction est un indicateur
Introducing the South African Sniper Indicator Created by a dedicated team of South African traders with years of profitable experience in the financial markets, the South African Sniper Indicator is designed to give traders a sharp edge — combining simplicity, precision, and power in one tool. This is a plug-and-play indicator for MT5, built to deliver accurate BUY and SELL (Sniper Entry) signals — complete with target levels and automated trailing stops. Whether you trade forex, indice
Détecteur intelligent multicouche de cassure et de retracement pour MetaTrader 5 « Intelligent. Simple. Rapide ! » Vous en avez assez de rater des entrées sur cassure à haute probabilité ? Passez-vous des heures à analyser de nombreux graphiques pour aligner les cassures avec la direction de la tendance et le momentum des devises — pour finalement manquer le mouvement ? Break Pullback résout tout cela en un seul indicateur. Qu'est-ce que Break Pullback ? Break Pullback est un indicateur MetaTr
Indicateur MT5 Voyez ce que le marché fait vraiment.   Visualisez les 3 phases de marché en direct devant vous (Contraction, Expansion, Tendance) et prenez de meilleures entrées dès le   début de la phase de Tendance.      Arrêtez de deviner. Commencez à lire le marché comme le font les institutions et le smart money.   Apex Market Structure Pro pour MT5 est un outil d'analyse smart-money de précision qui élimine le bruit et vous révèle la   véritable structure sous chaque bougie : liquidité
OrderFlow Absorption – Indicateur professionnel de delta et de signaux d’absorption pour MT5 Libérez la puissance de l’analyse réelle du flux d’ordres avec OrderFlow Absorption – l’indicateur ultime d’histogramme delta et de signaux d’absorption pour MetaTrader 5. Conçu pour les traders qui veulent comprendre ce qui se passe réellement derrière chaque mouvement de prix, cet outil révèle la pression d’achat/vente cachée et les événements d’absorption qui font bouger le marché. Fonctionnalités Vis
Btcusd Pro
Metin Erkamoglu
BTCUSD PRO Signal Solution for MT5 BTCUSD PRO is a decision-support indicator for MetaTrader 5, designed for traders who analyze BTCUSD or BTCUSD# with a structured signal workflow. The product is not an automated trading system. It does not open, close, or manage trades automatically. It provides analytical buy and sell signal information and displays a visual trade plan on the chart so the user can make their own trading decisions. Main purpose BTCUSD PRO is designed for traders who prefe
Meravith MT5
Ivan Stefanov
5 (3)
Outil des market makers. Meravith va : Analyser toutes les unités de temps et afficher la tendance actuellement en vigueur. Mettre en évidence les zones de liquidité (équilibre des volumes) où le volume haussier et baissier est égal. Afficher tous les niveaux de liquidité provenant de différentes unités de temps directement sur votre graphique. Générer et présenter une analyse de marché sous forme de texte pour votre référence. Calculer les objectifs, les niveaux de support et les points de stop

Bonjour à tous les traders ! De nombreux investisseurs individuels utilisent des scripts web lents. Une approche systématique est essentielle pour un trading rentable. L'indicateur Astro AI n'est pas un simple affichage sur un graphique. Il s'agit d'un réseau neuronal sophistiqué composé de deux agents fonctionnant directement dans le terminal. Détails techniques du système : 1. Agent 1 : Analyste (Réseau neuronal graphique – GNN) Le marché n'est pas constitué de barres de prix individuelle


==================================================================== SMC Pro v6.1 APEX AI — XAUUSD Gold Empire Indicateur MetaTrader 5 · Smart Money Concepts · Moteur d'Intelligence Prédictive ==================================================================== SMC Pro v6.1 APEX AI est un système d'indicateur professionnel basé sur les Smart Money Concepts, conçu exclusivement pour le XAUUSD (or) sur MetaTrader 5. Il combine le cadre SMC complet — Order Blocks, Liquidity sweeps (balayages de
Flag Pattern Angelo
Brighton Mufaro Mudzingwa
Brandon Angelo Flag Pattern — how it works This indicator automatically detects classic bull and bear flag chart patterns in real time. The detection happens in three stages for each bar. First it looks for a flagpole — a sharp, strong directional move over a configurable number of bars ( FlagpoleBars , default 5) that must exceed a minimum percentage size ( FlagpoleMinPct ). For a bullish flag the pole must close net higher than it opened; for a bearish flag, net lower. Second it identifies th
The Zone Trading Indicator is a technical analysis tool for MetaTrader 5 that automatically identifies and displays tradable price zones across multiple timeframes to assist with structured market analysis. The indicator plots Monthly, Weekly, Daily, and H4 tradable zones , allowing traders to view higher- and lower-timeframe price areas simultaneously. These zones are designed to support one-candle–based entry approaches by highlighting predefined areas where price interaction may be monitored.
This indicator automatically detects internal & swing market structure, Fibonacci Retracement and Fibo Levels. Features Full internal & swing market structure labeling in real-time Fibonacci Retracement Fibonacci Levels After purchasing the indicator, the full source code is provided, and via indicator buffers it can be easily integrated into your Expert Advisors (EAs) for automated trading strategies.
Euro Escalper
Cristofher Robles
Euro Escalper — Indicateur Professionnel de Scalping Institutionnel Euro Escalper V1 est un indicateur de trading haute performance concu pour les traders qui exigent une precision institutionnelle a chaque entree. Il fonctionne sur les Indices Synthetiques (Deriv), le Forex et tout actif disponible sur MetaTrader 5. Il combine des zones de liquidite basees sur Fibonacci, un moteur SuperTrend integre et un tableau de bord professionnel en temps reel. Avantages Principaux Sans Repeinture: Les fle
Plus de l'auteur
Golden section price action indicator - is a trend-scalping complete system with enter and exit points. Indicator is based on most powerfull price action japan patterns that are filtered by volume, volatility, market phase. Pattern is not a simple combinations of candles. Patterns must have "weight" to move market in right direction. "Weight" - is the summary of pattern's volume, the size of pattern candles according to last average volatility and ofcourse pattern must appear in correct market p
SupportResistancePeaks Indicator indicator - is the combination of dynamic support/resitance and price action pattern. As a rule support/resistance indicators uses already calculated, history levels. The most disadvantage of this method - new(incomming) levels always are not the same as were on history, in other words accuracy is not so high as expected. My indicator is looking for dynamic/live levels that are forming right now after trend lost it's power and choppy market starts. As a rule exac
Trend deviation scalper - is the manual system to scalp choppy market places. Indicator defines bull/bear trend and it's force. Inside exact trend system also defines "weak" places, when trend is ready to reverse. So as a rule, system plots a sell arrow when bull trend becomes weak and possibly reverses to bear trend. For buy arrow is opposite : arrow is plotted on bear weak trend. Such arrangement allows you to get a favorable price and stand up market noise. Loss arrows are closing by common p
Trend driver bars is the manual trading system, which defines current trend continue or it's pull-back/reverse. "Driver" bars - are price action patterns that has powerfull affect on market, defining it's near future direction. Generally, driver bars represents trend "skeleton" and often anticipates new market impulse. System plots arrows when market shows 3 pattenrs in a row(most powerfull combo-pattern), and makes fast scalping of incomming movement. Loss positions closes by common profit. Lot
Wave Impulse OmegaScalper - is the manual system for scalping. In many cases Indicator "eats" almost all possible trend wave. System defines up price wave and down price wave. Inside the exact wave - system defines true trend movement and choppy market. Indicator plots signals while market is trending, powerfull and has quiet good volatility. This is complete system with enter and exit points. Main Indicator's Features Signals are not repaint,non-late or disappear(exept cases when system recalcu
Reverse side scalper is the manual trading system, that works on choppy(anti-trend) market. As a rule markets are on 80% choppy and only 20% is trend phase. System is based on custom step Moving and RSI and reverse pattern. System defines up movement, down movement, trend / choppy phases. Indicator plots Buy signal arrow when current direction is down and phase is trend, Sell signal arrow is plotted when currently is up movement and phase is trend. As a rule it allows to "catch" local maximum/mi
Binary step clouds - is the complete trading system with enter and exit points. System is based on double smoothed exponential step moving and volume weighted simple step moving.Generally each movings define trend direction and places when trend is in active phase. Signals plots when both movings approache to active trend phase and market speed is high.  Main Indicator's Features Signals are not repaint,non-late or disappear(exept cases when system recalculates all history datas,refreshing main
Acceleration Force Meter Indicator - is a trend system that join market in trend phase and after trend pull-back. AFM indicator - is the system that watchs market phases from flat to extreme volatility and prefers to enter in market when it's active, more volatility, ignoring most flat places. This is 100% complete trading system including enter and exit points. It works well with profitable trades - maximizing take profit targets(analysis of recent market volatility, its pips range to adapt cur
ImbaTrend Runner - is the trend following manual system for forex/crypto market. It defines medium-term trends and works with it in intraday mode. System shows enter points, profit and loss targets. As a rule profit targets are 2-3 X bigger than loss targets. Indicator is AutoAdaptive and it automatically updates it's settings during trading. Indicator is sensitive to market changes, regular updates helps to stay in relevant trend. Main Indicator's Features Signals are not repaint, late or disap
Early WPR divergence - is the manual system to define trend reverse. Green histogram shows main trend, Orange one - shows "short"/local trend. System is looking for clear divergence between both trends and pick up position(plot buy/sell arrows). When main trend is up, but local trend reverses to bearish trend and get's big power - sell arrow is plotted;    When main trend is down, but local trend reverses to bullish trend and get's big power - buy arrow is plotted;  Main inputs are : mediumTrend
Bull bear pressure indicator - is the manual system which defines bull/bear market. When lines is above zero level - market is strong bullish, and when lines below zero level - market is bearish. First line represents global trend and second one are smoothed and shows local market's mood. Main inputs are : MainPeriod- main indicator's period for global trend calculation; SignalPeriod - period for   smoothed and shows local market's trend; Main Indicator's Features Signals are not repaint,non-la
ROC acceleration-deceleration is the manual system for medium-term scalping. Indicator based on custom ROC system which defines bullish/bearish market and especially  acceleration-deceleration of tendention in the market's main direction. Buy arrow is plotted during bearish market when current trend decelerates and sell  arrow is plotted during bullish market when current trend decelerates. Main Indicator's Features Signals are not repaint,non-late or disappear(exept cases when system recalculat
Trend reversal index - is the manual trading system that works with overbought , oversold levels and reversal patterns. Sell arrow is plotted when indicator is higher than overbought level and here forms reversal pattern, all pattern points  located higher than overbought level. Opposite with buy arrow : ndicator is lower than oversold level and here forms reversal pattern, all pattern points located lower than overbought level.  Main Indicator's Features Signals are not repaint, late or disapp
Demarker pullback system - is the manual trading system for choppy markets. It show 2 colored histogram.  When histogram is blue - market is quite bullish, when histogram ir orange - market is more bearish. Up arrow is plotted when histogram is in oversold zone but blue color. Down arrow is plotted when histogram is in overbought zone but orange color. These patterns shows false breakout and possible soon reverse(price is overbought but shows bearish signs and price is oversold but shows bullis
TPM Cross (trend power moving cross) - is a trend following strategy based on custom signal points. Indicator consists from main custom moving chart line and trend power line. Indicator defines up and down movements by it's trend power and custom moving direction. When current market's trend looses it's power and opposite trend starts - power trend line  crosses moving and indicator plots an arrow.  Main indicator's adjustable inputs : movingPeriod - period of moving line  trendPeriod  - period
Impulse fractals indicator - is counter-trend oriented complex market fractal pattern.  Market creates bull/bear impulse, trend starts, fractals on impulsed wave are an agressive pullback signals. Buy arrow is plotted when market is bearish and it's impulse showed up-side fractal, and sell arrow is plotted when market is bullish and it's impulse showed dn-side fractal. Main indicator's adjustable inputs : impulsePeriod - main period of impulse histogram  filterPeriod  - smoothes impulse accordi
Floating peaks oscillator - it the manual trading system. It's based on Stochastik/RSI type of oscillator with dynamic/floating  overbought and oversold levels. When main line is green - market is under bullish pressure, when main line is red - market is under bearish pressure. Buy arrow appears at the floating bottom and sell arrow appears at floating top. Indicator allows to reverse signal types. Main indicator's adjustable inputs : mainTrendPeriod; signalTrendPeriod; smoothedTrendPeriod; tre
Trend speed vector - is the oscillator for manual trading. System measures trend direction and it's speed. Histogram shows 4 colors: Lime --> Strong up movement with good gain speed; Green --> Up movement with low gain speed Red --> Strong down movement with good gain speed; Orange --> Down movement with low gain speed Green and Orange histograms show weak market's movements and thуese places excluded from signal points. Buy arrow is plotted during strong down movement when bearish gain speed i
Floating gain meter is the manual trading system that works with local trends and it's scalping. Histogram represents  bull/bear floating trend gain. Green color histogram shows choppy market with bullish pressure, Orange - shows choppy market with bearish pressure. Lime and Red colors shows "boiled" places in market. As a rule buy arrow is placed after strong Down movement when it's power becomes weak and choppy market starts. And sell arrow is plotted after strong Up movement when it's power
Pullback points indicator - is the manual trading system, that shows most popular market prices. Indicator measures bull/bear waves pressure and looks for "consensus" prices. As a rule these points are crossed up and down very often and opened trade has several chances to be closed in positive zone. Mainly, such points is the good base for "common profit" types of strategies. Indicator also represents   "common profit"  scalping method of trading as default one.  Main Indicator's Features Signa
Noize Absorption Index MT4
Ekaterina Saltykova
5 (1)
Noize Absorption Index - is the manual trading system that measures the difference of pressure between bears forces and bulls forces. Green line - is a noize free index that showing curent situation. Zero value of index shows totally choppy/flat market.Values above zero level shows how powerfull bullish wave is and values below zero measures bearish forces.Up arrow appears on bearish market when it's ready to reverse, dn arrow appears on weak bullish market, as a result of reverse expectation. S
Looking for EA to automate your trading strategy on the Forex market? TrendRocWaves Robot — your faithful companion in the world of trading! This 100% automated EA offers unique features: - works exclusively on high timeframes (H1 and H4) for confirmed response to market changes. - uses the most popular and liquid currency pairs such as EURUSD,GBPUSD with minimal spreads and fast transaction execution. - applies a scalping method based on a medium-term trend to achieve local goals and reduce r
Introducing to your attention an innovative expert advisor created specifically for the most juicy and volatility    currency     basket: GBPUSD and XAUUSD. This EA is designed using the main features of this market's movement, making it an ideal choice for dynamic trading on high-trending and medium-volatile pairs. The advisor is focused on minimizing trading risks, aiming to reduce losses to a minimum. Main features: EA is designed to open and close orders at the begginning of trading session
Introducing to your attention unique trading advisor, Squeeze roc xau points, exclusively designed for trading on the XAU/USD pair. We analyzed predominantly all objectively important timeframes and identified unique characteristics of gold movements relative to the dollar to create this product. These insights can be extremely useful in predicting market reversal points on timeframes from M30 to H8 for the XAU/USD pair. You can choose your favorite timeframe to receive signals or use multiple
Introducing to your attention a unique trading advisor "Detrended scalper jpy points robot", designed for trading with major JPY crosses. The idea is based on a modified indicator, detrended price oscillator, whose task is to eliminate the influence of the trend on price movements. This greatly simplifies the process of determining overbought/oversold cycles. The focus is on analyzing short cycles: long market cycles consist of several short ones. By analyzing the short components, we can more
Hybrid Trend Impulse robot – is an advanced EA that combines modern approaches to trend and impulse analysis, offering unique capabilities for effective deposit management. Key advantages of the HybridTrendImpulse_robot: Nonlinear dynamics: The method of interaction between opening prices forms a unique nonlinear model that is particularly sensitive to significant price fluctuations, increasing their significance and making the indicator ideal for working in high volatility conditions. Enhanced
R trend sync robot mt4
Ekaterina Saltykova
r-Trend Sync Robot is an expert advisor for extra volatility markets like XAUUSD with dynamic lot size. Main EA features : The advisor's algorithm is based on the analysis of an extensive array of historical data (from 1995 for EURUSD & EURJPY and from 2004 for XAUUSD), which ensured the identification of general patterns in the behavior of these pairs across a wide range of timeframes. The analysis of historical data helped the advisor learn to recognize market triggers for medium-term trends a
At the core of the VidyaPearsonFlow Robot lies the synthesis of two key principles : a daptive filtration of market noise and statistical analysis of correlations between major Forex pairs such as EURUSD, GBPUSD, and XAUUSD. This is not merely an algorithm—it is a system that embodies the harmony of mathematical rigor and the flexibility required to operate in the ever-changing market environment. The Essence of the Method: Adaptive Filtration: The system dynamically adjusts to changing market
Adaptive Trend Metrix Adaptive Trend Metrix is an fxtool for assessing the current state of the market that adapts to changes in volatility, helping to determine the direction and strength of the trend by taking into account price dynamics. One aspect of this strategy is its ability to change and use different parameters based on price behavior. For example, it takes into account the current market volatility to adjust sensitivity to price fluctuations and identify entry and exit points. Adaptiv
The fully automated trading advisor, CovEchoTrend Robot, focuses on reliability and flexibility. By employing statistical analysis methods to study the relationships between the base indicator and market patterns, the system enables a deeper understanding of market processes. Intelligent pattern analysis: The application of statistical data processing helps identify key trend reversal points more accurately, signaling significant market shifts. Informed decision-making is based on the intersecti
Filtrer:
Aucun avis
Répondre à l'avis