ACB Breakout Arrows Scanner MT5

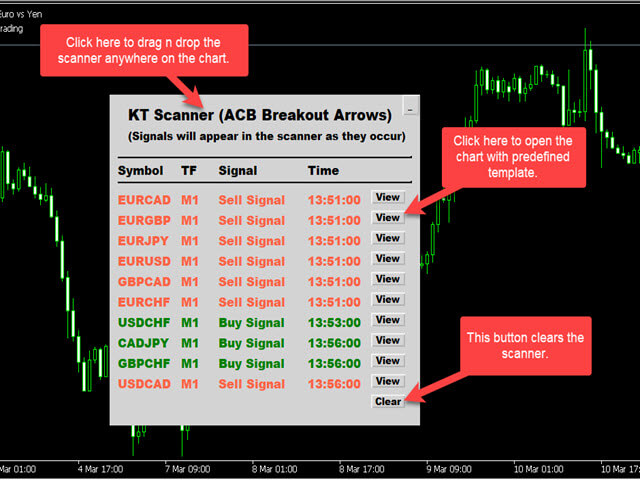
Bu, ACB Breakout Arrows göstergemiz için geliştirilmiş çoklu sembol ve çoklu zaman dilimi tarayıcısıdır. Varsayılan ayarlarla 28 döviz çifti ve 9 zaman dilimini eş zamanlı olarak tarayarak al/sat sinyallerini belirler. 

Özellikler

  • Tek bir grafik üzerinden 252* sembol ve zaman dilimi kombinasyonunu tarayabilir.
  • Önceden tanımlanmış şablonla sinyal grafiğini tek tıkla açabilirsiniz. 
  • Paneli grafikte istediğiniz yere kolayca sürükleyip bırakabilirsiniz.
  • Gerçek zamanlı uyarılar: pop-up, sesli bildirim, push bildirimi ve e-posta ile. 

Giriş Parametreleri

  • ACB Breakout Arrows için sinyal hassasiyeti ayarı.
  • Semboller: Tarama yapılacak sembolleri girin. 
  • Geçmişi Yenile: Eksik veya bozulmuşsa veri geçmişini yeniden indirir. 
  • Tarama yapılacak zaman dilimlerini seçin.
  • Uyarı Ayarları
  • Panelin renkleri ve yazı tipi boyutu kişiselleştirilebilir. 
Önerilen ürünler
Introduction to Fractal Pattern Scanner Fractal Indicator refers to the technical indicator that makes use of the fractal geometry found in the financial market. Fractal Pattern Scanner is the advanced Fractal Indicator that brings the latest trading technology after the extensive research and development work in the fractal geometry in the financial market. The most important feature in Fractal Pattern Scanner is the ability to measure the turning point probability as well as the trend probabil
Dual-Period Williams %R Oscillator for MT5 A sophisticated trend exhaustion detector that combines two Williams %R oscillators to identify high-probability reversal opportunities through confluence analysis. ======================================================================================== Key Features Intelligent Dual-Signal System Fast and Slow Williams %R periods working in confluence Real-time trend exhaustion detection with reliable signals Optimized calculations for smooth MT5 perfor
KT Psar Arrows MT5
KEENBASE SOFTWARE SOLUTIONS
5 (1)
KT Psar Arrows, standart Parabolic SAR göstergesini kullanarak grafikte oklar çizer. Mumun en yüksek noktası SAR'a temas ettiğinde yükseliş oku çizilir. Mumun en düşük noktası SAR'a temas ettiğinde düşüş oku çizilir. Sinyaller, mum kapanışını beklemeden gerçek zamanlı olarak üretilir.  Özellikler Parabolic SAR göstergesini kullanan ticaret stratejilerini denemek isteyen yatırımcılar için faydalı bir araçtır.  Piyasadaki dönüş noktalarını bulmak için kullanılabilir. Özel PSAR girişlerini destekl
Bu gösterge, pratik ticaret için mükemmel olan otomatik dalga analizine yönelik bir göstergedir! Dava... Not:   Dalga sınıflandırması için Batılı isimleri kullanmaya alışkın değilim. Tang Lun'un (Tang Zhong Shuo Zen) adlandırma kuralının etkisiyle, temel dalgayı   kalem   , ikincil dalga bandını ise   segment   olarak adlandırdım. aynı zamanda segmentin trend yönü vardır. Adlandırma   esas olarak trend segmentidir   (bu adlandırma yöntemi gelecekteki notlarda kullanılacaktır, öncelikle söyleyey
# SSL ST Strategy MT5 Indicator - Turkish Version SSL ST Strategy MT5 Göstergesi, tüccarların ticaret grafiğinde alış ve satış sinyallerini açıkça tanımlamalarına yardımcı olmak için tasarlanmış bir teknik analiz aracıdır. Çizgiler ve oklar gibi görsel göstergeler, ayrıca ses, açılır pencere ve anında bildirimleri sunarak, ticaret fırsatı ortaya çıktığında tüccarları zamanında uyarır. ## Ana Avantajlar - Renkli çizgiler (SSL1 ve Baseline) ve alış sinyalleri (yeşil üçgen) ve satış sinyalleri
HalfTrend trendline with ATR pullback zones — built for trend traders. Spot the trend direction instantly, use ATR bands to judge “normal” pullbacks vs extended moves, and get alerts on trend flips and optional trendline touches .  HalfTrend ATR Bands & Alerts (MT5) is a trend-following indicator that plots a clean HalfTrend trendline together with ATR-based bands/zones . It provides trend change arrows , optional touch alerts (price touches the trendline), and EA/iCustom signal buffers for au
The indicator determines a special pattern of Joe Dinapoli. It gives very high probability buy and sell signals. Indicator does not repaint. Indicator Usage Buy Signal ''B'' Entry : Market buy order at signal bar close Stop : Low of signal bar Take Profit : First swing high Sell Signal ''S'' Entry : Market sell order at signal bar close Stop : High of signal bar Take Profit : First swing low Indicator Parameters Fast EMA : External Parameter (should be kept as default) Slow EMA: External Param
Sigma VWAP Bands Sigma VWAP Bands (Rolling) is a technical analysis indicator that plots upper and lower bands based on the statistical deviation of price from a rolling Volume-Weighted Average Price (VWAP). The indicator is designed to visualize price dispersion around VWAP using a user-defined lookback window and a configurable standard deviation multiplier. Parameters Lookback Period Number of bars used for VWAP and standard deviation calculations. Sigma Factor Multiplier applied to the cal
Optimized Spike Detector Pro for MT5 is a professional-grade technical indicator designed to identify and capitalize on sharp, impulsive price movements (spikes) in any financial instrument. Utilizing a sophisticated, multi-algorithmic core, it distinguishes significant volatility expansions from market noise with exceptional accuracy. The tool dynamically adapts to changing market conditions, filtering out false signals and highlighting only high-probability spike setups in real-time. Featuring
Xtrade Trend Detector
Dago Elkana Samuel Dadie
Xtrade Trend Detector is an indicator capable of finding the best opportunities to take a position in any stock market. Indeed, it is a great tool for scalpers but also for Daytraders. You could therefore use it to identify areas to trade, it fits easily on a chart. I use it to detect trends on Big timeframes and take positions on Small timeframes. Don't hesitate to give me a feedback if you test it.
Gösterge, bir miktar düzeltmeden sonra aynı anda trendi takip eden bir ticarete girmeye yardımcı olur. Belirli sayıda çubuk üzerinde bir döviz çiftinin güçlü trend hareketlerini bulur ve ayrıca bu trend için düzeltme seviyeleri bulur. Eğilim yeterince güçlüyse ve düzeltme parametrelerde belirtilene eşitse, gösterge bunu bildirir. Farklı düzeltme değerleri ayarlayabilirsiniz, 38, 50 ve 62 (Fibonacci seviyeleri) değerleri daha uygundur. Ayrıca minimum trend uzunluğunu, aranacak çubuk geçmişi sayı
Liquidity Map
Alex Amuyunzu Raymond
Liquidity Map  Overview The Liquidity Map indicator is an advanced visualization tool based on ICT Smart Money Concepts . It automatically identifies daily Buy Zones , Sell Zones , and Liquidity Levels , showing where price is likely to reverse or continue based on institutional order flow. It calculates key levels from the daily session — such as the previous day’s high, low, and midpoint — then derives a premium (sell bias) and discount (buy bias) structure. When price trades into these mapped
The Rocket Trend indicator is trending. The indicator draws two-color points connected by lines along the chart. This is a trend indicator, it is an algorithmic indicator. It is easy to work and understand when a blue circle appears, you need to buy, when a red one appears, sell. The indicator is used for scalping and pipsing, and has proven itself well. Rocket Trend is available for analyzing the direction of the trend for a specific period of time. Ideal for novice traders learning the laws o
My PVSR
Ashok Kumar Singha
My PVSR   is based on All Type of Pivot Points. Use this Indicator to get proper Support / Resistance Zone and Trade accordingly.. Recommendation: Use this Indicator along with my another Indicator --->>> Dr. Trend   <<<--- Click Here ; To get the best output result feel free to contact me ; Best of Luck It can be used for: All Pairs: Forex, Cryptocurrencies, Metals, Stocks, Indices etc. All Timeframe All Brokers All type of Trading Style like Scalping, Swing, Intraday, Short-Term, Long-
The intelligent algorithm of the Godfather indicator accurately determines the trend, filters out market noise and generates entry and exit levels. The indicator will help in finding entry points when analyzing the price chart. The program first receives a "snapshot" of the graph, then analyzes it. The results are reported to the trader in the form of signals. The main purpose of this indicator is to determine the moments of entries and exits from transactions, so the indicator displays only th
Skiey
Vitalii Zakharuk
Skiey - Indicator of easy solutions! Using this indicator is very simple, since the simplest is to look at the chart and act according to the color arrows. Such a calculation option takes into account intraday price fluctuations and focuses on measuring the "candlestick" share in the trend. The algorithm takes into account the measurement of prices, this method also emphasizes the measurement of each of the price drops (H / C, H / O, LC, LO) - which gives more detailed information but also mor
Niubility Trend  Niubility Trend  displays the trend direction for all time frames in real time. You'll see at a glance at which direction the trends are running, how long they last and how powerful they are. All this makes it an easy-to-use trend trading system for beginners, advanced and professional traders. Features Easy to trade Customizable colors and sizes It is non-repainting and non-backpainting It is fantastic as a trailing stop method It implements alerts of all kinds
KT Candlestick Patterns Scanner is a Multi-Symbol and Multi-Timeframe scanner that fetches and shows various candlestick patterns on 28 currency pairs and 9 time-frames concurrently . The scanner finds the candlestick patterns by loading the KT Candlestick Patterns indicator as a resource in the background. Features The scanner can find the candlestick patterns on 252* combinations of symbols and time-frames from a single chart. Open the signal's chart loaded with a predefined template with a s
the fundamental technical indicator Informative Trend, which allows you to assess the current market situation in order to enter the market of the selected currency pair in a trend and with minimal risk. It basically uses the process of identifying the rate of change in price growth and allows you to find entry and exit points from the market. The indicator was created on the basis of the original indicators for searching for extreme points and is well suited for determining a reversal or a la
Teklif Fiyatı Zamanlayıcı Göstergesi — Hassas Zamanlama ve Akıllı Fiyat Takibi! Teklif Fiyatı Zamanlayıcı Göstergesi ile işlem hassasiyetinizi bir üst seviyeye taşıyın — her hareketinde zamanlamayı, hassasiyeti ve netliği önemseyen trader’lar için tasarlanmış güçlü bir araç. Öne Çıkan Özellikler: Sabit Zamanlayıcı Ekranı – Grafiğinizin sağ tarafında her zaman görünür (özelleştirilebilir X_Offset). Dinamik Fiyat Takibi – Zamanlayıcı, teklif fiyatını gerçek zamanlı olarak takip e
Session Kill zones with panel for quick changes. Asia Killzone London Killzone New York Killzone London Close Killzone In this indicator GMT+2 timings are used that are most common among many brokers. read the image attached in the screenshots to know more about sessions adjustments Session timings can be changed according to your broker timings and day light savings. Thank you :) Always open to feedback and criticism if it helps me provide you more value. - Rahul  My other indicators you may l
The advantage of working on the Special Agent signal indicator is that the trader does not need to independently conduct a technical analysis of the chart. Determining the market trend is an important task for traders, and the tool gives ready-made signals in the form of directional arrows. This tool is an arrow (signal). Special Agent is a trend indicator, a technical analysis tool that helps to determine the exact direction of the trend: either up or down price movement for a trading pair of
MT5 için Crypto_Forex Göstergesi "TREND Histogramı", Yeniden Boyama Yok. - TREND Histogramı göstergesi, standart Hareketli Ortalama kesişimlerinden çok daha hassas ve etkilidir. - Gösterge 2 renkte olabilir: Düşüş trendi için Sarı (altın) ve yükseliş trendi için Yeşil (renkler ayarlardan değiştirilebilir). - TREND Histogramı, mobil ve bilgisayar için yerleşik uyarılara sahiptir. - Bu göstergeyi diğer işlem yöntemleriyle (Fiyat Hareketi, VSA ve diğer göstergeler) birleştirmek harika bir fikirdi
- Real price is 80$ - 45% Discount (It is 45$ now) Contact me for extra bonus   indicator, instruction or any questions! - Lifetime update free - Non-repaint - Related product: Gann Gold EA - I just sell my products in Elif Kaya Profile, any other websites are stolen old versions, So no any new updates or support. Advantages of  M1 Scalper Pro  Profitability: M1 Scalper Pro is highly profitable with a strict exit strategy. Frequent Opportunities: M1 Scalper Pro  takes advantage of numerous smal
If you are unsure how to use this indicator, please feel free to reach out to me. I will explain it to you and provide reading materials to help you make the most of it. TD Sequential Scanner: An Overview The TD Sequential scanner is a powerful technical analysis tool designed to identify potential price exhaustion points and trend reversals in financial markets. Developed by Tom DeMark, this method is widely used by traders to gauge market cycles and potential turning points with precision. Ho
Visual Trend Reversals — Professional Trend Reversal Indicator for MetaTrader 5 Visual Trend Reversals is a modern and efficient indicator for MetaTrader 5, specifically designed for the timely identification of trend reversal points and analysis of market conditions on any instrument: forex, cryptocurrencies, stocks, indices, and commodities. The indicator is optimized to improve entry quality, minimize false signals, and maximize clarity for traders of any experience level. Key Advantages of V
Hydra Trend Rider is a non-repainting, multi-timeframe trend indicator that delivers precise buy/sell signals and real-time alerts for high-probability trade setups. With its color-coded trend line, customizable dashboard, and mobile notifications, it's perfect for traders seeking clarity, confidence, and consistency in trend trading. Setup & Guide:  Download  MT4 Version here. To learn how to use the Indicator: Indicator Manual & Guide -   Read Here Follow our MQL5 channel for daily market ins
【R】【Y】【M】   【R】【Y】【M】  【R】【Y】【M】 The   Linear Regression Channel Indicator   is a powerful technical analysis tool that helps traders capture price trends and potential reversal points. By calculating and displaying linear regression channels, bands, and future projections, this indicator offers an in-depth perspective on market dynamics. It aids in identifying overbought and oversold conditions, trend direction, and provides clear visual cues for potential future price movements. STILL ON I
Mean Reversal Heikin Ashi Indicator calculates special trade reversal points based on Heikin Ashi candlesticks patterns. This indicator can be used on all symbols, even in Forex or B3 Brazillian Markets. You can configure just the position of each arrow. Then, after include the indicator on the graphic, pay attention on each arrow that indicates a long or short trade.
CISD Levels Pro automatically draws CISD Buy and Sell levels directly on your chart. It highlights pending levels while they are forming, then marks confirmed levels after the confirmation candle closes. Optional confirmation arrows help you spot the signal quickly. This tool is designed for traders who want clean, simple CISD level visualization without extra indicators or clutter. Key Features Draws Bullish (BUY) CISD levels and Bearish (SELL) CISD levels Shows Pending levels (dashed) and
Bu ürünün alıcıları ayrıca şunları da satın alıyor
Divergence Bomber
Ihor Otkydach
4.89 (83)
Bu göstergeyi satın alan herkese aşağıdaki ekstra içerikler ücretsiz olarak sunulmaktadır: Her işlemi otomatik olarak yöneten, Stop Loss ve Take Profit seviyelerini ayarlayan ve işlemleri strateji kurallarına göre kapatan özel yardımcı araç: "Bomber Utility" Göstergenin farklı varlıklar üzerinde kullanılmasına yönelik ayar dosyaları (set dosyaları) Bomber Utility için 3 farklı modda kullanım sunan ayar dosyaları: "Minimum Risk", "Dengeli Risk" ve "Bekle-Gör Stratejisi" Bu ticaret stratejisini hı
Azimuth Pro
Ottaviano De Cicco
5 (4)
LAUNCH PROMO Azimuth Pro price is initially set at 299$ for the first 100 buyers. Final price will be 499$ . THE DIFFERENCE BETWEEN RETAIL AND INSTITUTIONAL ENTRIES ISN'T THE INDICATOR — IT'S THE LOCATION. Most traders enter at arbitrary price levels, chasing momentum or reacting to lagging signals. Institutions wait for price to reach structured levels where supply and demand actually shift. Azimuth Pro maps these levels automatically: swing-anchored VWAP, multi-timeframe structure lines, an
Entry In The Zone and SMC Multi Timeframe is a real-time market analysis tool developed based on Smart Money Concepts (SMC). It is designed to analyze market structure, price direction, reversal points, and key zones across multiple timeframes in a systematic way. The system displays Points of Interest (POI) and real-time No Repaint signals, with instant alerts when price reaches key zones or when signals occur within those zones. It functions as both an Indicator and a Signal System (2-in-1), c
Bu indikatörü satın alırsanız, Profesyonel Trade Manager’ımı  + EA ÜCRETSİZ olarak alacaksınız. Öncelikle, bu Ticaret Sistemi'nin Non-Repainting, Non-Redrawing ve Non-Lagging Göstergesi olduğunu vurgulamak önemlidir, bu da hem manuel hem de robot ticareti için ideal hale getirir. Online kurs, kılavuz ve ön ayarları indir. "Smart Trend Trading System MT5", yeni ve deneyimli tüccarlar için özelleştirilmiş kapsamlı bir ticaret çözümüdür. 10'dan fazla premium göstergeyi birleştiriyor ve 7'den fazla
FX Trend MT5 NG
Daniel Stein
5 (4)
FX Trend NG: Yeni Nesil Çoklu Piyasa Trend Zekâsı Genel Bakış FX Trend NG , çoklu zaman dilimlerinde çalışan profesyonel bir trend analiz ve piyasa izleme aracıdır. Piyasanın yapısını saniyeler içinde anlamanızı sağlar. Birden fazla grafik arasında geçiş yapmak yerine, hangi enstrümanların trendde olduğunu, momentumun nerede zayıfladığını ve hangi zaman dilimlerinin uyumlu olduğunu anında görebilirsiniz. Lansman Teklifi – FX Trend NG sadece $30 (6 Ay) veya $80 Ömür Boyu Lisans ile edinin. Zate
RFI levels PRO MT5
Roman Podpora
3.67 (3)
Bu gösterge, fiyat dönüş noktalarını ve fiyat geri dönüş bölgelerini doğru bir şekilde gösterir.       Başlıca oyuncular   . Yeni trendlerin nerede oluştuğunu görüyorsunuz ve her işlem üzerinde kontrolü elinizde tutarak, azami hassasiyetle kararlar alıyorsunuz. TREND LINES PRO   göstergesiyle birlikte kullanıldığında maksimum potansiyelini ortaya koyar.  VERSION MT4 Göstergenin gösterdiği şey: Yeni bir trendin başlangıcında aktivasyonla birlikte tersine dönüş yapıları ve tersine dönüş seviyeler
Trend Screener Pro MT5
STE S.S.COMPANY
4.81 (103)
Trend Göstergesi, Trend Alım Satım ve Filtreleme için Çığır Açan Benzersiz Çözüm, Tüm Önemli Trend Özellikleriyle Tek Bir Araç İçinde Yerleştirildi! Forex, emtialar, kripto para birimleri, endeksler ve hisse senetleri gibi tüm sembollerde/araçlarda kullanılabilen %100 yeniden boyamayan çoklu zaman çerçevesi ve Çoklu para birimi göstergesidir. Trend Screener, grafikte noktalarla ok trend sinyalleri sağlayan etkili bir trend trend göstergesidir. Trend analizörü göstergesinde bulunan özellikler: 1.
AriX
Temirlan Kdyrkhan
1 (4)
AriX Indicator for MT5 A powerful trend-following and signal-evaluation tool AriX is a custom MT5 indicator that combines Moving Averages and ATR-based risk/reward logic to generate clear buy/sell signals. It visualizes dynamic SL/TP levels, evaluates past trade outcomes, and displays win/loss statistics in a clean on-chart panel. Key features include: Buy/Sell signals based on MA crossovers ATR-based SL/TP1/TP2/TP3 levels with visual lines and labels Signal outcome tracking with real-time stat
Grabber System MT5
Ihor Otkydach
4.83 (23)
Size mükemmel bir teknik gösterge olan Grabber’ı tanıtıyorum. Bu araç, kullanıma hazır bir “her şey dahil” işlem stratejisi olarak çalışır. Tek bir yazılım kodu içinde güçlü piyasa teknik analiz araçları, işlem sinyalleri (oklar), uyarı işlevleri ve push bildirimleri entegre edilmiştir. Bu göstergeyi satın alan herkes aşağıdaki hediyeleri ücretsiz olarak alır: Açık emirleri otomatik yönetmek için Grabber Yardımcı Aracı Kurulum, yapılandırma ve nasıl işlem yapılacağını adım adım anlatan video kıl
Atomic Analyst MT5
Issam Kassas
4.03 (30)
Öncelikle belirtmek gerekir ki bu Ticaret Göstergesi Yeniden Çizim Yapmaz, Gecikmez ve Gecikme Göstermez, bu da hem manuel hem de robot ticareti için ideal hale getirir. Kullanıcı kılavuzu: ayarlar, girişler ve strateji. Atom Analisti, Piyasada Daha İyi Bir Avantaj Bulmak İçin Fiyatın Gücünü ve Momentumunu Kullanan PA Fiyat Hareketi Göstergesidir. Gürültüleri ve Yanlış Sinyalleri Kaldırmaya ve Ticaret Potansiyelini Artırmaya Yardımcı Olan Gelişmiş Filtrelerle Donatılmıştır. Birden fazla katmanl
OmniSync Projection
Antonio-alin Teculescu
5 (1)
Chronos Fractal Engine is an innovative price projection indicator for MetaTrader 5, designed to transform your technical analysis by intelligently identifying and projecting historical price patterns. Built upon an advanced correlation algorithm and the fractal principles of the market, this powerful tool visualizes potential future price movements, giving you a unique edge in your trading decisions. What is Chronos Fractal Engine? At its core, the Chronos Fractal Engine employs a sophisticat
FX Power MT5 NG
Daniel Stein
5 (31)
FX Power: Daha Akıllı Ticaret Kararları için Para Birimlerinin Gücünü Analiz Edin Genel Bakış FX Power , her piyasa koşulunda başlıca para birimlerinin ve altının gerçek gücünü anlamak için vazgeçilmez bir araçtır. Güçlü para birimlerini alıp zayıf olanları satarak, FX Power ticaret kararlarınızı basitleştirir ve yüksek olasılıklı fırsatları ortaya çıkarır. İster trendlere sadık kalın ister Delta'nın aşırı değerlerini kullanarak tersine dönüşleri öngörün, bu araç ticaret tarzınıza mükemmel bir
TREND ÇİZGİLERİ PRO       Piyasanın gerçek yön değiştirdiği noktayı anlamaya yardımcı olur. Gösterge, gerçek trend dönüşlerini ve büyük oyuncuların piyasaya yeniden girdiği noktaları gösterir. Anlıyorsun   BOS hatları   Daha yüksek zaman dilimlerindeki trend değişiklikleri ve önemli seviyeler, karmaşık ayarlar veya gereksiz gürültü olmadan gösterilir. Sinyaller yeniden çizilmez ve çubuk kapandıktan sonra grafikte kalır. MT4 SÜRÜMÜ   -   RFI LEVELS PRO   göstergesiyle   birlikte kullanıldığında m
Öncelikle, bu Ticaret Aracının Non-Repainting, Non-Redrawing ve Non-Lagging Gösterge olduğunu vurgulamakta fayda var, bu da onu profesyonel ticaret için ideal hale getiriyor. Çevrimiçi kurs, kullanıcı kılavuzu ve demo. Akıllı Fiyat Hareketi Kavramları Göstergesi, hem yeni hem de deneyimli tüccarlar için çok güçlü bir araçtır. İleri ticaret fikirlerini, Inner Circle Trader Analizi ve Smart Money Concepts Ticaret Stratejileri gibi 20'den fazla kullanışlı göstergeyi bir araya getirerek bir araya
ARIPoint
Temirlan Kdyrkhan
ARIPoint is a powerful trading companion designed to generate high-probability entry signals with dynamic TP/SL/DP levels based on volatility. Built-in performance tracking shows win/loss stats, PP1/PP2 hits, and success rates all updated live. Key Features: Buy/Sell signals with adaptive volatility bands Real-time TP/SL/DP levels based on ATR Built-in MA Filter with optional ATR/StdDev volatility Performance stats panel (Success, Profit/Loss, PP1/PP2) Alerts via popup, sound, push, or email Cu
RelicusRoad Pro: Kantitatif Piyasa İşletim Sistemi ÖMÜR BOYU ERİŞİMDE %70 İNDİRİM (SINIRLI SÜRE) - 2.000+ TRADER'A KATILIN Neden çoğu trader "mükemmel" indikatörlere rağmen başarısız olur? Çünkü tekil kavramları boşlukta trade ederler. Bağlamı olmayan bir sinyal kumardır. Sürekli kazanmak için KONFLÜANS (UYUM) gerekir. RelicusRoad Pro basit bir ok indikatörü değildir. Tam bir Kantitatif Piyasa Ekosistemi dir. Tescilli volatilite modellemesini kullanarak fiyatın ilerlediği "Adil Değer Yolu"nu har
Quantum TrendPulse
Bogdan Ion Puscasu
5 (22)
SuperTrend   ,   RSI   ve   Stochastic'in   gücünü tek bir kapsamlı göstergede birleştirerek işlem potansiyelinizi en üst düzeye çıkaran nihai işlem aracı olan   Quantum TrendPulse'u   tanıtıyoruz. Hassasiyet ve verimlilik arayan yatırımcılar için tasarlanan bu gösterge, piyasa trendlerini, momentum değişimlerini ve en uygun giriş ve çıkış noktalarını güvenle belirlemenize yardımcı olur. Temel Özellikler: SuperTrend Entegrasyonu:   Güncel piyasa trendlerini kolayca takip edin ve karlılık dalgası
Gold Sniper Scalper Pro
Ich Khiem Nguyen
3.78 (9)
Gold Sniper Scalper Pro, XAUUSD üzerinde sahte kırılma (false breakout) formasyonlarını tespit etmek için özel olarak tasarlanmış bir MetaTrader 5 göstergesidir. Fiyatın bir range sınırını kırdığı, kırılma yatırımcılarını çektiği ve ardından tersine döndüğü 4 çubuklu tuzak yapısını belirler — hareketin sahte bir kırılma olduğunu doğrular. Gösterge, her kurulumu 17 kalite faktörüne göre puanlar, 4 katmanlı bir uyum hattından geçirir, 7 zaman dilimli trend konsensüs motoruyla doğrular ve altın vo
Protect against whipsaws: revolutionize your swing trading approach Swing Trading is the first indicator designed to detect swings in the direction of the trend and possible reversal swings. It uses the baseline swing trading approach, widely described in trading literature. The indicator studies several price and time vectors to track the aggregate trend direction and detects situations in which the market is oversold or overbought and ready to correct. [ Installation Guide | Update Guide | Tro
Introduction to X3 Chart Pattern Scanner X3 Cherart Pattern Scanner is the non-repainting and non-lagging indicator detecting X3 chart patterns including Harmonic pattern, Elliott Wave pattern, X3 patterns, and Japanese Candlestick patterns. Historical patterns match with signal patterns. Hence, you can readily develop the solid trading strategy in your chart. More importantly, this superb pattern scanner can detect the optimal pattern of its kind. In addition, you can switch on and off individu
Tanıtım       Quantum Breakout PRO   , Breakout Bölgeleri ile ticaret yapma şeklinizi değiştiren çığır açan MQL5 Göstergesi! 13 yılı aşkın ticaret tecrübesine sahip deneyimli tüccarlardan oluşan bir ekip tarafından geliştirilmiştir.       Kuantum Breakout PRO       yenilikçi ve dinamik koparma bölgesi stratejisiyle ticaret yolculuğunuzu yeni zirvelere taşımak için tasarlanmıştır. Kuantum Breakout Göstergesi, size 5 kar hedefi bölgesi ile kırılma bölgelerinde sinyal okları ve kırılma kutusuna da
Btmm state engine pro
Garry James Goodchild
5 (2)
Get the user guide here  https://g-labs.software/guides/BTMM_State_Engine_Welcome_Pack.html BTMM State Engine Pro — the   all-in-one Banks   & Institutions Market Maker indicator for Meta Trader 5. Built for   BTMM traders who follow the Asian   session breakout methodology with Kill Zone timing , level stacking, peak formation detection , and multi-pair scanning — all   from a single chart. Combines   a full BTMM State Engine   with a built-in multi-pair Scanner dashboard, eliminating the need
Shock Pullback
Suleiman Alhawamdah
5 (1)
Basitçe söylemek gerekirse, mevcut mum çubuğunun yanında “pip” olarak bilinen beyaz sayıların hareketi görünmeye başladığında işlem yapmaya başlayabilirsiniz. Beyaz “pip”ler, bir alım veya satım işleminin şu anda aktif olduğunu ve beyaz renkleriyle belirtildiği gibi doğru yönde ilerlediğini gösterir. Beyaz pip hareketi durduğunda ve sabit yeşil renge dönüştüğünde, bu mevcut ivmenin sona erdiğini gösterir. Sayıların yeşil rengi, alım veya satım işlemiyle elde edilen toplam kârı “pip” cinsinden t
Trade smarter, not harder: Empower your trading with Harmonacci Patterns This is arguably the most complete harmonic price formation auto-recognition indicator you can find for the MetaTrader Platform. It detects 19 different patterns, takes fibonacci projections as seriously as you do, displays the Potential Reversal Zone (PRZ) and finds suitable stop-loss and take-profit levels. [ Installation Guide | Update Guide | Troubleshooting | FAQ | All Products ] It detects 19 different harmonic pri
" Dynamic Scalper System MT5 " göstergesi, trend dalgaları içinde işlem yapmak için scalping yöntemi için tasarlanmıştır. Başlıca döviz çiftleri ve altın üzerinde test edilmiştir, diğer işlem araçlarıyla uyumluluğu mümkündür. Ek fiyat hareketi desteğiyle trend boyunca pozisyonların kısa vadeli açılması için sinyaller sağlar. Göstergenin prensibi. Büyük oklar trend yönünü belirler. Küçük oklar şeklinde scalping için sinyaller üreten bir algoritma trend dalgaları içinde çalışır. Kırmızı oklar yü
Meta Cipher B
SILICON HALLWAY PTY LTD
Meta Cipher B: MT5 için Hepsi Bir Arada Osilatör Paketi Meta Cipher B , popüler Market Cipher B konseptini hız ve hassasiyet için optimize edilmiş şekilde MetaTrader 5’e getirir. Baştan aşağı performans odaklı tasarlanmış olup, profesyonel seviyede sinyaller sunar; gecikme veya takılma olmadan çalışır. Tek başına güçlü olsa da, Meta Cipher B aynı zamanda Meta Cipher A ile doğal bir şekilde eşleşecek şekilde tasarlanmıştır, böylece piyasanın tam resmini ve daha derin analiz onayını sağlar. Ne iş
Top indicator for MT5   providing accurate signals to enter a trade without repainting! It can be applied to any financial assets:   forex, cryptocurrencies, metals, stocks, indices .  Watch  the video  (6:22) with an example of processing only one signal that paid off the indicator! MT4 version is here It will provide pretty accurate trading signals and tell you when it's best to open a trade and close it. Most traders improve their trading results during the first trading week with the help of
TPA True Price Action indicator reveals the true price action of the market makers through 100% non-repainting signals strictly at the close of a candle! TPA shows entries and re-entries, every time the bulls are definitely stronger than the bears and vice versa. Not to confuse with red/green candles. The shift of power gets confirmed at the earliest stage and is ONE exit strategy of several. There are available now two free parts of the TPA User Guide for our customers. The first "The Basics"
TPSpro RFI Levels MT5
Roman Podpora
4.53 (19)
TALİMATLAR RUS  /  TALİMATLAR   ENG  /  Sürüm MT4 Ana fonksiyonları: Satıcı ve alıcıların aktif bölgelerini görüntüler! Gösterge, satın alma ve satışlar için tüm doğru ilk dürtü seviyelerini/bölgelerini görüntüler. Giriş noktaları arayışının başladığı bu seviyeler/bölgeler etkinleştirildiğinde, seviyeler renk değiştirir ve belirli renklerle doldurulur. Ayrıca, durumun daha sezgisel bir şekilde algılanması için oklar görünür. LOGIC AI - Bir şablonu etkinleştirirken giriş noktalarını aramak için
FX Volume MT5
Daniel Stein
4.79 (24)
FX Volume: Bir Broker’ın Perspektifinden Gerçek Piyasa Duyarlılığını Deneyimleyin Kısa Özet Trading yaklaşımınızı bir adım öteye taşımak ister misiniz? FX Volume , perakende traderlar ile brokerların nasıl konumlandığını gerçek zamanlı olarak sunar—COT gibi gecikmeli raporlardan çok daha önce. İster istikrarlı kazançları hedefliyor olun, ister piyasada daha güçlü bir avantaj arayın, FX Volume önemli dengesizlikleri belirlemenize, kırılmaları (breakout) doğrulamanıza ve risk yönetiminizi iyileş
Yazarın diğer ürünleri
KT Momentum Arrows MT5
KEENBASE SOFTWARE SOLUTIONS
5 (2)
KT Momentum Arrows göstergesi, belirli bir yönde meydana gelen bant sapması ve ortaya çıkan volatiliteye dayalı olarak hesaplanan ani kırılmalara dayanır. Fiyat üst banda kapanış yaparsa alış sinyali, alt banda kapanış yaparsa satış sinyali üretilir. Tek bir katsayı (Magnitude Coefficient), bant sapması ve volatilite hesaplamasını aynı anda etkiler. Bu değer, kullanılan enstrümana ve zaman dilimine göre dikkatlice seçilmelidir. Temel Özellikler Repaint yok! Momentum odaklı işlem yapanlar için
KT Asian Breakout
KEENBASE SOFTWARE SOLUTIONS
4 (1)
KT Asian Breakout carefully analyzes the range-bound market during the Asian session and then fires a long or short trade after doing some preassessment based on its inbuilt technical analysis module. The executed orders are closed within a day before the completion of the next day session. The inbuilt technical analysis module checks for the session range and compares it with the last 20 days price movement. If it finds any erratic price movement within the session, the orders are not executed
Use of support and resistance in systematic trading is very subjective. Every trader has their own idea and way to plotting the support and resistance levels on the chart. KT Support and Resistance indicator take out this ambiguity out of the situation and automatically draws support and resistance levels following an algorithmic approach using a unique multi-timeframe analysis. When launched on the chart, It immediately scan the most significant extreme points across all the available timefra
ACB Breakout Arrows
KEENBASE SOFTWARE SOLUTIONS
4.15 (34)
ACB Breakout Arrows göstergesi, özel bir kırılma modelini tespit ederek piyasada kritik bir giriş sinyali sağlar. Gösterge, belirli bir yönde güçlenen momentumu sürekli tarar ve büyük bir hareket başlamadan hemen önce doğru giriş sinyalini verir.  Çoklu sembol ve çoklu zaman dilimi tarayıcıyı buradan edinin - ACB Breakout Arrows MT4 için Tarayıcı Temel Özellikler Gösterge, Stop Loss ve Take Profit seviyelerini otomatik olarak sağlar. Tüm zaman dilimlerinde kırılma sinyallerini takip eden MTF Ta
ACB Breakout Arrows MT5
KEENBASE SOFTWARE SOLUTIONS
5 (1)
ACB Breakout Arrows göstergesi, özel bir kırılma modelini tespit ederek piyasada önemli bir giriş sinyali sağlar. Göstergenin algoritması, fiyatın belirli bir yönde ivme kazandığı anları sürekli olarak tarar ve ana hareketten hemen önce doğru giriş sinyali verir. Çok sembollü ve çok zaman dilimli tarayıcıyı buradan alın - ACB Breakout Arrows MT5 için Tarayıcı Temel Özellikler Gösterge, Stop Loss ve Take Profit seviyelerini otomatik olarak belirler. Tüm zaman dilimlerinde kırılma sinyallerini i
KT RSI Divergence Robot MT4
KEENBASE SOFTWARE SOLUTIONS
KT RSI Divergence robot, fiyat ile Relative Strength Index (RSI) osilatörü arasında oluşan normal ve gizli uyumsuzlukları (divergence) alıp satan %100 otomatik bir uzman danışmandır. Uyumsuzluk sinyalleri, ücretsiz olarak sunduğumuz RSI Divergence göstergesinden alınır. Her uyumsuzluk başarılı bir fiyat dönüşüyle sonuçlanmaz; bu nedenle EA, ham uyumsuzluk sinyallerini yerleşik teknik analiz modülüyle birleştirerek seçilen bazı sinyallerden sonra ortaya çıkan fiyat verimsizliğinden yararlanır.
KT CCI Divergence MT5
KEENBASE SOFTWARE SOLUTIONS
KT CCI Divergence shows the regular and hidden divergence created between the price and CCI oscillator. Divergence is one of the vital signals that depicts the upcoming price reversal in the market. Manually spotting the divergence between price and CCI can be a hectic and ambiguous task. Limitations of KT CCI Divergence   Using the CCI divergence as a standalone entry signal can be risky. Every divergence can't be interpreted as a strong reversal signal. For better results, try to combine it w
ACB Trade Filter MT4
KEENBASE SOFTWARE SOLUTIONS
5 (1)
The ACB Trade Filter indicator provides a solution for filtering out the low probability trading setups in a trading strategy. The indicator uses a sophisticated filtration algorithm based on the market sentiment and trend. Applications Works great with our indicator " ACB Breakout Arrows ". Filter out low probability signals from any indicator. Avoid overtrading and minimize the losses. Trade in the direction of market sentiment and trend. Avoid the choppiness in the market. How to use Only L
KT Momentum Arrows
KEENBASE SOFTWARE SOLUTIONS
KT Momentum Arrows göstergesi, belirli bir yönde meydana gelen bant sapması ve ortaya çıkan volatiliteye dayalı olarak hesaplanan ani kırılmalara dayanır. Fiyat üst banda kapanış yaparsa alış sinyali, alt banda kapanış yaparsa satış sinyali üretilir. Tek bir katsayı (Magnitude Coefficient), bant sapması ve volatilite hesaplamasını aynı anda etkiler. Bu değer, kullanılan enstrümana ve zaman dilimine göre dikkatlice seçilmelidir. Temel Özellikler Repaint yok! Momentum odaklı işlem yapanlar için
KT COG Advanced MT4
KEENBASE SOFTWARE SOLUTIONS
1 (1)
KT COG is an advanced implementation of the center of gravity indicator presented by John F. Ehlers in the May 2002 edition of Technical Analysis of Stocks & Commodities magazine. It's a leading indicator which can be used to identify the potential reversal points with the minimum lag. The COG oscillator catches the price swings quite effectively. MT5 version of the same indicator is available here KT COG Advanced MT5 Calculation of COG The COG indicator is consist of the two lines. The main l
KT Pin Bar
KEENBASE SOFTWARE SOLUTIONS
KT Pin Bar identifies the pin bar formation which is a type of price action pattern which depicts a sign of reversal or rejection of the trend. When combined with support and resistance, BRN and other significant levels, Pin Bar pattern proved to be a very strong sign of reversal. Basically, a pin bar is characterized by a small body relative to the bar length which is closed either in upper or lower 50% part of its length. They have very large wicks and small candle body. A pin bar candlestic
KT Trend Magic
KEENBASE SOFTWARE SOLUTIONS
KT Trend Magic shows the trend depiction on chart using the combination of market momentum and volatility. A smoothing coefficient is used to smooth out the noise from the signal.It can be used to find out the new entries or confirm the trades produced by other EA/Indicators. Usage Drag n drop MTF scanner which scans for the new signals across multiple time-frames. Find new entries in the trend direction. Improve the accuracy of other indicators when used in conjunction. Can be used as a dynami
KT Auto Fibo
KEENBASE SOFTWARE SOLUTIONS
KT Auto Fibo, mevcut trend yönüne göre Fibonacci düzeltme seviyelerini otomatik olarak çizer. En yüksek ve en düşük noktalar, grafikteki mevcut maksimum ve minimum değerler kullanılarak otomatik olarak seçilir. Fibonacci seviyelerini buna göre ayarlamak için grafiği yakınlaştırabilir, uzaklaştırabilir ve kaydırabilirsiniz. Modlar Otomatik:  Grafik alanına göre Fibonacci seviyelerini otomatik olarak çizer. Manuel: Fibonacci seviyelerini yalnızca bir kez çizer. Daha sonra, bağlantı noktalarını ma
KT Psar Arrows
KEENBASE SOFTWARE SOLUTIONS
KT Psar Arrows, standart Parabolic SAR göstergesini kullanarak grafikte oklar çizer. Mumun en yüksek noktası SAR'a temas ettiğinde yükseliş oku çizilir. Mumun en düşük noktası SAR'a temas ettiğinde düşüş oku çizilir. Sinyaller, mum kapanışını beklemeden gerçek zamanlı olarak üretilir.  Özellikler Parabolic SAR göstergesini kullanan ticaret stratejilerini denemek isteyen yatırımcılar için faydalı bir araçtır.  Piyasadaki dönüş noktalarını bulmak için kullanılabilir. Özel PSAR girişlerini destekl
KT Ichimoku Trader
KEENBASE SOFTWARE SOLUTIONS
1 (1)
KT Ichimoku Trader is a fully automated expert advisor that offers five popular trading strategies based on the Ichimoku indicator. Each strategy has it's own entry and exit method without any interference to other strategies. The Ichimoku system can be applied to all major currency pairs and metals. However, we found that it performs reasonably well mainly on two pairs.   MT5 Version is available here  https://www.mql5.com/en/market/product/35043 Features Trade up to 5 famous trading strategi
KT Volatility Oscillator
KEENBASE SOFTWARE SOLUTIONS
KT Volatilite Osilatörü, geçmiş ve mevcut piyasa verilerini matematiksel bir formül kullanarak analiz eder ve sonucu bir osilatör formunda gösterir. Yükselen ve azalan dalgalar, varlığın yüksek ve düşük volatilitesine karşılık gelir.  Kısaca, volatilite bir varlığın belirli bir zaman diliminde fiyat dalgalanmalarının ölçüsüdür. Volatilite olmasaydı, piyasada çok az hareket olurdu ve traderlar fiyat değişimlerinden kazanç sağlayamazdı. Forex Piyasasında Volatilite Kullanımı Forex piyasasında vol
KT COG Robot
KEENBASE SOFTWARE SOLUTIONS
KT COG Robot is a fully automated Expert Advisor based on the KT COG Indicator . The COG indicator was originally presented by John F. Ehlers in the May 2002 edition of Technical Analysis of Stocks & Commodities magazine. The EA fires a long trade when COG line cross above the signal line and a short trade is fired when the COG line cross below the signal line.  Adaptive Filtration Our adaptive filtration algorithm combines the original COG formula with the major trend direction and market acce
ACB Breakout Arrows EA
KEENBASE SOFTWARE SOLUTIONS
Bu, özel olarak geliştirdiğimiz "ACB Breakout Arrows" adlı göstergemize dayalı %100 otomatik bir uzman danışmandır. Girişler, iki yönlü olarak sık sık oluşan bir kırılma modeline dayanır. Giriş sinyallerinin şiddeti, "Signal Sensitivity" adlı harici girişle ayarlanabilir. İşlem Onayı ACB Breakout Arrows EA, başka bir özel göstergemiz olan ACB Trade Filter kullanılarak girişleri filtreleme yeteneği sunar. Güçlü Al: Yukarı ok + Yeşil histogram + Yükseliş trendi Güçlü Sat: Aşağı ok + Kırmızı hist
KT London Breakout
KEENBASE SOFTWARE SOLUTIONS
First thirty minutes are essential for a trading session. The early reaction of traders and market players sets a path for the rest of the day. KT London Breakout EA takes advantage of this phenomenon, and after analyzing the first thirty minutes of London session, it places two bidirectional pending orders. One of pending order is eventually canceled after realizing the market direction with certainty. It has been strictly tested and developed for EUR/JPY using 30-Min Time Frame. You can expe
Use of support and resistance in systematic trading is very subjective. Every trader has their own idea and way to plotting the support and resistance levels on the chart. KT Support and Resistance indicator take out this ambiguity out of the situation and automatically draws support and resistance levels following an algorithmic approach using a unique multi-timeframe analysis. When launched on the chart, It immediately scan the most significant extreme points across all the available timefra
Eğer Forex piyasasında işlem yapıyorsanız, döviz gücü ve döviz çiftleri arasındaki korelasyon hakkında ayrıntılı bilgi sahibi olmak, işlem performansınızı yeni bir seviyeye taşıyabilir. Korelasyon, riskinizi yarıya indirmenize yardımcı olurken, güç analizi kârınızı maksimize etmenizi sağlar. Bu gösterge, döviz gücü analizi ile döviz çiftleri korelasyonunu birleştirerek en uygun döviz çiftlerini seçmek için hibrit bir yaklaşım sunar. Döviz Gücü Analizi Nasıl Kullanılır Örneğin, işlem stratejiniz
MACD Divergence Seeker
KEENBASE SOFTWARE SOLUTIONS
KT MACD Divergence Seeker trades the regular and hidden divergence signals generated by our free indicator named KT MACD Divergence indicator. Trading the standalone divergences can be a risky affair that's why the KT MACD Divergence Seeker combines the standard divergence signals with an advanced analysis module to exploit the price inefficiencies on some FX pairs. What is the Divergence exactly? As a general conception if the price is making higher highs, then macd should also be making hig
KT Asian Breakout Indicator
KEENBASE SOFTWARE SOLUTIONS
KT Asian Breakout göstergesi, Asya seansının kritik bir bölümünü analiz ederek fiyatın kırılma yönüne göre çift yönlü alım ve satım sinyalleri üretir. Fiyat seansın en yüksek seviyesini kırarsa alım sinyali oluşur, en düşük seviyesini kırarsa satış sinyali oluşur. Dikkat Edilmesi Gerekenler Eğer seans kutusu dikey olarak çok genişse, yeni bir işlemden kaçınılmalıdır çünkü fiyat hareketlerinin büyük bir kısmı zaten bu kutu içinde gerçekleşmiştir. Eğer kırılma mumu çok büyükse, fiyat genellikle s
MACD Divergence MT4
KEENBASE SOFTWARE SOLUTIONS
KT MACD Divergence, fiyat ile osilatör arasında oluşan düzenli ve gizli uyumsuzlukları gösterir. Eğer ticaret stratejinizde trend dönüşü bekleniyorsa, potansiyel dönüş noktalarını belirlemek için MACD’nin düzenli uyumsuzluğunu kullanabilirsiniz. Trendin devamına dayalı stratejilerde ise MACD’nin gizli uyumsuzluğu daha uygun bir tercih olacaktır. KT MACD Divergence'nın Sınırlamaları MACD uyumsuzluğunu tek başına giriş sinyali olarak kullanmak riskli olabilir. Her uyumsuzluk mutlaka bir trend dö
KT Bollinger Bands Trader MT4
KEENBASE SOFTWARE SOLUTIONS
KT Bollinger Bands Trader, düşük volatilite dönemlerinde Bollinger Bantlarını kullanarak ortalamaya dönüş stratejisi uygulayan %100 otomatik bir uzman danışmandır (Expert Advisor). Fiyat genellikle Bollinger Bantlarının üst veya alt çizgisine tepki verir, ancak her zaman bir dönüş gerçekleşmez. Bununla birlikte, düşük volatilite dönemlerinde fiyat dönüşü olasılığı daha yüksektir. Girişler Fiyat Bollinger Bantlarının alt çizgisinin altına doğru şekilde hizalandığında alış işlemi başlatılır. Fiya
KT CCI Divergence MT4
KEENBASE SOFTWARE SOLUTIONS
KT CCI Divergence shows the regular and hidden divergence created between the price and CCI oscillator. Divergence is one of the vital signals that depicts the upcoming price reversal in the market. Manually spotting the divergence between price and CCI can be a hectic and ambiguous task. Limitations of KT CCI Divergence   Using the CCI divergence as a standalone entry signal can be risky. Every divergence can't be interpreted as a strong reversal signal. For better results, try to combine it w
KT Heiken Ashi Smoothed MT4
KEENBASE SOFTWARE SOLUTIONS
KT Heiken Ashi Smoothed, standart Heiken Ashi’nin yumuşatılmış sürümüdür; ayrıca trend değişiminde al/sat okları çizer. Durum ayıdan boğaya döndüğünde alım oku çizilir. Durum boğadan ayıya döndüğünde satım oku çizilir. Mobil bildirim, e-posta, ses ve pop-up uyarıları dahildir. Heiken Ashi Smoothed tam olarak nedir? Standart Heiken Ashi’deki yalancı sinyalleri ve gürültüyü iki hareketli ortalama ile filtreleyerek fiyatı yumuşatır. Bir miktar gecikme olsa da, salınım noktalarını ve yeni oluşan t
KT MA Crossover MT4
KEENBASE SOFTWARE SOLUTIONS
KT MA Crossover, seçilen hareketli ortalamaların kesişimine göre alım ve satım oklarını çizer. Ayrıca her ardışık sinyal için uygun uyarıları üretir ve MFE (En Avantajlı Sapma) değerini görüntüler. Hareketli ortalama kesişimi, dünya çapında trader'lar tarafından yaygın olarak kullanılan temel stratejilerden biridir. Genellikle biri hızlı, diğeri yavaş olmak üzere iki hareketli ortalamadan oluşur ve kesişim yönüne göre alım ya da satım sinyali üretir. Alım sinyali – hızlı MA, yavaş MA'nın üzerin
KT Round Numbers MT4
KEENBASE SOFTWARE SOLUTIONS
KT Round Numbers plots the round number levels which are also commonly known as psychological levels in the Forex world. In the context of Forex trading, round number levels are those levels in which there are two or more zeroes at the end. They are named as 00 levels on the chart. Some traders also consider the halfway points as a valid round number level. They are named as 50 levels on the chart. Use of round number levels in trading Round number levels work as strong support and resistance
KT Inside Bar Advanced MT4
KEENBASE SOFTWARE SOLUTIONS
Despite the popularity of inside bar pattern among the traders, using it as a standalone signal doesn't provide any edge in the market. KT Inside Bar Advanced indicator solves this problem by combining the classic inside bar pattern with the "ECE" cycle and Fibonacci extensions. Using this indicator in place of our classic inside bar indicator will provide a tremendous advantage and edge in the market. What is the ECE cycle? In financial markets, the price never moves in a straight line but u
Filtrele:
Değerlendirme yok
Değerlendirmeye yanıt