FlatOut Movings Indicator

☑ FlatOut Movings Robot: 횡보장 완벽 제어. 추세장에서의 자신감 넘치는 항해.
이동평균선(Movings) 기반의 지표 전략에는 치명적인 악몽이 존재합니다. 시장이 추세를 바꾸는 순간, 여러분의 예금은 녹아내리기 시작합니다. 클래식한 이동평균선은 횡보장에서 수십 개의 가짜 교차(데드/골든크로스)를 만들어냅니다. 게다가 표준 필터들은 가차 없이 뒤처집니다. 여러분은 밤새 터미널 앞에서 스트레스를 받으며 모니터를 지키다가, 움직임이 끝나는 바로 그 시점에 진입하게 됩니다.
이 소프트웨어는 구체적인 문제를 해결하기 위해 탄생했습니다. 로봇은 차트를 끊임없이 스캔하며 호가창(Order book)의 내부 정보처럼 시장 구조를 읽어냅니다. 깊은 횡보장에서도, 강력한 추세 충격(모멘텀) 속에서도 똑같이 효과적으로 거래를 수행합니다. 시스템은 마치 메스로 도려내듯 실제 돌파와 박스권으로의 가짜 돌파를 예리하게 분리해 냅니다.
⏳ 시장 혼돈의 시대를 견뎌낸 시간의 검증
이 소프트웨어의 수학적 핵심은 서로 교차하는 수십 년간의 혼돈스러운 가격 폭풍 주기를 통과하며 백테스팅을 마쳤습니다. 이 알고리즘은 어떠한 글로벌 금융 위기와 시장의 세대교체도 버텨낼 수 있도록 설계되었습니다.
⚡️ 모멘텀 헌터: 로봇은 가격이 최소 저항 벡터를 따라 무섭게 돌진하는 돌아올 수 없는 지점(Point of No Return)에서 거래에 진입합니다. 진입 타점이 매우 정교하게 계산되어 있어, 포지션이 역방향 압력(Drawdown)을 받는 일이 거의 없습니다.
🎰 연쇄 지배자: 로봇은 혼란스러운 방황을 모릅니다. 로봇의 행동은 엄격한 수학적 질서에 지배됩니다. 파도를 잡으면 청산된 거래의 조밀하고 연속적인 폭포(캐스케이드)를 생성합니다. 알고리즘은 추세 모멘텀이 소진될 때까지 포지션을 연달아 구축하며 끈질기게 추세를 붙잡습니다. 드물게 발생하는 손절(Stops)은 그에게 비극이 아니라 조준경을 다시 보정하는 과정일 뿐입니다.
↕ 호가창 양방향 청소: 로봇은 롱(Long)과 숏(Short) 모두에서 똑같이 효율적으로 작동합니다. 보고서상의 양방향 거래 비율은 균형을 이룹니다. 과거 데이터에 맞추기 위한 무작위적이고 수동적인 파라미터 최적화(과최적화)는 없습니다.
🕸 철옹성 그리드 전략가: 장기 횡보나 가짜 돌파의 순간에도 아주 작은 손실(Drawdown) 때문에 포지션을 성급하게 자르지 않습니다. 로봇은 포지션 포위 작전 모드로 전환하여 유연하고 분산된 오더 그리드(그물망)를 펼칩니다. 로봇은 차분하게 미실현 리스크를 흡수하며 마진 압박을 완벽하게 통제합니다.
🎯 냉철한 스나이퍼: 소프트웨어는 완벽한 진입 시점을 기다려 탁월한 수학적 효율성과 강력한 복구 팩터(Recovery Factor)를 보장합니다.
🎁 알고리즘 무료 테스트
더 이상 모니터 앞에서 24시간 내내 긴장하며 신경과 시간을 낭비할 필요가 없습니다. 기술적 솔루션은 작동할 준비가 완벽히 되어 있습니다. 타인의 말을 믿지 마세요. 실제 과거 데이터로 알고리즘을 직접 검증해 보십시오.
지금 바로 자산을 지킬 보호 도구를 가져가세요!

   1. 이 마켓 페이지의 "데모 다운로드" 버튼을 누릅니다.
   2. 터미널의 전략 테스터를 열고 원하는 과거 데이터 구간을 선택합니다.
   3. 테스트를 실행하고 시스템이 시장의 소음(노이즈)을 어떻게 걸러내는지 직접 확인하십시오.

자주 묻는 질문(FAQ):

   1. 이 제품은 어떤 통화쌍에 최적화되어 있습니까?
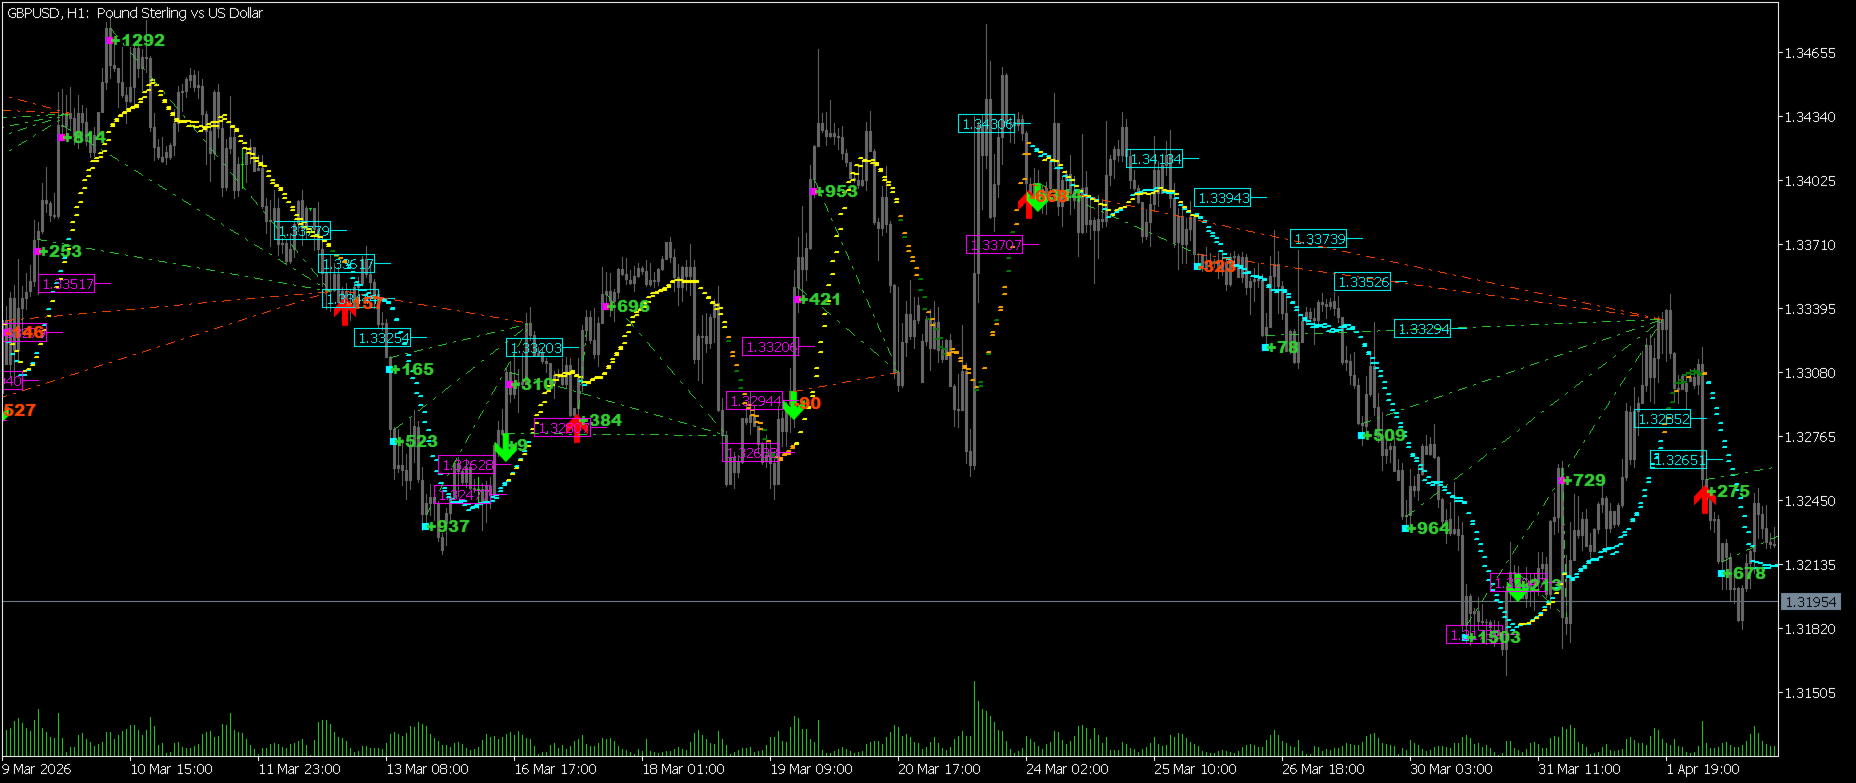
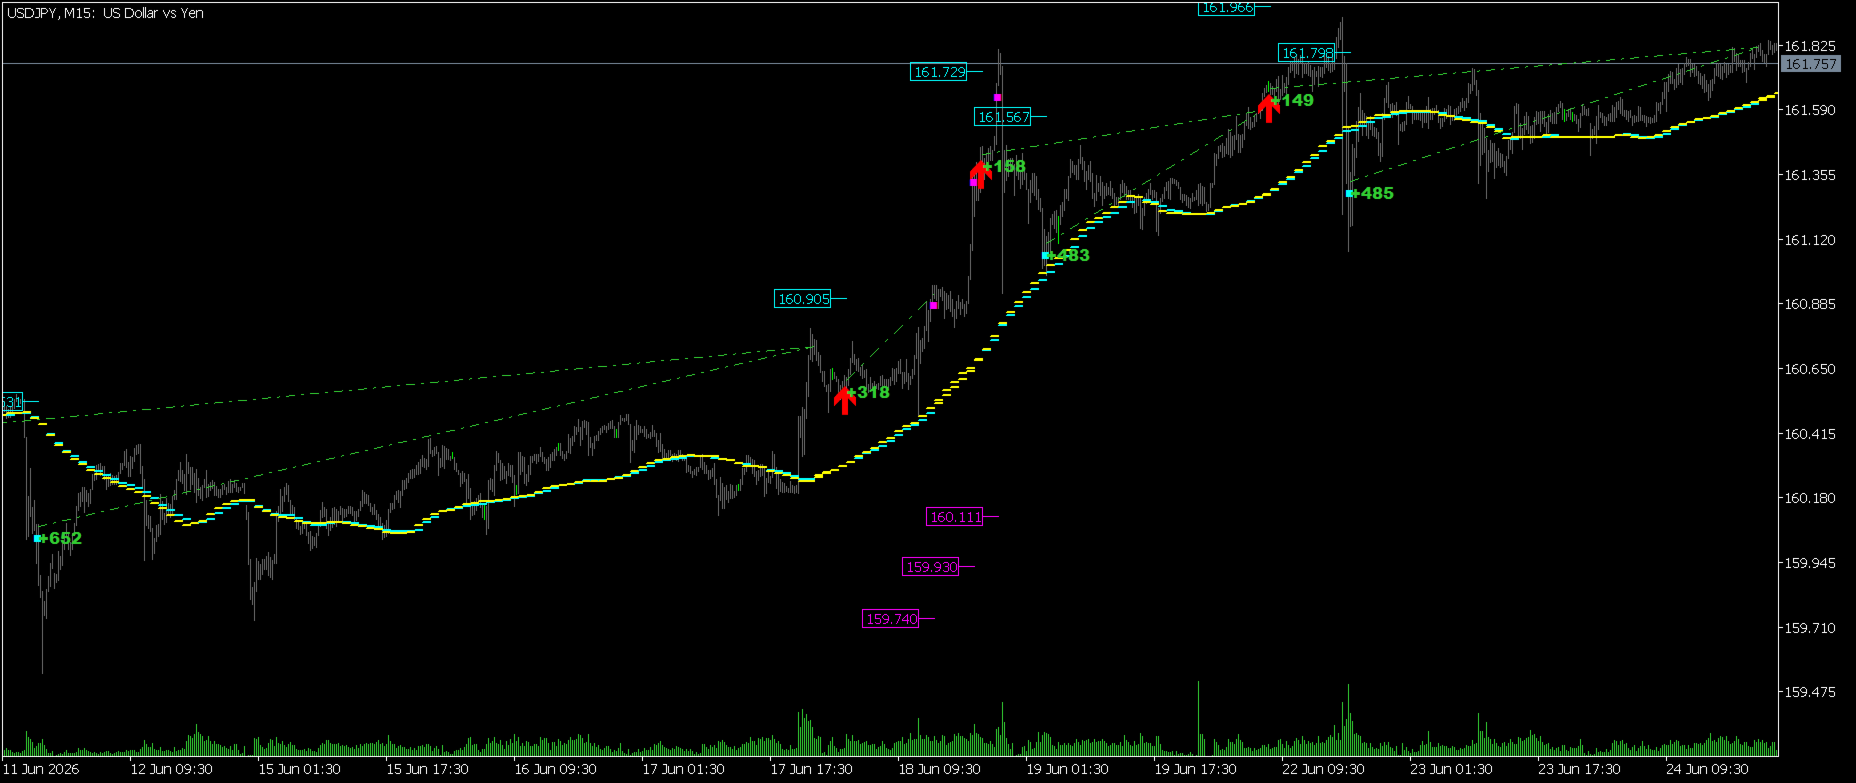
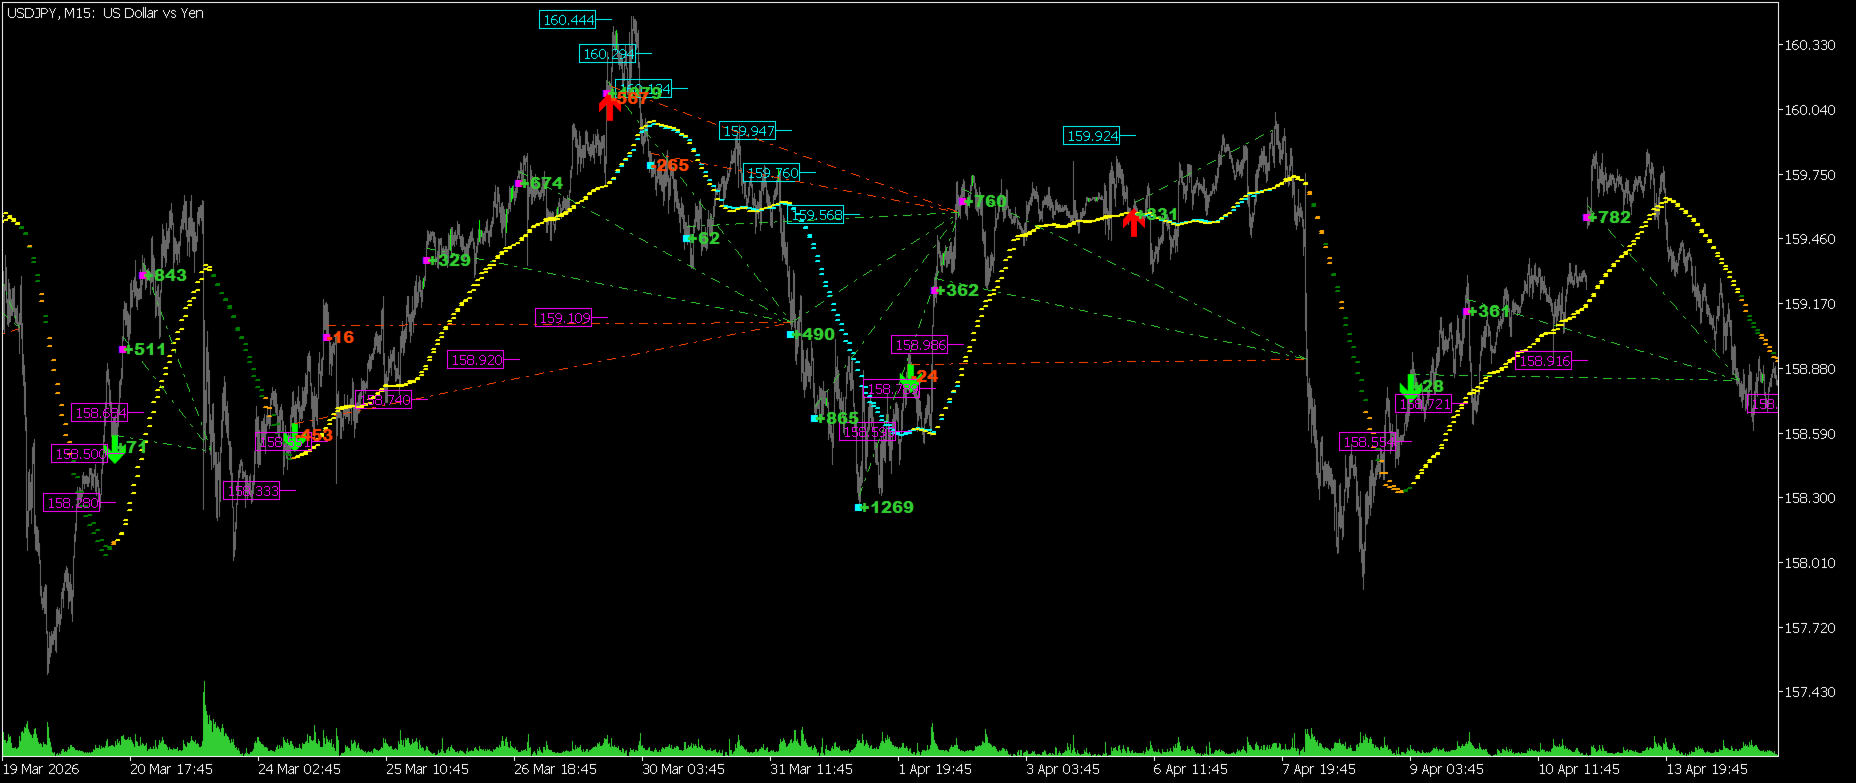
   이 Inicator 는 기술적으로 모든 통화쌍에서 기본 설정으로 작동합니다. 하지만 본 프로그램은 EURUSD, GBPUSD, USDJPY 거래에 특화되어 설계되었습니다. 바로 이 통화쌍들에서 최고의 효율성을 보여줍니다.
   2. 어떤 타임프레임(Timeframe)에서 실행하는 것이 좋습니까?
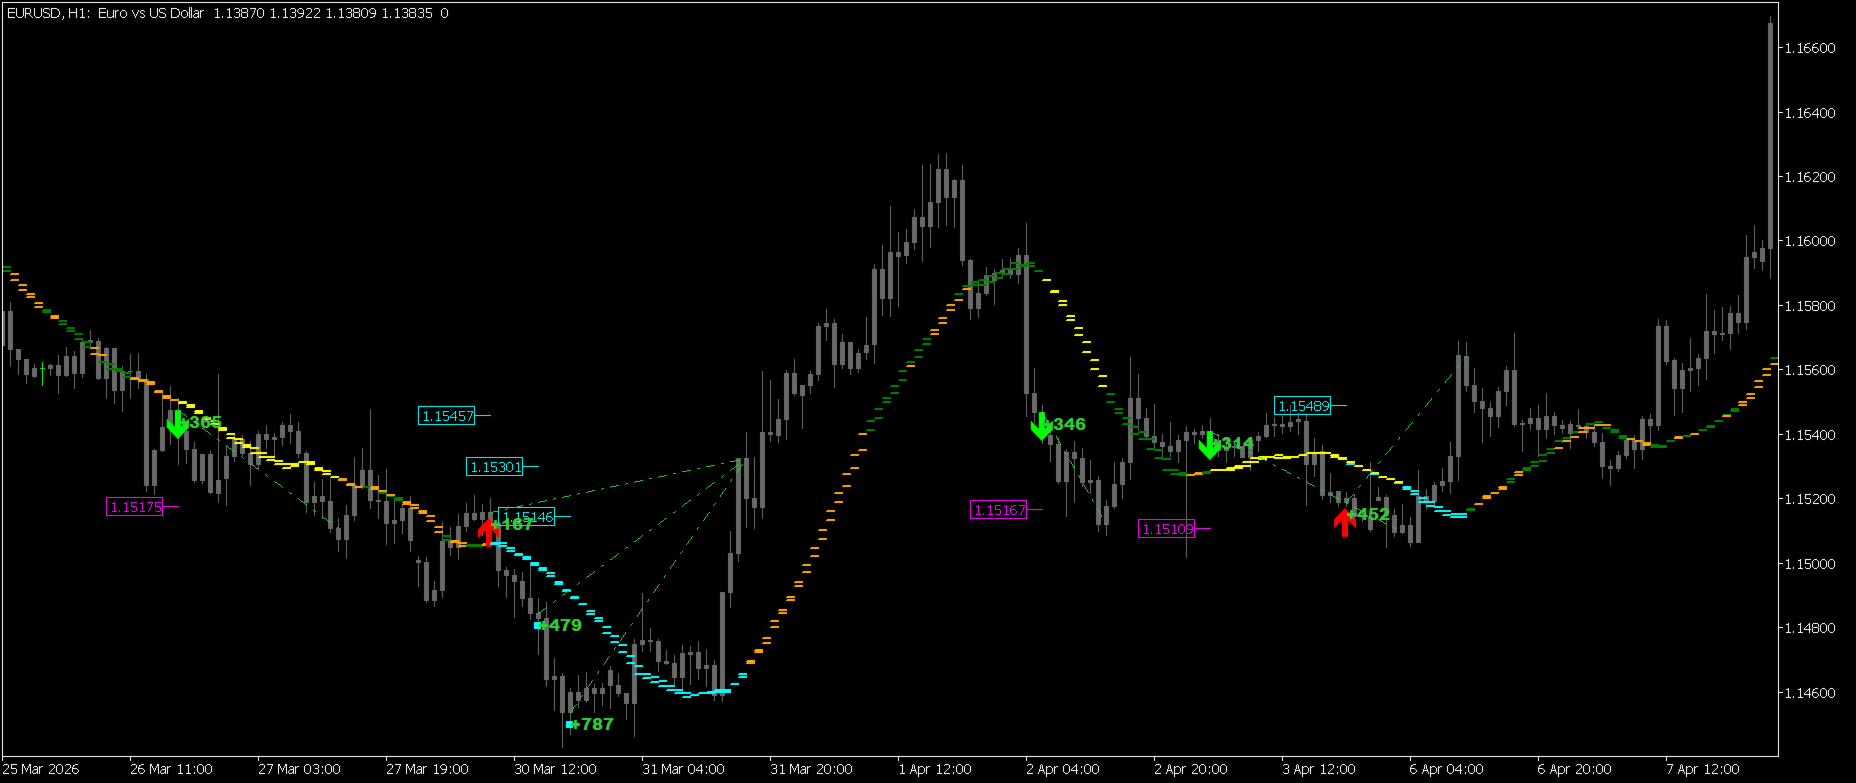
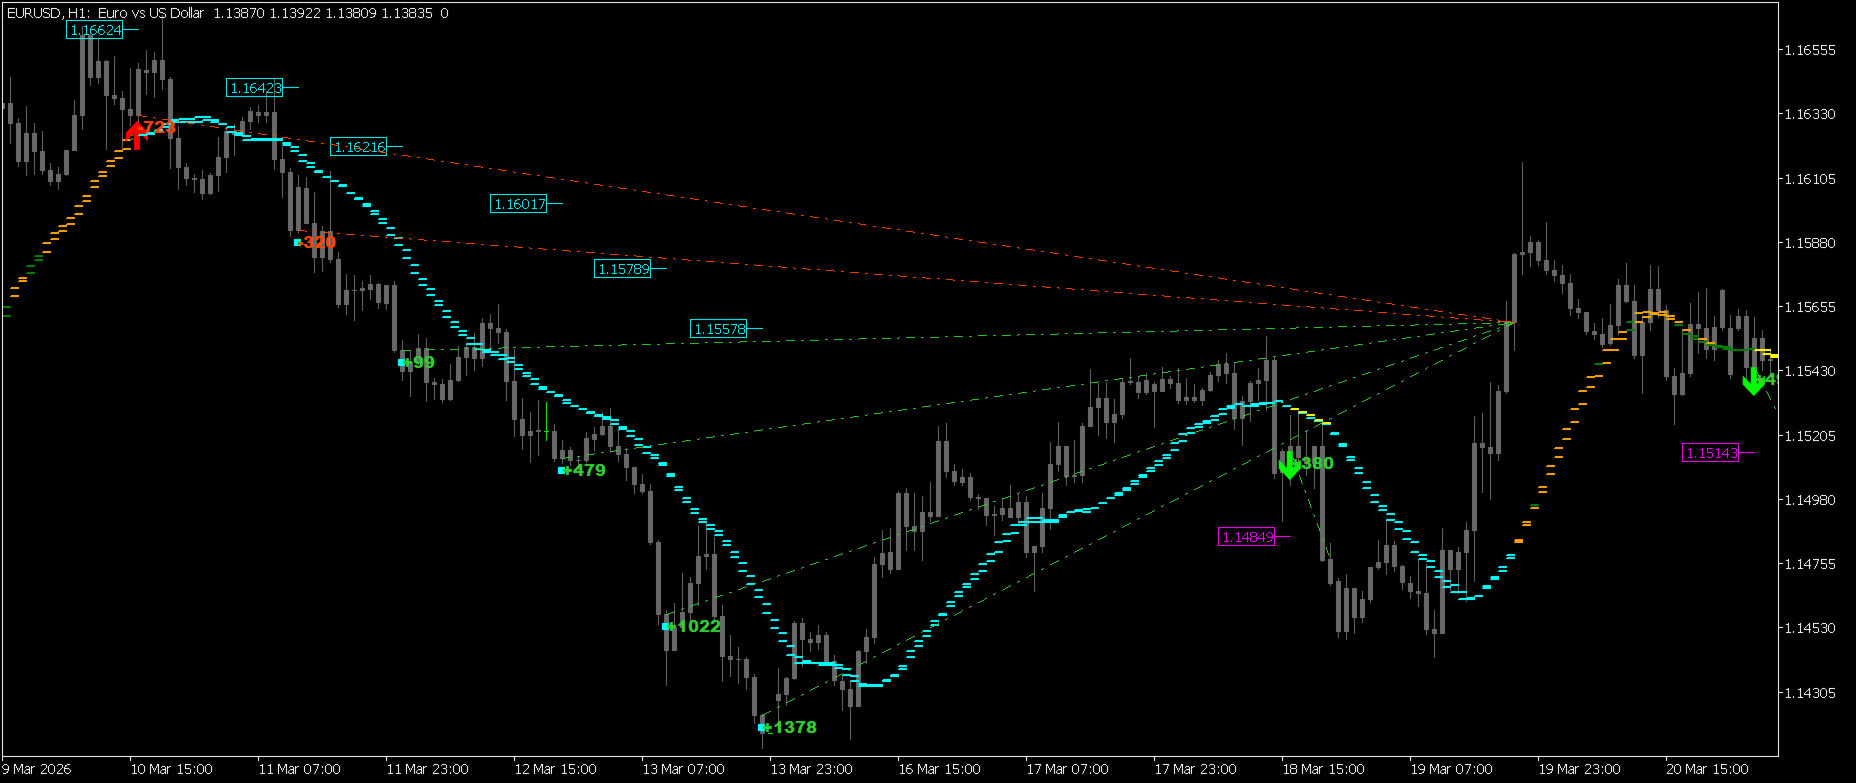
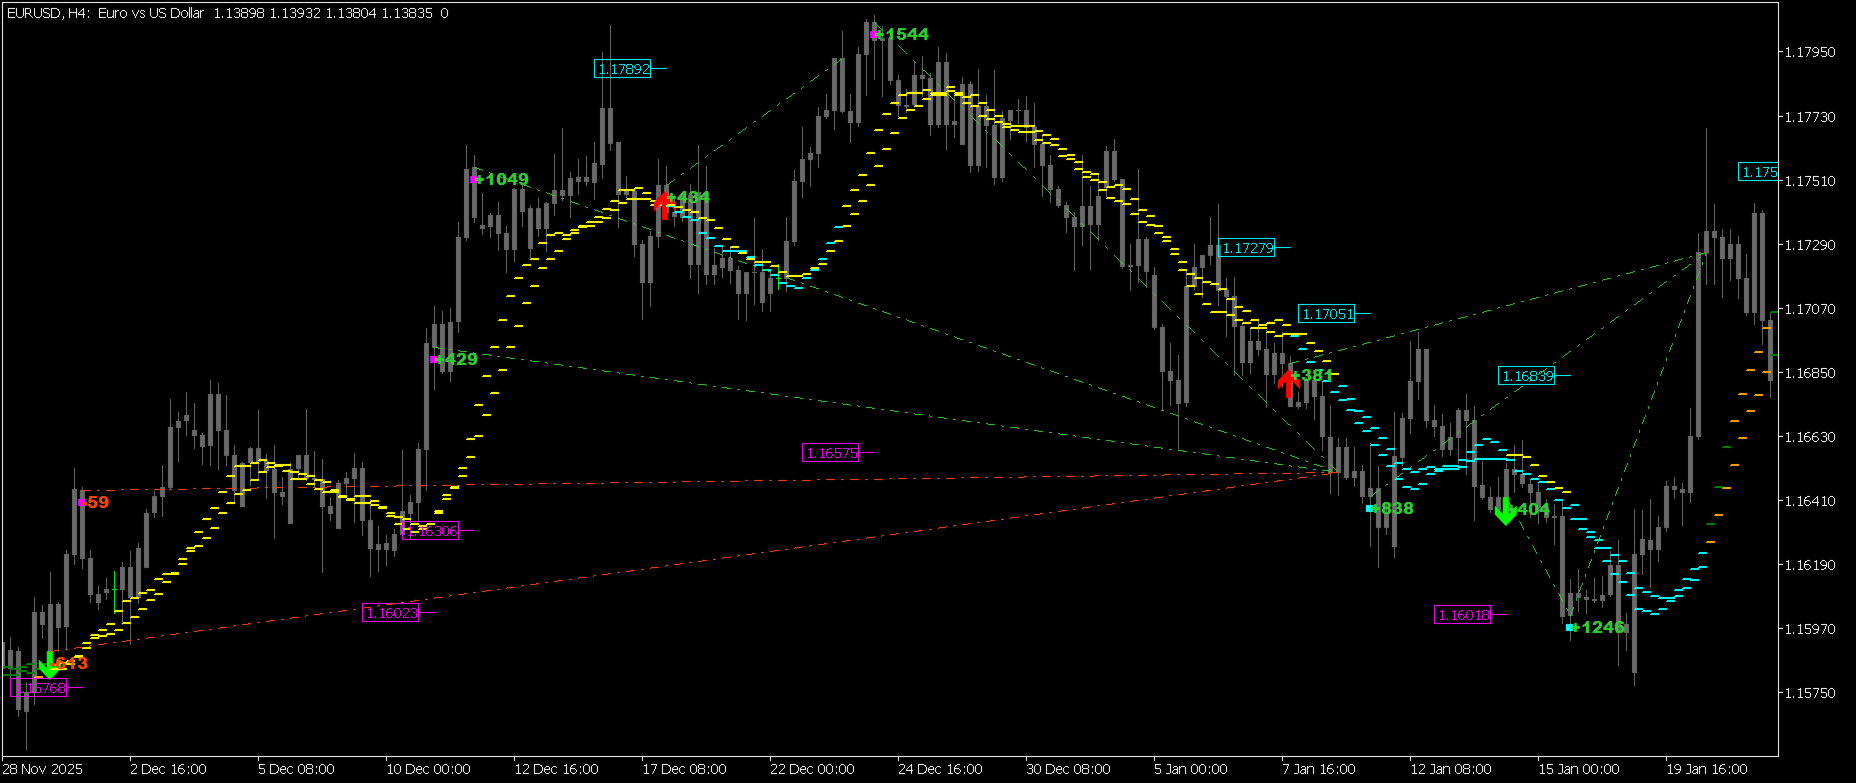
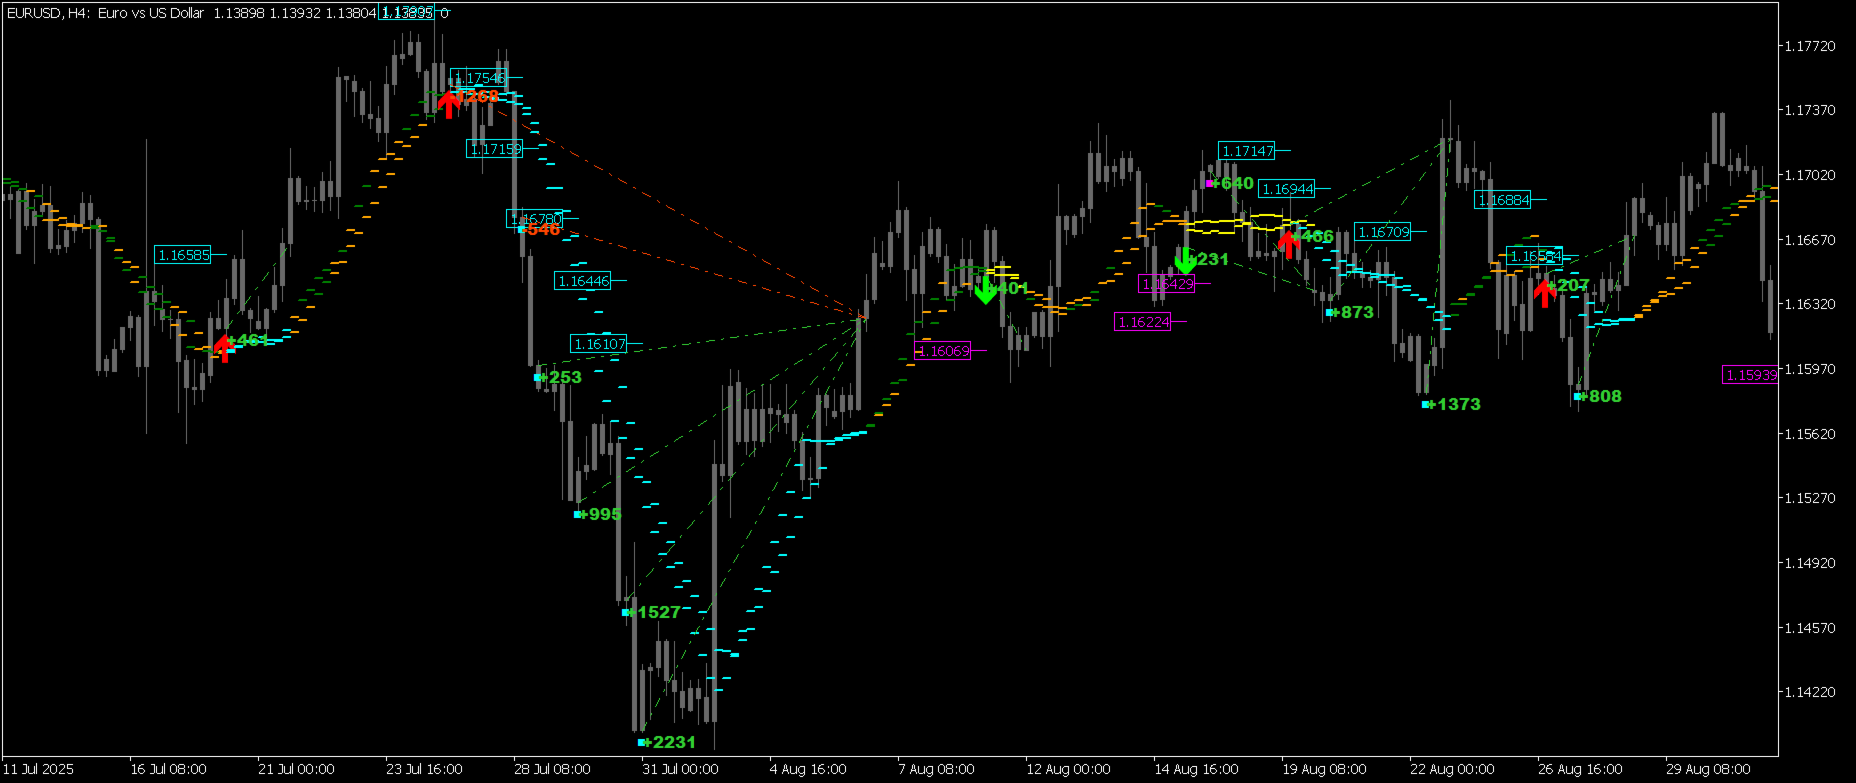
   🦎 적응형 카멜레온: 타임프레임은 로봇에게 단지 하나의 광학 렌즈일 뿐입니다. 짧은 주기의 차트(M15, M30, H1)에서는 속사포 같은 스캘퍼로 작동합니다. 더 긴 주기의 차트(H2, H4)에서는 스텝을 넓혀 시장의 밀도를 모놀리식하고 필터링된 포지션 결정으로 변환합니다. 로봇은 캔들의 밀도에 완벽하게 적응하며, 브로커 내부의 캔들 내 노이즈는 완전히 차단됩니다. 따라서 M15, M30, H1, H2, H4에서 제품을 실행할 수 있습니다.
   3. EA에 적합한 계좌 유형은 무엇입니까?
   표준 넷팅(Netting) 방식은 EA의 로직과 기술적으로 호환되지 않으므로, 양방향 주문을 지원하는 헤징(Hedging) 계좌가 필요합니다. 대자금의 경우 ECN/Raw 유형, 10,000달러 미만의 예금에는 Cent 계좌, 또는 1:100 이상의 레버리지를 제공하는 Swap-Free 계좌가 가장 좋은 선택입니다.
   4. 최소 얼마의 증거금으로 거래를 시작할 수 있습니까?
   한 쌍의 경우 표준 계좌 기준 800~1,000달러(센트 계좌는 10달러)가 필요합니다. 2개 또는 3개 통화쌍의 경우 금액이 비례하여 증가합니다: 표준 계좌 기준 2K/3K 달러(센트 계좌는 20/30달러).
   5. 과거 백테스트상의 최대 낙폭(Drawdown)은 얼마입니까?
   55년간의 역사적 백테스트 결과, 에퀴티(Equity) 기준 최대 floating drawdown은 다음과 같습니다: EURUSD 7.08%, GBPUSD 9.31%, USDJPY는 단 4.17%였습니다. 밸런스(Balance) 기준 상대적 낙폭은 역사적으로 2.27% ~ 16.95% 사이에서 움직였습니다.
   6. 세 가지 통화쌍을 모두 함께 실행할 수 있습니까 (다른 매직 넘버 사용)?
   네, 매우 현명한 방법입니다. 서로 다른 매직 넘버(Magic Number)를 사용하여 EURUSD, GBPUSD, USDJPY를 동시에 실행하면 앙상블 효과가 발생합니다. 각 통화쌍이 독립적으로 거래되면서 서로의 낙폭을 상쇄하고, 안정적이고 다변화된 거래 흐름을 만들어냅니다.
   7. 시작할 때 어떤 설정을 사용해야 합니까?
   📦 박스를 열자마자 누리는 완전한 자율성: 파라미터를 수동으로 조정하거나 수백 페이지의 매뉴얼을 읽어야 하는 번거로움은 잊으십시오. 이 제품은 처음부터 주요 통화쌍의 특성에 맞게 최적화되어 있습니다. 로봇은 자동으로 차트를 스캔하고 통화쌍을 인식하여 즉시 작업에 착수합니다. 단 몇 번의 클릭만으로 쉽게 시작할 수 있습니다. 추천 통화쌍 차트에 EA를 부착하고, 원하는 타임프레임을 선택한 뒤, 포트폴리오 다변화를 위한 고유한 매직 넘버만 설정하면 됩니다.
   8. Indicator가 정상 작동하기 시작했는지 어떻게 확인합니까?
   아주 간단합니다:  설정에서 'Enable: Detailed operational logs' 파라미터를 켜면 화면 자체에 시스템 상태 텍스트가 표시되며, '전문가(Experts)' 탭에서 작업 로그가 업데이트되기 시작합니다 (1~4시간마다 상세 보고서 출력).
   9. 타임프레임을 전환할 때 화면이 멈추는(프리징) 이유는 무엇입니까?
   🌀 시장의 양자 스냅샷: 최초 실행 시, 타임프레임 변경 시 또는 연결이 끊겼다 재연결될 때 터미널은 전체 히스토리에 대한 철저한 전수 조사를 수행하느라 잠시 멈추게 됩니다. 시스템은 가격 왜곡을 완전히 배제하고 포지션을 보호하기 위한 완벽한 수학적 모델을 전개하기 위해 잠시 숨을 고르는 것입니다.
   10. 실제 오더가 열리지 않았는데 왜 시스템은 그것을 계산에 넣었습니까?
   💻 디지털 자율성: 로봇의 내부 수학은 시장의 현실보다 우위에 있습니다. 이것은 본 EA만의 독특한 보호 기능입니다. 연결 끊김이나 브로커의 슬리피지(Slippage)로 인해 실제 오더가 체결되지 않은 경우, 로봇은 모델의 메모리 속에 가상(Virtual) 오더로 즉시 반영합니다. 로봇에게는 자신의 수학적 모델의 무결성을 엄격하게 유지하는 것이 무엇보다 중요하며, 이는 시장의 혼돈으로부터 스스로를 지키는 가장 강력한 방패입니다. 이를 위해 시스템은 하나의 그리드 내에서 최소한의 기술적 손실을 의도적으로 감수하기도 합니다. 캔들 시가 근처에서 가격이 출렁이는 동안 로봇이 최대 10번까지 오더 진입을 시도하므로, 이러한 시나리오는 매우 드물게 발생합니다.
   11. 지표가 신호를 리페인팅(과거 신호 재수정)합니까? 그리고 컴퓨터를 끄면 어떻게 됩니까?
   지표는 뒤처지지 않으며 신호를 리페인팅하지 않습니다. 터미널을 꺼도 EA는 아무것도 잃지 않습니다. 재시작 시 오더의 매직 넘버를 기반으로 과거 시작점부터 전체 수학적 모델을 즉시 계산해 냅니다. 컴퓨터를 끌 때의 가장 큰 위험은 그리드가 수익(Take Profit)으로 마감되는 순간을 놓치는 것입니다. 따라서 VPS 서버 사용을 강력히 권장합니다.
   12. 왜 지표에 버퍼(Buffers)가 없으며 제품은 어떤 템포로 작동합니까?
   지표는 버퍼를 사용하지 않고 그래픽 객체(라인, 화살표)를 통해 신호를 출력합니다. 이를 통해 메모리에 불필요한 히스토리가 쌓이는 것을 방지하고 계산 속도를 몇 배나 끌어올립니다. 🛡 스파이크 면역: 또한 본 제품은 매 틱마다 또는 캔들 내부에서 업데이트되지 않고, 오직 H1 또는 H4 캔들의 시가(Opening price)에만 엄격하게 연동됩니다. 이는 알고리즘을 시장의 소음, 가짜 스파이크 및 휩소로부터 완벽하게 보호합니다.
   13. 브로커가 내 목표가를 보고 포지션을 청산시키기 위해 가격 스파이크를 일으키면 어떻게 합니까?
   🥷 인비저블 모드 (스텔스 모드): 인비저블 모드 덕분에 그러한 상황은 원천 차단됩니다. 로봇은 가상 오더 알고리즘을 사용합니다. 모든 실제 가격 수준과 목표가는 오직 EA의 메모리 내에만 존재하며 브로커 서버에는 완전히 숨겨집니다. 브로커는 시스템이 정확히 어디서 포지션을 청산할지 전혀 볼 수 없으므로, 여러분의 스톱 한팅(Stop hunting)은 기술적으로 불가능합니다.
   14. 오더 그리드가 너무 커지면 어떻게 됩니까?
   🚨 자본 안전장치(퓨즈): 이 경우를 대비해 자본 보호 장치인 'Risk: Enable grid depth protection' 파라미터가 마련되어 있습니다. 그리드 내 최대 오더 수를 엄격하게 제한할 수 있습니다 (예: 최대 8개). 시장이 시스템과 반대로 흘러가고 낙폭의 깊이가 이 임계값에 도달하면, 로봇은 주 예금을 최대한 보존하기 위해 자동으로 리스크를 털어내고(손절) 부하를 줄입니다.


제작자의 제품 더 보기
Golden section price action indicator - is a trend-scalping complete system with enter and exit points. Indicator is based on most powerfull price action japan patterns that are filtered by volume, volatility, market phase. Pattern is not a simple combinations of candles. Patterns must have "weight" to move market in right direction. "Weight" - is the summary of pattern's volume, the size of pattern candles according to last average volatility and ofcourse pattern must appear in correct market p
SupportResistancePeaks Indicator indicator - is the combination of dynamic support/resitance and price action pattern. As a rule support/resistance indicators uses already calculated, history levels. The most disadvantage of this method - new(incomming) levels always are not the same as were on history, in other words accuracy is not so high as expected. My indicator is looking for dynamic/live levels that are forming right now after trend lost it's power and choppy market starts. As a rule exac
Trend deviation scalper - is the manual system to scalp choppy market places. Indicator defines bull/bear trend and it's force. Inside exact trend system also defines "weak" places, when trend is ready to reverse. So as a rule, system plots a sell arrow when bull trend becomes weak and possibly reverses to bear trend. For buy arrow is opposite : arrow is plotted on bear weak trend. Such arrangement allows you to get a favorable price and stand up market noise. Loss arrows are closing by common p
Trend driver bars is the manual trading system, which defines current trend continue or it's pull-back/reverse. "Driver" bars - are price action patterns that has powerfull affect on market, defining it's near future direction. Generally, driver bars represents trend "skeleton" and often anticipates new market impulse. System plots arrows when market shows 3 pattenrs in a row(most powerfull combo-pattern), and makes fast scalping of incomming movement. Loss positions closes by common profit. Lot
Wave Impulse OmegaScalper - is the manual system for scalping. In many cases Indicator "eats" almost all possible trend wave. System defines up price wave and down price wave. Inside the exact wave - system defines true trend movement and choppy market. Indicator plots signals while market is trending, powerfull and has quiet good volatility. This is complete system with enter and exit points. Main Indicator's Features Signals are not repaint,non-late or disappear(exept cases when system recalcu
Reverse side scalper is the manual trading system, that works on choppy(anti-trend) market. As a rule markets are on 80% choppy and only 20% is trend phase. System is based on custom step Moving and RSI and reverse pattern. System defines up movement, down movement, trend / choppy phases. Indicator plots Buy signal arrow when current direction is down and phase is trend, Sell signal arrow is plotted when currently is up movement and phase is trend. As a rule it allows to "catch" local maximum/mi
Binary step clouds - is the complete trading system with enter and exit points. System is based on double smoothed exponential step moving and volume weighted simple step moving.Generally each movings define trend direction and places when trend is in active phase. Signals plots when both movings approache to active trend phase and market speed is high.  Main Indicator's Features Signals are not repaint,non-late or disappear(exept cases when system recalculates all history datas,refreshing main
Acceleration Force Meter Indicator - is a trend system that join market in trend phase and after trend pull-back. AFM indicator - is the system that watchs market phases from flat to extreme volatility and prefers to enter in market when it's active, more volatility, ignoring most flat places. This is 100% complete trading system including enter and exit points. It works well with profitable trades - maximizing take profit targets(analysis of recent market volatility, its pips range to adapt cur
ImbaTrend Runner - is the trend following manual system for forex/crypto market. It defines medium-term trends and works with it in intraday mode. System shows enter points, profit and loss targets. As a rule profit targets are 2-3 X bigger than loss targets. Indicator is AutoAdaptive and it automatically updates it's settings during trading. Indicator is sensitive to market changes, regular updates helps to stay in relevant trend. Main Indicator's Features Signals are not repaint, late or disap
Early WPR divergence - is the manual system to define trend reverse. Green histogram shows main trend, Orange one - shows "short"/local trend. System is looking for clear divergence between both trends and pick up position(plot buy/sell arrows). When main trend is up, but local trend reverses to bearish trend and get's big power - sell arrow is plotted;    When main trend is down, but local trend reverses to bullish trend and get's big power - buy arrow is plotted;  Main inputs are : mediumTrend
Bull bear pressure indicator - is the manual system which defines bull/bear market. When lines is above zero level - market is strong bullish, and when lines below zero level - market is bearish. First line represents global trend and second one are smoothed and shows local market's mood. Main inputs are : MainPeriod- main indicator's period for global trend calculation; SignalPeriod - period for   smoothed and shows local market's trend; Main Indicator's Features Signals are not repaint,non-la
ROC acceleration-deceleration is the manual system for medium-term scalping. Indicator based on custom ROC system which defines bullish/bearish market and especially  acceleration-deceleration of tendention in the market's main direction. Buy arrow is plotted during bearish market when current trend decelerates and sell  arrow is plotted during bullish market when current trend decelerates. Main Indicator's Features Signals are not repaint,non-late or disappear(exept cases when system recalculat
ASI fractals with DPO filter - is the manual trend-following system. ASI fractals are the base of every trend. System plots an arrow when fractal pattern appears on ASI indcator and DPO direction is same as incomming signal. System has several ways of usage : simply indicator, indicator with suggested arrows, arrows with single targets and arrows with common profit targets. User can simply switch indicator's modes directly from chart. Main Indicator's Features Signals are not repaint,non-late or
Trend reversal index - is the manual trading system that works with overbought , oversold levels and reversal patterns. Sell arrow is plotted when indicator is higher than overbought level and here forms reversal pattern, all pattern points  located higher than overbought level. Opposite with buy arrow : ndicator is lower than oversold level and here forms reversal pattern, all pattern points located lower than overbought level.  Main Indicator's Features Signals are not repaint, late or disapp
Demarker pullback system - is the manual trading system for choppy markets. It show 2 colored histogram.  When histogram is blue - market is quite bullish, when histogram ir orange - market is more bearish. Up arrow is plotted when histogram is in oversold zone but blue color. Down arrow is plotted when histogram is in overbought zone but orange color. These patterns shows false breakout and possible soon reverse(price is overbought but shows bearish signs and price is oversold but shows bullis
TPM cross indicator MT4
Ekaterina Saltykova
TPM Cross (trend power moving cross) - is a trend following strategy based on custom signal points. Indicator consists from main custom moving chart line and trend power line. Indicator defines up and down movements by it's trend power and custom moving direction. When current market's trend looses it's power and opposite trend starts - power trend line  crosses moving and indicator plots an arrow.  Main indicator's adjustable inputs : movingPeriod - period of moving line  trendPeriod  - period
Impulse fractals indicator - is counter-trend oriented complex market fractal pattern.  Market creates bull/bear impulse, trend starts, fractals on impulsed wave are an agressive pullback signals. Buy arrow is plotted when market is bearish and it's impulse showed up-side fractal, and sell arrow is plotted when market is bullish and it's impulse showed dn-side fractal. Main indicator's adjustable inputs : impulsePeriod - main period of impulse histogram  filterPeriod  - smoothes impulse accordi
Floating peaks oscillator - it the manual trading system. It's based on Stochastik/RSI type of oscillator with dynamic/floating  overbought and oversold levels. When main line is green - market is under bullish pressure, when main line is red - market is under bearish pressure. Buy arrow appears at the floating bottom and sell arrow appears at floating top. Indicator allows to reverse signal types. Main indicator's adjustable inputs : mainTrendPeriod; signalTrendPeriod; smoothedTrendPeriod; tre
Trend speed vector - is the oscillator for manual trading. System measures trend direction and it's speed. Histogram shows 4 colors: Lime --> Strong up movement with good gain speed; Green --> Up movement with low gain speed Red --> Strong down movement with good gain speed; Orange --> Down movement with low gain speed Green and Orange histograms show weak market's movements and thуese places excluded from signal points. Buy arrow is plotted during strong down movement when bearish gain speed i
Floating gain meter MT4
Ekaterina Saltykova
Floating gain meter is the manual trading system that works with local trends and it's scalping. Histogram represents  bull/bear floating trend gain. Green color histogram shows choppy market with bullish pressure, Orange - shows choppy market with bearish pressure. Lime and Red colors shows "boiled" places in market. As a rule buy arrow is placed after strong Down movement when it's power becomes weak and choppy market starts. And sell arrow is plotted after strong Up movement when it's power
Pullback points indicator - is the manual trading system, that shows most popular market prices. Indicator measures bull/bear waves pressure and looks for "consensus" prices. As a rule these points are crossed up and down very often and opened trade has several chances to be closed in positive zone. Mainly, such points is the good base for "common profit" types of strategies. Indicator also represents   "common profit"  scalping method of trading as default one.  Main Indicator's Features Signa
Noize Absorption Index MT4
Ekaterina Saltykova
5 (1)
Noize Absorption Index - is the manual trading system that measures the difference of pressure between bears forces and bulls forces. Green line - is a noize free index that showing curent situation. Zero value of index shows totally choppy/flat market.Values above zero level shows how powerfull bullish wave is and values below zero measures bearish forces.Up arrow appears on bearish market when it's ready to reverse, dn arrow appears on weak bullish market, as a result of reverse expectation. S
Looking for EA to automate your trading strategy on the Forex market? TrendRocWaves Robot — your faithful companion in the world of trading! This 100% automated EA offers unique features: - works exclusively on high timeframes (H1 and H4) for confirmed response to market changes. - uses the most popular and liquid currency pairs such as EURUSD,GBPUSD with minimal spreads and fast transaction execution. - applies a scalping method based on a medium-term trend to achieve local goals and reduce r
Introducing the trading system Dynamic Trend Cycles Robot  — a powerful tool for H1-H4 trading with volatility pairs! Technical capabilities - pairs to trade : EURUSD,GBPUSD,XAUUSD;  - timeframes : M30,H1,H4; Why Choose Dynamic Trend Cycles Robot (DTC)? - Accurate Trend Analysis: DTC adapts to current market volatility, providing precise tracking of price trends. This allows you to confidently open positions in line with the main trend and maximize your profits. - Filtering False Signals: In t
Introducing to your attention an innovative expert advisor created specifically for the most juicy and volatility    currency     basket: GBPUSD and XAUUSD. This EA is designed using the main features of this market's movement, making it an ideal choice for dynamic trading on high-trending and medium-volatile pairs. The advisor is focused on minimizing trading risks, aiming to reduce losses to a minimum. Main features: EA is designed to open and close orders at the begginning of trading session
Introducing to your attention unique trading advisor, Squeeze roc xau points, exclusively designed for trading on the XAU/USD pair. We analyzed predominantly all objectively important timeframes and identified unique characteristics of gold movements relative to the dollar to create this product. These insights can be extremely useful in predicting market reversal points on timeframes from M30 to H8 for the XAU/USD pair. You can choose your favorite timeframe to receive signals or use multiple
Introducing to your attention a unique trading advisor "Detrended scalper jpy points robot", designed for trading with major JPY crosses. The idea is based on a modified indicator, detrended price oscillator, whose task is to eliminate the influence of the trend on price movements. This greatly simplifies the process of determining overbought/oversold cycles. The focus is on analyzing short cycles: long market cycles consist of several short ones. By analyzing the short components, we can more
Introducing the automated trading system "Flexi trend tracker robot" — a powerful instrument for hour+ timeframe trading with medium/soft volatility pairs! This EA offers unique features:  wide range of applications: This strategy can be used on various time intervals: H1 and H4 timeframes, making the trading advisor a highly versatile tool for trading.  the system works on comfortable USD crosses: USDCAD, USDCAD, and USDCAD pairs where you won't see overwhelming trends that wipe out deposits b
Hybrid Trend Impulse robot – is an advanced EA that combines modern approaches to trend and impulse analysis, offering unique capabilities for effective deposit management. Key advantages of the HybridTrendImpulse_robot: Nonlinear dynamics: The method of interaction between opening prices forms a unique nonlinear model that is particularly sensitive to significant price fluctuations, increasing their significance and making the indicator ideal for working in high volatility conditions. Enhanced
SynRhythmic Points Robot is an innovative trading strategy based on the combination of two analytical approaches, one focusing on short-term price changes and the other on identifying stable trends and dependencies. This synergy allows for obtaining excellent signals for entering the market while minimizing the influence of random fluctuations and reducing false signals. Additionally, the EA can easily adapt to various market conditions and be automated, making it convenient for both experienced
필터:
리뷰 없음
리뷰 답변