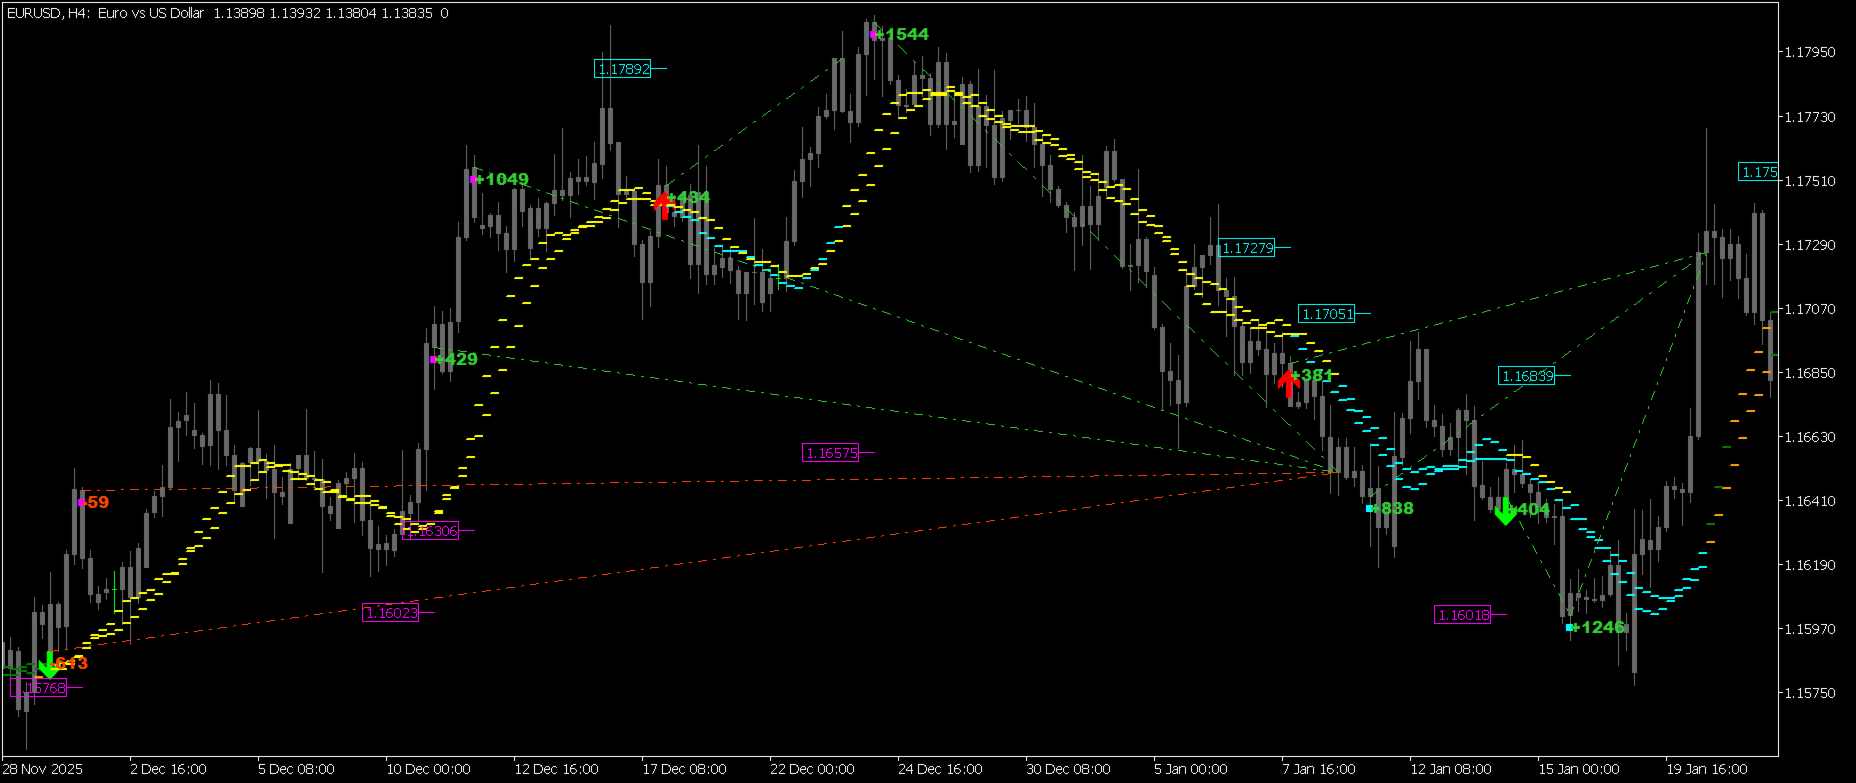
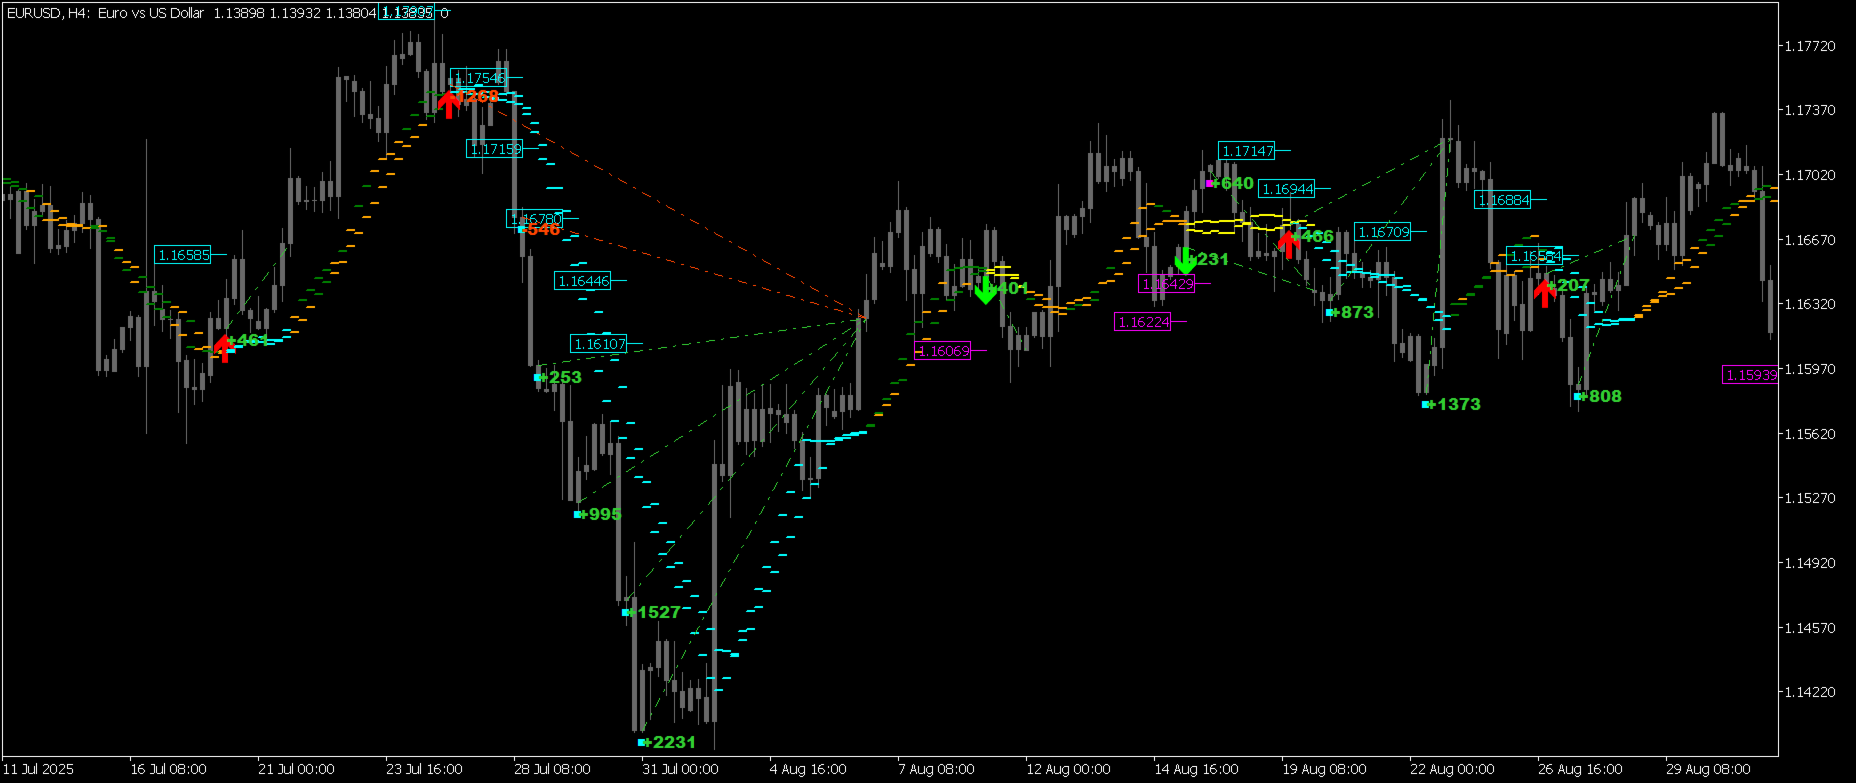
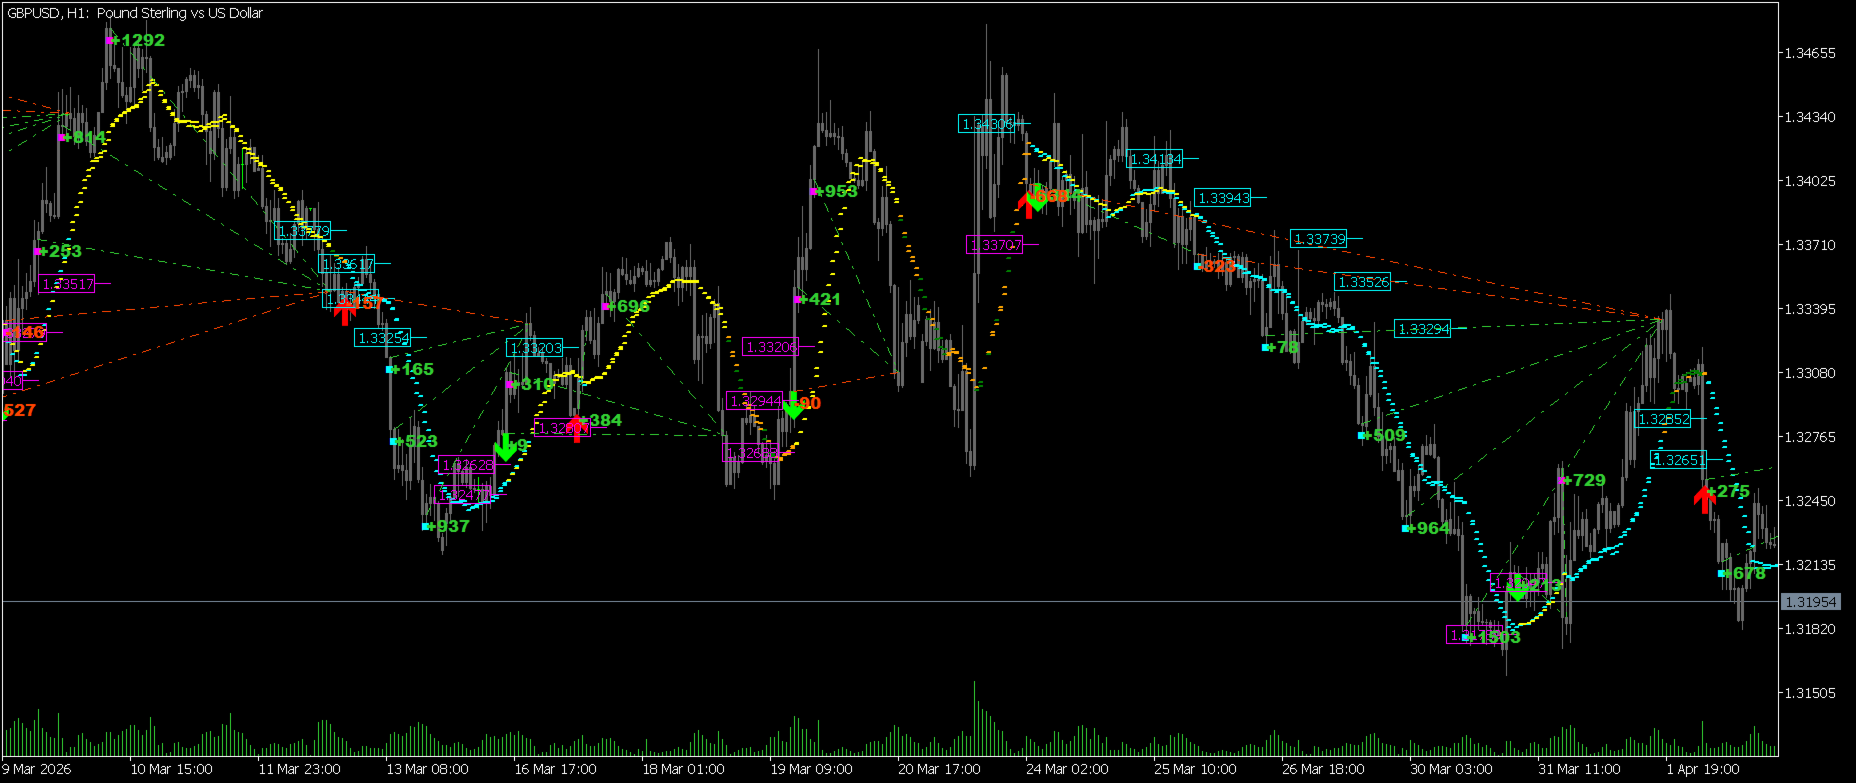
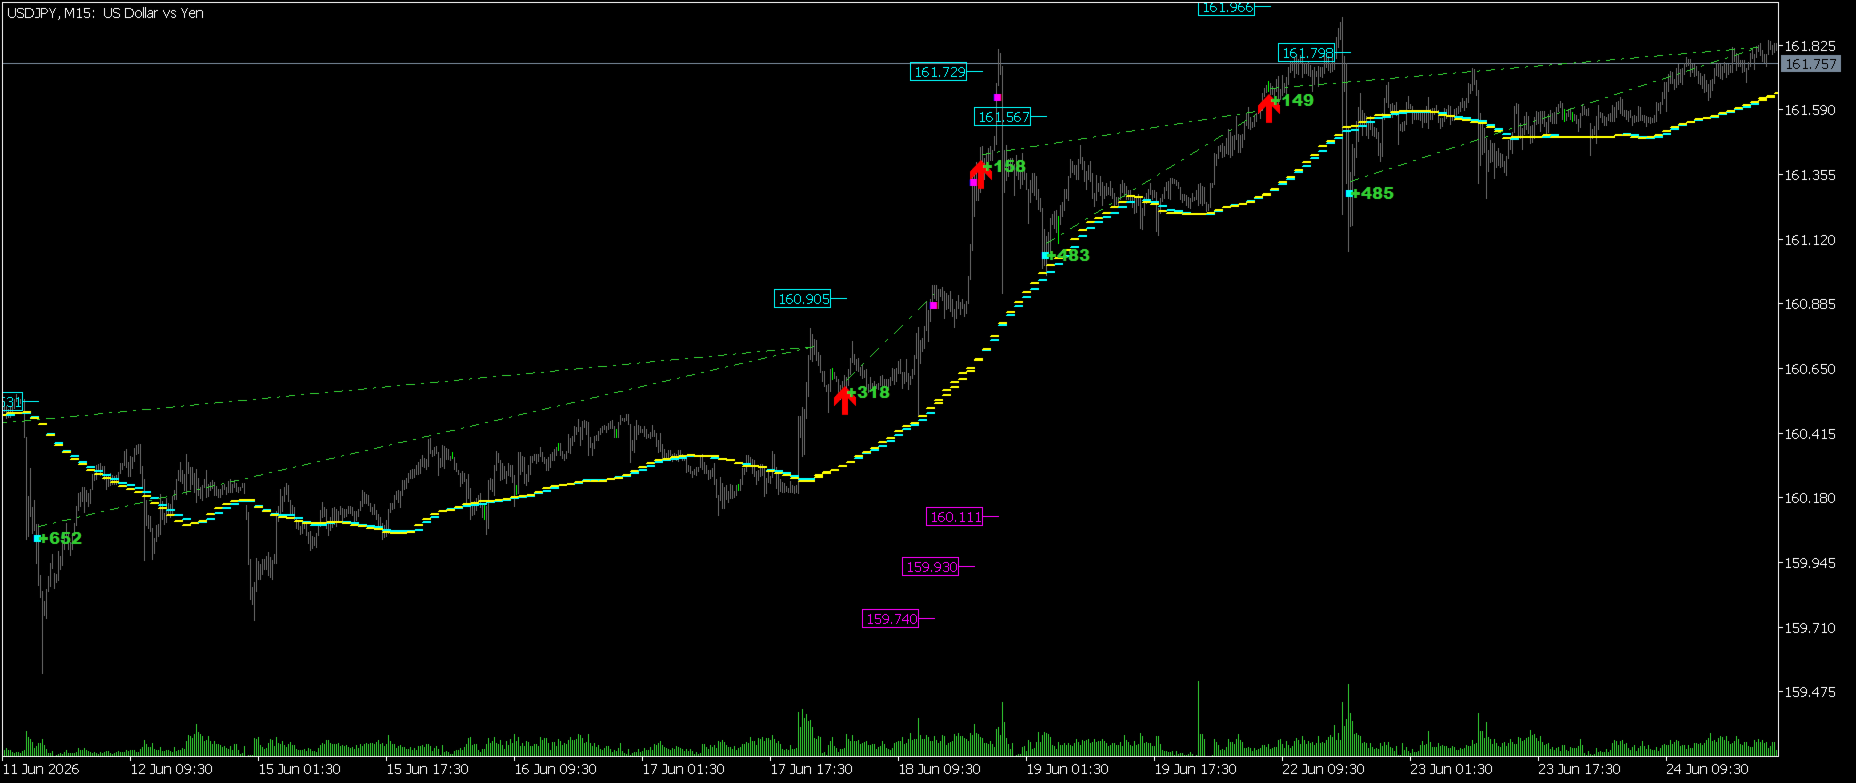
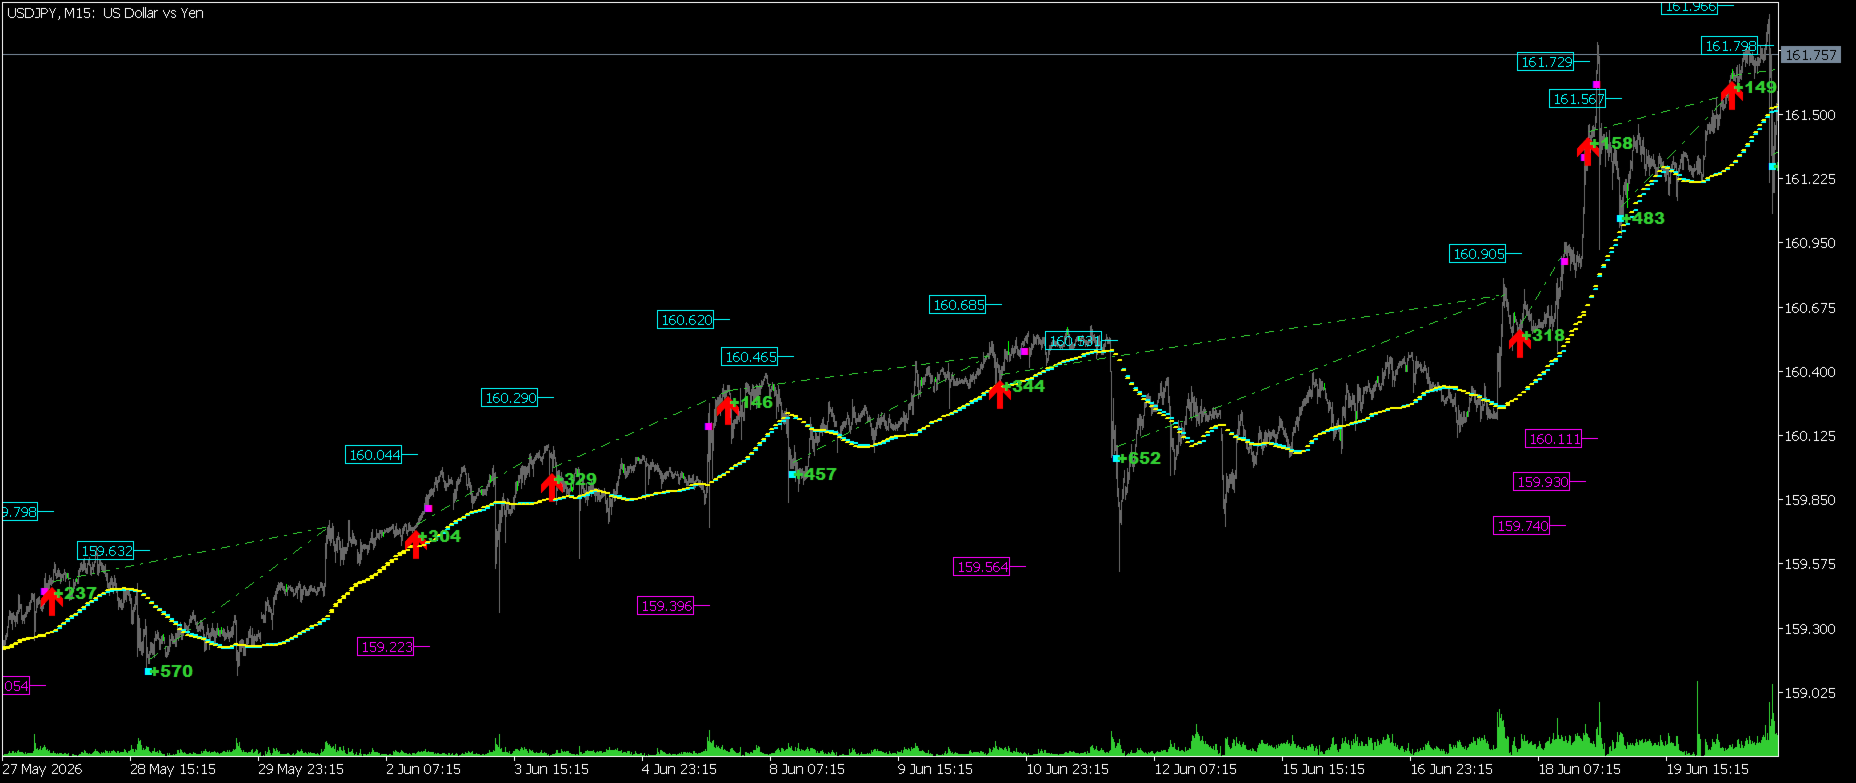
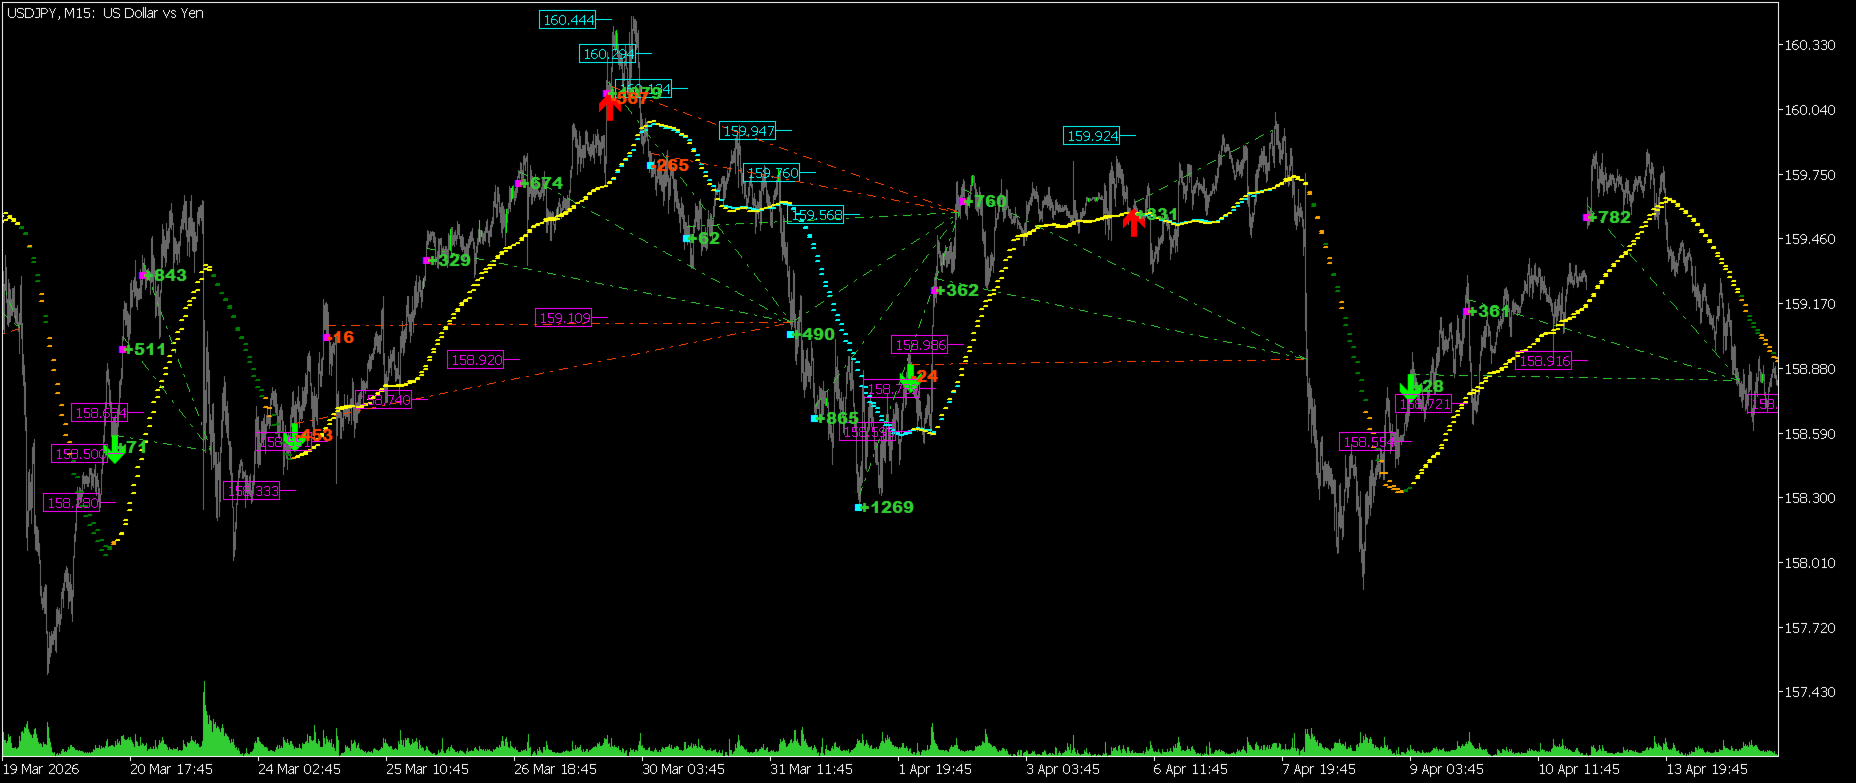
FlatOut Movings Indicator

FlatOut Movings Robot: Controllo assoluto del flat. Navigazione sicura nel trend.
Le strategie basate sulle medie mobili condividono tutte lo stesso incubo. Non appena il mercato cambia fase, il vostro capitale inizia a sciogliersi come neve al sole. Le medie mobili classiche generano decine di falsi incroci durante le fasi di lateralizzazione. Quanto ai filtri standard, accumulano un ritardo spietato. Passate le notti stressati davanti al terminale, per poi entrare proprio alla fine del movimento.
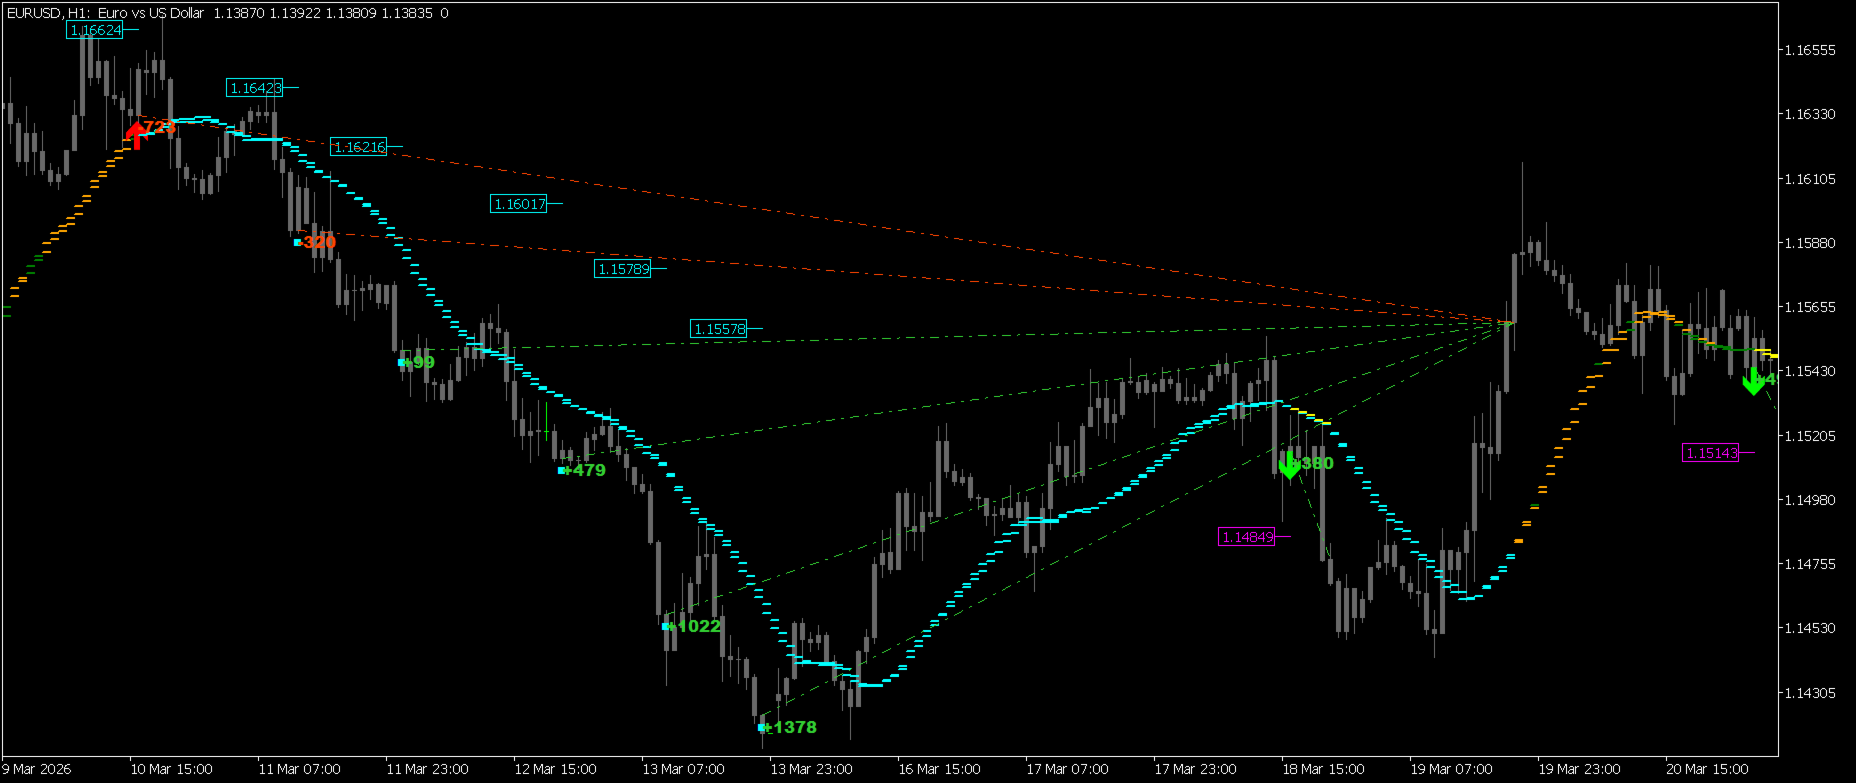
Questo software è stato creato per risolvere un problema specifico. Il robot scansiona continuamente il grafico e decifra la struttura del mercato come se conoscesse i segreti più intimi del book. Fa trading con la stessa efficacia sia in un range piatto e letargico, sia su potenti impulsi di trend. Il sistema separa con precisione chirurgica la vera rottura dal falso breakout verso il canale di trading.
⏳ Alla prova del tempo nelle epoche del caos dei mercati
Il cuore matematico del software è stato testato attraverso cicli decennali di tempeste di prezzo caotiche che si susseguono l'una all'altra. L'algoritmo è progettato per resistere a qualsiasi crisi finanziaria globale e ai cambiamenti delle ere di mercato.
⚡ Il cacciatore di impulsi: Il robot entra in posizione nel punto di non ritorno, quando il prezzo vola lungo il vettore della minor resistenza. Gli ingressi sono così millimetrici che le posizioni, di norma, non subiscono quasi nessuna pressione contraria tossica.
🤖 Il dominatore seriale: Il robot non conosce oscillazioni caotiche. Il suo comportamento è sottomesso a un rigido ordine matematico. Se cattura l'onda, genera una cascata densa e continua di operazioni chiuse. L'algoritmo si aggrappa ostinatamente al trend, costruendo una posizione vincente dopo l'altra, fino a esaurire l'impulso del mercato. Per lui, i rari stop-loss non sono una tragedia, ma solo una calibrazione del mirino.
↕️ Il doppio sfoltimento del book: Il robot lavora con la stessa efficacia sia Long che Short. Il numero di direzioni nel report è equivalente. Nessun adattamento manuale casuale dei parametri sulla storia.
⚙️ Il ferreo stratega Grid: Nei momenti di flat prolungato o di falsi breakout, non taglia la posizione alla minima perdita latente. Il robot attiva una modalità di assedio posizionale, dispiegando una griglia d'ordini elastica e distribuita. Assorbe a sangue freddo il rischio fluttuante, mantenendo la pressione del margine sotto un controllo totale.
🎯 Il cecchino a sangue freddo: Il software attende il punto d'ingresso ideale, garantendo un'eccellente efficacia matematica e un potente fattore di recupero.
🎁 Metti alla prova l'algoritmo gratuitamente
Non siete più obbligati a vivere giorno e notte in tensione davanti al monitor, bruciando nervi e tempo. Questa soluzione tecnologica è completamente pronta all'uso. Smettete di credere alle parole altrui: verificate l'algoritmo sulla storia reale.
Prendetevi subito il vostro strumento di protezione del capitale!

   1. Cliccate sul pulsante «Scarica la demo» su questa pagina del Market.
   2. Aprite il tester di strategia nel vostro terminale e selezionate un qualsiasi periodo storico.
   3. Avviate il test e constatate di persona come il sistema esclude il rumore del mercato.

------------------------------
FAQ:

   1. Per quali coppie è configurato questo prodotto?
   Questo Indicator funziona tecnicamente su qualsiasi coppia e utilizza le impostazioni predefinite. Tuttavia, è specificamente ottimizzato per lavorare su EURUSD, GBPUSD, USDJPY.
   È proprio qui che dimostra la sua massima efficacia.
   2. Su quale timeframe è meglio avviarlo?
   🦎 Il camaleonte adattivo: Per lui il timeframe è solo una lente ottica. Sui passi brevi (M15, M30, H1) agisce come un fulmineo scalper. Nei periodi superiori (H2 e H4) amplia il passo, trasformando la densità del mercato in decisioni posizionali monolitiche e filtrate. Il robot si adatta perfettamente alla densità delle candele, eliminando completamente il rumore interno alla candela del broker.
   Potete quindi avviare il prodotto su M15, M30, H1, H2, H4.
   3. Quale tipo di conto è adatto all'expert advisor?
   Sarà necessario un conto con supporto per ordini contrari (Hedging), poiché lo standard Netting è tecnicamente incompatibile con la logica del robot. La scelta migliore saranno i conti di tipo ECN/Raw (per grandi somme), Cent (per depositi fino a $10 000) o Swap-Free con una leva a partire da 1:100.
   4. Con quale deposito minimo si può iniziare a fare trading?
   Per una sola coppia servono $800-1000 su un conto standard (o $10 su un conto cent). Per due o tre coppie la somma aumenta proporzionalmente: $2K/$3K su un conto standard (o $20/$30 su un conto cent).
   5. Qual è il drawdown storico dell'expert advisor?
   Il drawdown fluttuante massimo sull'equity (Equity) nella storia degli ultimi 55 anni è stato del: 7.08% per EURUSD, 9.31% per GBPUSD e appena il 4.17% per USDJPY.
   Il drawdown relativo sul bilancio ha oscillato storicamente intorno al 2.27% – 16.95%.
   6. Si possono unire in un paniere tutte e tre le coppie di valute (con Magic Number differenti)?
   Sì, ed è una scelta sensata. L'avvio simultaneo su EURUSD, GBPUSD e USDJPY con diversi Magic Number attiva l'effetto paniere: le coppie fanno trading in modo indipendente, compensano i drawdown reciproci e creano un flusso di trading stabile e diversificato.
   7. Quali impostazioni bisogna usare all'inizio?
   📦 Autonomia totale pronta all'uso: Dimenticate la regolazione manuale dei parametri e la lettura di centinaia di pagine di istruzioni. Il prodotto è inizialmente ottimizzato per il carattere delle principali coppie di valute. Il robot scansiona automaticamente il grafico, riconosce la coppia ed entra istantaneamente in funzione. Iniziare è facile, bastano un paio di clic. Dovete solo applicare l'expert advisor al grafico della coppia raccomandata, scegliere il timeframe desiderato e impostare un Magic Number unico per la diversificazione.
   8. Come faccio a capire che l'indicator attivate il parametro Enable: Detailed operational logs nelle impostazioni e sullo schermo stesso apparirà il testo con lo stato del sistema, mentre nella scheda «Esperti» inizieranno ad aggiornarsi i log operativi (per mostrare report dettagliati ogni 1–4 ore).
   9. Perché lo schermo si blocca quando cambio timeframe?
   📸 L'istantanea quantistica del mercato: Al primo avvio, al cambio di timeframe o in caso di perdita di connessione, il terminale si bloccherà per un breve momento, eseguendo un controllo completo di tutta la storia. Il sistema si prende una pausa per escludere qualsiasi distorsione dei prezzi e dispiegare un modello matematico impeccabile per la protezione delle posizioni.
   10. Perché l'ordine NON si è aperto ma il sistema lo ha conteggiato?
   🔒 Autonomia digitale: La matematica interna del robot è superiore alla realtà del mercato. Questa è una funzione di protezione unica dell'expert advisor. Se a causa di un'interruzione di connessione o dello slippage del broker un ordine non si è aperto nella realtà, il robot lo tiene istantaneamente in considerazione in modo virtuale nella memoria del modello. Per il robot è più importante mantenere rigorosamente l'integrità del proprio modello matematico — che è il suo scudo principale contro il caos del mercato — motivo per cui il sistema accetta consapevolmente un minimo svantaggio tecnico su una singola griglia. Uno scenario del genere si verifica molto raramente, poiché il robot effettua fino a 10 tentativi per aprire l'ordine finché il prezzo oscilla vicino all'apertura della candela.
   11. L'indicatore ridipinge i suoi segnali e cosa succede se si spegne il computer?
   L'indicatore non ritarda e non ridipinge i propri segnali. Se spegnete il terminale, l'expert advisor non perderà nulla: al riavvio ricalcolerà istantaneamente l'intero modello matematico dall'inizio della storia in base al Magic Number dei vostri ordini. Il pericolo principale dello spegnimento del PC è perdere il momento di chiusura della griglia in profitto, pertanto si raccomanda caldamente l'uso di un server VPS.
   12. Perché l'indicatore non ha buffer e con quale ritmo lavora il prodotto?
   L'indicatore non usa buffer, ma mostra i segnali attraverso oggetti grafici (linee, frecce). Questo esclude il salvataggio di una storia inutile in memoria e velocizza i calcoli di molte volte. Immunità ai picchi di prezzo: in questo caso il prodotto non si aggiorna a ogni tick o all'interno della barra, ma è legato rigorosamente ai prezzi di apertura delle candele H1 o H4 — questo protegge completamente l'algoritmo dal rumore del mercato, da falsi picchi e spike.
   13. Cosa succede se il broker vede i miei obiettivi e crea un picco di prezzo per far saltare le mie posizioni?
   🥷 Modalità invisibile: Questo è escluso grazie alla modalità invisibile. Il robot utilizza un algoritmo di ordini virtuali: tutti i livelli di prezzo reali e gli obiettivi si trovano esclusivamente nella memoria dell'expert advisor e sono completamente nascosti al server del broker. La caccia ai vostri stop è tecnicamente impossibile, poiché il broker semplicemente non vede dove il sistema ha intenzione di liquidare le posizioni.
   14. Cosa succede se la griglia di ordini diventa troppo grande?
   🛡️ Il salvavita del capitale: Per questo caso è previsto un salvavita del capitale — il parametro Risk: Enable grid depth protection. Potete limitare rigidamente il numero massimo di ordini nella griglia (ad esempio, non più di 8). Se il mercato va contro il sistema e la profondità del drawdown raggiunge questa soglia critica, il robot alleggerirà automaticamente il carico, tagliando i rischi per la massima conservazione del vostro deposito principale.

Prodotti consigliati
# Indicatore Squeeze Momentum per MT5 Sfrutta le straordinarie opportunità di mercato con il potente **Indicatore Squeeze Momentum**, sviluppato professionalmente per MetaTrader 5. Questo indicatore avanzato di volatilità e momentum aiuta i trader a identificare i periodi di bassa volatilità prima che si verifichino importanti movimenti di mercato. Combinando la potenza delle Bande di Bollinger e dei Canali di Keltner, l'indicatore rivela quando il mercato si sta "comprimendo" e si sta prepar
Aurum mid quant pro
N'da Lemissa Kouame
AURUM MID-QUANT PRO v5.60 Quantitative Excellence for Gold (XAU/USD) & Volatility Trading Gain a professional edge over institutional markets with AURUM MID-QUANT PRO , an advanced Price Action Pattern Detection and Breakout Engine designed exclusively for MetaTrader 5 . Built specifically to capture the unique volatility of Gold (XAU/USD) and other major financial instruments, this powerful indicator combines high-precision algorithmic pattern recognition with real-time dynamic accumulation z
Introduction to Fractal Pattern Scanner Fractal Indicator refers to the technical indicator that makes use of the fractal geometry found in the financial market. Fractal Pattern Scanner is the advanced Fractal Indicator that brings the latest trading technology after the extensive research and development work in the fractal geometry in the financial market. The most important feature in Fractal Pattern Scanner is the ability to measure the turning point probability as well as the trend probabil
ACB Breakout Arrows Scanner MT5
KEENBASE SOFTWARE SOLUTIONS
Questo è uno scanner multi-simbolo e multi-timeframe per il nostro indicatore ACB Breakout Arrows . Con le impostazioni predefinite, analizza i segnali di acquisto/vendita su 28 coppie di valute e 9 timeframe contemporaneamente .  Caratteristiche Può analizzare 252* combinazioni di simboli e timeframe da un singolo grafico. Apre il grafico del segnale con un modello predefinito con un solo clic.  Facile da spostare ovunque sul grafico tramite drag and drop. Avvisi in tempo reale tramite popup,
MFOP Market Forecast
Oscar Josue Pin Bacuzoy
Develop this indicator for periods of 30 minutes or more, focus on getting market trends right and making sure they are met. MFOP v8.1 gets straight to the point: it scans the market and tells you exactly when there is enough strength to enter a trade. This indicator doesn't do magic, it uses mathematical algorithms to filter out market noise, not enter into false breakouts and show you clear BUY (blue arrow) and SELL (red arrow) opportunities. It is designed and optimized specifically to take
OTC Trend Radar Clean on-chart signals with an entry zone, stop-loss and profit targets, controlled from a compact panel. What you get - Buy and Sell arrows on the M1 and M5 charts - A "Buy Zone" / "Sell Zone" box for each signal - Automatic stop-loss and up to seven profit-target levels, each with its price; the lines follow price until the move ends - Follow-up arrows for additional opportunities in the direction of the trade - Direction tags above the panel showing the current M1 and M5 sta
BOLLINGER MARKET & TREND INTELLIGENCE — MT5 STOP GUESSING WHAT A BOLLINGER BREAKOUT IS TELLING YOU You've been here before. It's 2 AM. You're staring at a chart. Price has just closed outside the upper Bollinger Band. You enter. Three candles later, price is back inside the band. Then the move reverses. You tell yourself: "I should have waited for a retest." But when you wait for the retest, sometimes price continues without giving you the entry you wanted. So you add another filter. RSI. Then M
Questo indicatore è un indicatore per l'analisi automatica delle onde perfetto per il trading pratico! Caso... Nota:   non sono abituato a usare nomi occidentali per la classificazione delle onde a causa dell'influenza della convenzione di denominazione di Tang Lun (Tang Zhong Shuo Zen), ho chiamato l'onda base come   penna   e la banda dell'onda secondaria come   segmento   At allo stesso tempo, il segmento ha la direzione del trend. La denominazione   è principalmente segmento di trend   (que
CISD Levels Pro automatically draws CISD Buy and Sell levels directly on your chart. It highlights pending levels while they are forming, then marks confirmed levels after the confirmation candle closes. Optional confirmation arrows help you spot the signal quickly. This tool is designed for traders who want clean, simple CISD level visualization without extra indicators or clutter. Key Features Draws Bullish (BUY) CISD levels and Bearish (SELL) CISD levels Shows Pending levels (dashed) and
The indicator scans for TD Combo signals in multiple timeframes for the all markets filtered and shows the results on Dashboard. Key Features Dashboard can be used for all markets It can scan for signals on MN1, W1, D1, H4, H1, M30, M15 ,M5, M1 timeframes Parameters UseMarketWatch: Set true to copy all symbols available in market watch MarketWatchCount : Set the number of symbols that you want to copy from the market watch list. CustomSymbols: Enter the custom symbols that you want to be availa
Harraz Master HUD
Muhammad Azraf Bin Dzul Fauzi
HARRAZ MASTER HUD v4.4 - The Ultimate Neural Trading Command Center ​ Transform your MetaTrader 5 into a professional, institutional-grade trading terminal. Harraz Master HUD is not just an indicator; it is a complete Artificial Intelligence ecosystem designed specifically for XAUUSD (Gold) and major pairs. ​ EXCLUSIVE FEATURES: ​1. Live Neural AI Typewriter (Jarvis Mode) Experience a live, animated Heads-Up Display that types out real-time market sentiment and advice. It acts as your persona
TPO Dashboard
Hendra Pri Raditya
TPO Market Profile Levels — Plug & Play by HENDRA PRI RADITYA An on-chart Market Profile (TPO) analysis tool that highlights the most relevant price levels of the current Daily, Weekly and Monthly periods, together with a compact dashboard summarising the current market structure. WHAT IT SHOWS - POC (Point of Control) for the Daily, Weekly and Monthly period. - VAH and VAL (Value Area High / Low) for each period. - A naked POC marker, so a POC that has not yet been revisited stays visible. - Pe
Xtrade Trend Detector
Dago Elkana Samuel Dadie
Xtrade Trend Detector is an indicator capable of finding the best opportunities to take a position in any stock market. Indeed, it is a great tool for scalpers but also for Daytraders. You could therefore use it to identify areas to trade, it fits easily on a chart. I use it to detect trends on Big timeframes and take positions on Small timeframes. Don't hesitate to give me a feedback if you test it.
Weiswave indicator
Mudasser Aslam Mughal
Weis Wave by Mudasser turns raw tick or real volume into clear up and down waves — so you can read effort vs. result at a glance. Instead of looking at single-bar volume, this indicator stacks volume for as long as price keeps moving in the same direction. When the close flips, a new wave begins. The result is a clean histogram of blue (bullish) and red (bearish) volume waves that make climax, effort, and absorption easy to spot. WHAT YOU GET • Cumulative volume waves based on close direction
Indicatore Crypto_Forex "Istogramma di TREND" per MT5, senza ridisegno. - L'indicatore Istogramma di TREND è molto più sensibile ed efficiente di qualsiasi incrocio di medie mobili standard. - L'indicatore può essere di 2 colori: giallo (oro) per trend ribassista e verde per trend rialzista (i colori possono essere modificati nelle impostazioni). - L'Istogramma di TREND ha avvisi integrati per dispositivi mobili e PC. - È un'ottima idea combinare questo indicatore con altri metodi di trading: P
Rejection Zone Predictor PRO – MT5 Indicator Identify where price is most likely to react before it gets there. Rejection Zone Predictor PRO is a price-action based MetaTrader 5 indicator designed to automatically locate and rank potential BUY rejection/support zones below the current market price and SELL rejection/resistance zones above price . Instead of relying on a single support or resistance calculation, the indicator analyzes multiple forms of price-action confluence to determine which h
Link to our best products: LINK Link to our Trading Dashboard: LINK !!!!!!! Attention, you can find premium discounts by clicking on arrows!!!!!! Setting of this indicator candles mode: Show zones from the beginning Swing number for highs and lows Show background color Color of Premium Color of Discount show level 0% line show level 25% line show level 50% line show level 75% line show level 100% line The Premium and Discount concept is a core principle of Smart Money Concepts (SMC) used to i
Smart Reversal Prophets
Loys Steve Dzene Tagne
Avez-vous toujours rêvé de pouvoir entrer sur le marché juste après la clôture d'une bougie… et de voir le marché évoluer immédiatement dans votre sens ? Avez-vous toujours souhaité détecter les retournements de tendance plus tôt, éviter les faux signaux et, surtout, saisir les tendances longues avant la majorité des traders ? Aujourd'hui, je vais vous présenter mon nouvel indicateur : Prophète du retournement intelligent. Contrairement aux indicateurs traditionnels qui réagissent avec un certa
L'indicatore aiuta ad entrare in un trade seguendo il trend, allo stesso tempo, dopo alcune correzioni. Trova forti movimenti di tendenza di una coppia di valute su un determinato numero di barre e trova anche livelli di correzione per questa tendenza. Se la tendenza è abbastanza forte e la correzione diventa uguale a quella specificata nei parametri, l'indicatore lo segnala. È possibile impostare diversi valori di correzione, i valori di 38, 50 e 62 (livelli di Fibonacci) sono più adatti. Inol
Sigma VWAP Bands Sigma VWAP Bands (Rolling) is a technical analysis indicator that plots upper and lower bands based on the statistical deviation of price from a rolling Volume-Weighted Average Price (VWAP). The indicator is designed to visualize price dispersion around VWAP using a user-defined lookback window and a configurable standard deviation multiplier. Parameters Lookback Period Number of bars used for VWAP and standard deviation calculations. Sigma Factor Multiplier applied to the cal
Relative Volume (RVOL) Indicator See When Volume Really Matters Not all volume is equal. The Relative Volume (RVOL) Indicator helps you quickly identify when the market is experiencing unusually high trading activity compared with its recent average. Instead of simply showing how much volume is trading, RVOL puts current volume into context—making it easier to spot moments when buyers or sellers may be becoming more active. Key Features Identify High-Volume Bullish Moves Quickly spot candles
TPSproTREND PrO MT5
Roman Podpora
4.55 (20)
TPSproTrend PRO   - Questo è un indicatore di tendenza che analizza automaticamente il mercato e fornisce informazioni sulla tendenza e sui suoi cambiamenti, oltre a visualizzare i punti di ingresso per le operazioni di trading.   senza ridisegnare!       Nuova versione   Trend Lines PRO   — Algoritmo di rilevamento del punto di ingresso migliorato, filtraggio del segnale aggiuntivo e visualizzazione aggiornata. ISTRUZIONI RUS       -   ISTRUZIONI       ENG         -   VERSIONE MT4 Principali v
Apex Institutional Reversal
Sami Eid Fahid Almashaqbeh
Apex Institutional Reversal is an advanced Smart Money Concepts (SMC) and ICT trading framework designed to identify high-probability market reversals, continuation phases, and institutional exhaustion zones before they become obvious to retail traders. This is not another lagging oscillator or generic overbought/oversold tool. Apex Institutional Reversal acts as a market regime intelligence system that combines statistical trend analysis, fractal market behavior, and institutional momentum dia
. . is designed for traders who want a clean and practical way to identify bullish and bearish trend changes directly on the MT5 chart. The indicator uses a dual high/low smoothing engine to detect market direction and show a clear active trend line. When the market confirms a bullish or bearish flip
Trading concept: When price touches or exceeds the upper circle boundary = potential sell signal (overbought) When price touches or falls below the lower circle boundary = potential buy signal (oversold) The circle acts like a dynamic support/resistance band around the opening price The numbered points (1-24) help identify where in the cycle the price currently is This is similar to using Bollinger Bands or other envelope indicators, but with a fixed radius instead of standard deviations.
the fundamental technical indicator Informative Trend, which allows you to assess the current market situation in order to enter the market of the selected currency pair in a trend and with minimal risk. It basically uses the process of identifying the rate of change in price growth and allows you to find entry and exit points from the market. The indicator was created on the basis of the original indicators for searching for extreme points and is well suited for determining a reversal or a la
First time on MetaTrader, introducing IQ Star Lines, an original Vedic Astrology Based Intraday Trading Indicator. We don't offer free or bonus indicators in exchange of reviews from you. You won't need any free products with this indicator to make it work. ;) Enjoy! Welcome to the new and updated  IQ Star Lines , the ultimate fusion of ancient planetary cycles and modern quantitative trading, published for the first time on Metatrader. This is an indicator built by the developer, who has spent
This indicator is based on a mathematical formula which gives you the possibility to seek and find the right frequency of the movement, and to determine its key level; just adjust the frequency parameter! Simple and highly effective; using this indicator you can easily predict the next support and  resistance    levels of the day. Also, this indicator determines the range and the next two importants levels of the movement outside this range so far. SGFL3 and RGFL3  are levels with high certainty
The  OBV MTF  is an Enterprise-grade On-Balance Volume indicator that transforms standard OBV into a complete trading system. It combines gradient-aware momentum analysis, divergence detection, multi-timeframe alignment, and dynamic customisable midpoint-filtering in a single intuitive professional volume analysis tool. Core Features 1. 5-State Momentum Engine Aqua (Strong Bullish) : OBV slope rising with positive acceleration SteelBlue (Weak Bullish) : OBV rising but losing momentum Gray (Neutr
Gli utenti di questo prodotto hanno anche acquistato
Boba Analysis Suite
Trade Ready Solutions LLC
5 (2)
Boba Analysis Suite Boba Analysis Suite è un indicatore di analisi per MetaTrader 5. Riunisce la struttura del mercato, le zone di prezzo rilevanti e il contesto generale del mercato in un’unica visualizzazione del grafico. Sviluppato sulla base dell’esperienza pratica come trader e formatore di trading, supporta un processo di analisi strutturato: valutare la direzione del mercato, individuare livelli importanti e analizzare congiuntamente più intervalli temporali. Analisi nel contesto del merc
SQN Max indicator for MT5 by ITC
Renaud Herve Francois Candel
Sqn Max Indicator Sqn Max is an exclusive indicator to trade the market with high effectiveness. The indicator is based on price action, volatility and trend. This indicator is as simple as possible but not too simple. The indicator can generate alerts to ease the trading process. You don't have to stay all day in front of your screen. The indicator can be used with any class of assets and with any time frame. It is possible to achieve better results trading our list of selected assets. We achi
Azimuth Pro
Ottaviano De Cicco
5 (7)
Azimuth Pro V2: Synthetic Fractal Structure and Confirmed Entries for MT5 Overview Azimuth Pro is a multi-level swing structure indicator by Merkava Labs . Four nested swing layers, swing-anchored VWAP, ABC pattern detection, three-timeframe structural filtering, and closed-bar confirmed entries — one chart, one workflow from micro-swings to macro-cycles. This is not a blind signal product. It is a structure-first workflow for traders who care about location, context, and timing. Halloween P
Neuro Poseidon MT5
Daria Rezueva
4.68 (53)
Neuro Poseidon is a new indicator by Daria Rezueva. It combines precise trading signals with adaptive TP/SL levels - creating best possible trades as a result! Message me and get  Neuro Poseidon Assistant  as a gift to automize your trading process! What makes it stand out? 1. Proven profitability on all assets and timeframes 2. Only confirmed BUY and SELL signals present on the chart 3. Adaptive TP & SL levels generated by the software for each trade 4. Easy to understand - suitable for al
ARICoins
Temirlan Kdyrkhan
ARICoin is a powerful trading companion designed to generate high-probability entry signals with dynamic TP/SL/DP levels based on volatility. Built-in performance tracking shows win/loss stats, PP1/PP2 hits, and success rates all updated live. Key Features: Buy/Sell signals with adaptive volatility bands Real-time TP/SL/DP levels based on ATR Built-in MA Filter with optional ATR/StdDev volatility Performance stats panel (Success, Profit/Loss, PP1/PP2) Alerts via popup, sound, push, or email Cust
Naked Forex Kangaroo Tail Pro Indicator Kangaroo Tail Pro Indicator is a pattern recognition indicator for Forex, Stocks, Indices, Futures, Commodities and Cryptos. The Kangaroo Tail is a multi-bar pattern. The Kangaroo Tail pattern is very effective and is very simple to trade. The strategy that comes with the Kangaroo Tail is based on price action. The indicator does what it was designed for: displaying Kangaroo Tail patterns.     Don't expect to follow the up and down arrows and make mone
AriFocus
Temirlan Kdyrkhan
AriFocus - Non-Repainting Buy/Sell Signals AriFocus - one clear signal. AriFocus marks buy and sell signals directly on the chart and suggests a stop-loss level for each one. Every signal is confirmed on bar close and never repaints. - Buy/sell arrows, confirmed on bar close - Suggested stop-loss level for every signal - Trend band and candle coloring to show direction at a glance - 10 ready-made presets, or your own settings (14 calculation methods) - Pop-up, push and email alerts with entr
ScalpPoint
Temirlan Kdyrkhan
ScalpPoint is a powerful trading companion designed to generate high-probability entry signals with dynamic TP/SL/DP levels based on volatility. Built-in performance tracking shows win/loss stats, PP1/PP2 hits, and success rates — all updated live. Key Features: Buy/Sell signals with adaptive volatility bands Real-time TP/SL/DP levels based on ATR Built-in MA Filter with optional ATR/StdDev volatility Performance stats panel (Success, Profit/Loss, PP1/PP2) Alerts via popup, sound, push, or emai
ARIPoint
Temirlan Kdyrkhan
1 (4)
ARIPoint is a powerful trading companion designed to generate high-probability entry signals with dynamic TP/SL/DP levels based on volatility. Built-in performance tracking shows win/loss stats, PP1/PP2 hits, and success rates all updated live. Key Features: Buy/Sell signals with adaptive volatility bands Real-time TP/SL/DP levels based on ATR Built-in MA Filter with optional ATR/StdDev volatility Performance stats panel (Success, Profit/Loss, PP1/PP2) Alerts via popup, sound, push, or email Cu
Zain Gold Scalping
Ahmed Gamal Abdel Nasser Mohamed
Uno strumento completo di analisi della price action basato su una doppia logica di ingresso indipendente – ciascuna confermata da una banda di volatilità – e integrato da un set configurabile di nove filtri di conferma opzionali, che consentono di modulare con precisione il comportamento dei segnali, rendendoli più conservativi o più aggressivi. Strategia Fondamentale Due configurazioni di ingresso indipendenti, ciascuna delle quali si attiva solo quando il prezzo esce da una banda di volatil
Orderflow Big Trade Svela la pressione nascosta nelle candele con le mappe di calore del Delta stimato Ti stai perdendo l'attività critica che si svolge all'interno delle candele standard? Orderflow Big Trade utilizza avanzati algoritmi di ponderazione basati sul range e sul prezzo di chiusura per stimare la pressione di acquisto e vendita su livelli di prezzo raggruppati. Invece di affidarsi solo al volume grezzo, trasforma le dinamiche della Price Action in una chiara mappa visiva del Delta
OrderFlow Absorption – Indicatore professionale di Delta e Segnali di Assorbimento per MT5 Sblocca la potenza della vera analisi del flusso degli ordini con OrderFlow Absorption – l’indicatore definitivo di istogramma delta e segnali di assorbimento per MetaTrader 5. Progettato per i trader che vogliono vedere cosa succede davvero dietro ogni movimento di prezzo, questo strumento rivela la pressione nascosta di acquisto/vendita e gli eventi di assorbimento che muovono il mercato. Caratteristiche
CGE Trading Suite
Carl Gustav Johan Ekstrom
5 (3)
Institutional-Grade Analytics for MT5 The full analytical edge of a professional trading desk, built into your MT5 chart. A full guided tour walks you through every feature step by step. Standard retail platforms lack the depth required for professional market analysis. The CGE Trading Suite bridges this gap, transforming MetaTrader 5 into a comprehensive workspace. By integrating 18 proprietary modules into a single, unified chart interface, the suite eliminates fragmented analysis. It provide
Matreshka
Dimitr Trifonov
5 (2)
Matreshka self-testing and self-optimizing indicator: 1. Is an interpretation of the Elliott Wave Analysis Theory. 2. Based on the principle of the indicator type ZigZag, and the waves are based on the principle of interpretation of the theory of DeMark. 3. Filters waves in length and height. 4. Draws up to six levels of ZigZag at the same time, tracking waves of different orders. 5. Marks Pulsed and Recoil Waves. 6. Draws arrows to open positions 7. Draws three channels. 8. Notes support and re
Trend Master V2
Oratile Pitsoane
What Is Trend Master Pro? Trend Master Pro   is a professional-grade trend trading indicator built for MetaTrader 5. It was designed with one goal in mind — to keep you on the right side of the market at all times by combining three powerful technical tools into a single, clean, easy-to-read display directly on your price chart. Instead of cluttering your screen with multiple separate indicators, Trend Master Pro fuses an   EMA Ribbon trend filter , a   ZigZag swing point engine , and a   breako
Gem SIGNAL
Shengzu Zhong
5 (1)
GEM Signal Pro GEM Signal Pro è un indicatore trend-following per MetaTrader 5, progettato per i trader che desiderano segnali più chiari, configurazioni operative più strutturate e una gestione del rischio più pratica direttamente sul grafico. Invece di mostrare solo una semplice freccia, GEM Signal Pro aiuta a presentare l’intera idea di trading in modo più chiaro e leggibile. Quando le condizioni sono confermate, l’indicatore può mostrare sul grafico il prezzo di ingresso, lo stop loss e gli
VTrende Pro
Andrii Diachenko
5 (1)
VTrende Pro - MTF indicator for trend trading with a display panel for MT5 *** Videos can be translated into any language using subtitles (video language - Russian) Although the signals of the VTrende Pro indicator can be used as signals of a full-fledged trading system, it is recommended to use them in conjunction with the Bill Williams TS. VTrende Pro is an extended version of the VTrende indicator. Difference between Pro version and VTrende: - Time zones - Signal V - signal 1-2 waves -    S
QNC Scalper
Yordiana Enggelina Seko
Here is a professional and engaging description for the Indikator QNC Scalper tool in English, tailored for traders and platforms: Indikator QNC Scalper Unlock precision trading in fast-paced markets with the Indikator QNC Scalper —an advanced technical analysis tool engineered specifically for scalpers and day traders. Whether you are trading forex, crypto, or indices, this indicator cuts through market noise to deliver clear, high-probability entry and exit signals. Key Features Real-Time M
Ace Trend
Mikhail Sergeev
5 (3)
Ti presentiamo un indicatore rivoluzionario che cambia le regole del gioco nel mondo del trading di tendenza. L'indicatore è progettato per ripensare le prestazioni e portare la tua esperienza di trading a livelli senza precedenti. Il nostro indicatore vanta una combinazione unica di funzionalità all'avanguardia che lo distinguono dalla concorrenza. La tecnologia avanzata "Real Pricing Factors" offre una sostenibilità senza pari anche nelle condizioni di mercato più difficili e volatili. Dì addi
RelicusRoad Pro MT5
Relicus LLC
4.96 (25)
Basta andare a intuito nei tuoi trade. Sai quando entrare, dove uscire e da che parte va il mercato, tutto su un solo grafico. RelicusRoad Pro riunisce quasi venti strumenti in un unico indicatore, e attivi quelli che si adattano al tuo modo di operare. Ingressi chiari. Uscite chiare. Un piano su ogni grafico. Ti suona familiare? Compri, e un minuto dopo il prezzo ti va contro. Chiudi troppo presto, poi guardi il movimento proseguire senza di te. Cinque indicatori sul grafico, cinque risposte di
TrendMaestro5
Stefano Frisetti
Attenzione alle truffe, questo indicatore e' distribuito esclusivamente su MQL5.com nota: questo indicatore e' per METATRADER5, se vuoi la versione per  METATRADER4 questo e' il link:   https://www.mql5.com/it/market/product/108106 TRENDMAESTRO ver 2.5 TRENDMAESTRO   riconosce un nuovo TREND sul nascere, non sbaglia mai. La sicurezza di identificare un nuovo TREND non ha prezzo. DESCRIZIONE TRENDMAESTRO identifica un nuovo TREND sul nascere, questo indicatore prende in esame la volatilita' i
Ciao a tutti i trader! Molti investitori individuali utilizzano script web lenti. Un approccio sistematico è essenziale per un trading redditizio. L'indicatore Astro AI non è semplicemente una visualizzazione su un grafico. Si tratta di una sofisticata rete neurale composta da due agenti che operano direttamente all'interno del terminale. Dettagli tecnici del sistema: 1. Agente 1: Analista (Rete neurale grafica – GNN) Il mercato non è costituito da singole barre di prezzo, ma da una rete di
Have you ever wondered why most systems are not effective in live trading? My answer is that it's all the fault of the so-called "Smart Money" or the institutional ones,, they constantly create spikes first up then down and vice versa to screw all the retail investors by tearing away their capital, confusing them and making the markets move randomly without any rules. But in all this there is a famous strategy, which in 2009 won the world championship, exploiting and rowing against the instituti
OmniSync Projection
Antonio-alin Teculescu
5 (1)
Chronos Fractal Engine is an innovative price projection indicator for MetaTrader 5, designed to transform your technical analysis by intelligently identifying and projecting historical price patterns. Built upon an advanced correlation algorithm and the fractal principles of the market, this powerful tool visualizes potential future price movements, giving you a unique edge in your trading decisions. What is Chronos Fractal Engine? At its core, the Chronos Fractal Engine employs a sophisticat
Title:FX-AIEA Supply and Demand Zone Indicator (MT5) — Technical Overview Version: 2.51 | Platform: MetaTrader 5 Introduction Supply and demand zones are considered a core manifestation of institutional order flow, providing a more direct reflection of buying and selling pressure than traditional support/resistance levels. This indicator attempts to automate the identification of high-probability supply and demand zones using an adaptive ZigZag algorithm, reducing the subjectivity and time asso
ORB Seeker MT5
Marcela Goncalves De Oliveira
Prezzo speciale per limitare la disponibilità e mantenere l'interesse per il prodotto! Solo $599! Dopo l'acquisto, contattami per ricevere in omaggio l'EA ORB Seeker e i file di configurazione personalizzati e ottimizzati. Individua con sicurezza le eruzioni cutanee durante le sessioni di allenamento! ORB Seeker MT5 è un indicatore ORB (Opening Range Breakout) professionale, pensato per i trader che desiderano precisione, semplicità, flessibilità e una struttura grafica chiara. Traccia automat
Zain Gold ScalpingV5
Ahmed Gamal Abdel Nasser Mohamed
Zain Gold Scalping V5 is a technical analysis indicator for MetaTrader 5 designed for Forex and Gold markets. It provides chart-based market information, trend analysis, signal conditions, and an on-screen dashboard to help traders analyze price movement across multiple timeframes. Main Features The indicator supports multiple timeframes, including M1, M5, M15, M30, H1 and higher timeframes. It can be used with Gold (XAUUSD), Forex currency pairs, indices and other supported instruments. The in
IQ FX Gann Levels a precision trading indicator based on W.D. Gann’s square root methods . It plots real-time, non-repainting support and resistance levels to help traders confidently spot intraday and scalping opportunities with high accuracy. William Delbert Gann (W.D. Gann) was an exceptional market analyst, whose trading technique was based on a complex blend of mathematics, geometry, astrology, and ancient mathematics which proved to be extremely accurate. We don't offer free or bonus indic
—— 进入本指标前,请谨记:『 不易,变易 』。拔开数理统计的枝叶,变化是不变的定理才是本指标的由来和内涵思想。本指标只应指明变化到不变之间的契机。 本指标——阴阳线指标(YiiYnn)由一条粗蓝色实线和一条细烟绿色虚线构成,粗实线叫阳线(Ynn),作为主线,细虚线叫阴线(Yii),作为辅线。本指标不同DeMarks去搜索哪个周期的最高最低,也不同Stoch那样告诉你超买超卖超过后缩小再等超买超卖直至资金的尽头。本指标是分析价格减速动态均值线的(偏)相关性及自相关性,并采用标准差的方法进行滤波以求趋势示意更明朗。所以,本指标有以下特性: 指标依据波浪理论,有二阶线性插值模拟组合多条均线(开收高低)构建波浪动力并分析它们各自相关性,所以将对趋势有很好的 预测性 ——与MACD、ATR等相比。它并非只让我们看到趋势的尾巴,请参考最后一张示例图; 指标采用简单的方差进行差相过滤,在兼顾计算性能的同时让盘整阶段的指示更明朗; 阳线与阴线之间是偏相关差相,具有阴消阳长相互激励、抵消的特点,因此命名; 本指标中判定的趋势与常人所称『趋势』不同,本指标中的趋势包括: 上涨、下跌和横盘 。不要忽略横盘
The indicator is designed to close positions on the market in time. For example: to take profits ahead of schedule if the price has not reached TakeProfit, and the market is turning around. The indicator analyzes the momentum, not the trend. He does not give any information about the trend. The indicator is well suited for finding divergence. The Ershov 38 Parrots indicator dynamically adjusts to the market and detects price movement impulses of medium and high amplitude. It almost does not rea

Altri dall’autore
Golden section price action indicator - is a trend-scalping complete system with enter and exit points. Indicator is based on most powerfull price action japan patterns that are filtered by volume, volatility, market phase. Pattern is not a simple combinations of candles. Patterns must have "weight" to move market in right direction. "Weight" - is the summary of pattern's volume, the size of pattern candles according to last average volatility and ofcourse pattern must appear in correct market p
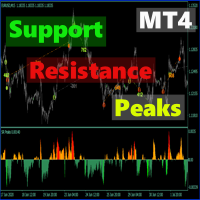
SupportResistancePeaks Indicator indicator - is the combination of dynamic support/resitance and price action pattern. As a rule support/resistance indicators uses already calculated, history levels. The most disadvantage of this method - new(incomming) levels always are not the same as were on history, in other words accuracy is not so high as expected. My indicator is looking for dynamic/live levels that are forming right now after trend lost it's power and choppy market starts. As a rule exac
Trend deviation scalper - is the manual system to scalp choppy market places. Indicator defines bull/bear trend and it's force. Inside exact trend system also defines "weak" places, when trend is ready to reverse. So as a rule, system plots a sell arrow when bull trend becomes weak and possibly reverses to bear trend. For buy arrow is opposite : arrow is plotted on bear weak trend. Such arrangement allows you to get a favorable price and stand up market noise. Loss arrows are closing by common p
Trend driver bars is the manual trading system, which defines current trend continue or it's pull-back/reverse. "Driver" bars - are price action patterns that has powerfull affect on market, defining it's near future direction. Generally, driver bars represents trend "skeleton" and often anticipates new market impulse. System plots arrows when market shows 3 pattenrs in a row(most powerfull combo-pattern), and makes fast scalping of incomming movement. Loss positions closes by common profit. Lot
Wave Impulse OmegaScalper - is the manual system for scalping. In many cases Indicator "eats" almost all possible trend wave. System defines up price wave and down price wave. Inside the exact wave - system defines true trend movement and choppy market. Indicator plots signals while market is trending, powerfull and has quiet good volatility. This is complete system with enter and exit points. Main Indicator's Features Signals are not repaint,non-late or disappear(exept cases when system recalcu
Reverse side scalper is the manual trading system, that works on choppy(anti-trend) market. As a rule markets are on 80% choppy and only 20% is trend phase. System is based on custom step Moving and RSI and reverse pattern. System defines up movement, down movement, trend / choppy phases. Indicator plots Buy signal arrow when current direction is down and phase is trend, Sell signal arrow is plotted when currently is up movement and phase is trend. As a rule it allows to "catch" local maximum/mi
Binary step clouds - is the complete trading system with enter and exit points. System is based on double smoothed exponential step moving and volume weighted simple step moving.Generally each movings define trend direction and places when trend is in active phase. Signals plots when both movings approache to active trend phase and market speed is high.  Main Indicator's Features Signals are not repaint,non-late or disappear(exept cases when system recalculates all history datas,refreshing main
Acceleration Force Meter Indicator - is a trend system that join market in trend phase and after trend pull-back. AFM indicator - is the system that watchs market phases from flat to extreme volatility and prefers to enter in market when it's active, more volatility, ignoring most flat places. This is 100% complete trading system including enter and exit points. It works well with profitable trades - maximizing take profit targets(analysis of recent market volatility, its pips range to adapt cur
ImbaTrend Runner - is the trend following manual system for forex/crypto market. It defines medium-term trends and works with it in intraday mode. System shows enter points, profit and loss targets. As a rule profit targets are 2-3 X bigger than loss targets. Indicator is AutoAdaptive and it automatically updates it's settings during trading. Indicator is sensitive to market changes, regular updates helps to stay in relevant trend. Main Indicator's Features Signals are not repaint, late or disap
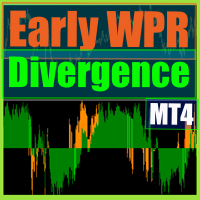
Early WPR divergence - is the manual system to define trend reverse. Green histogram shows main trend, Orange one - shows "short"/local trend. System is looking for clear divergence between both trends and pick up position(plot buy/sell arrows). When main trend is up, but local trend reverses to bearish trend and get's big power - sell arrow is plotted;    When main trend is down, but local trend reverses to bullish trend and get's big power - buy arrow is plotted;  Main inputs are : mediumTrend
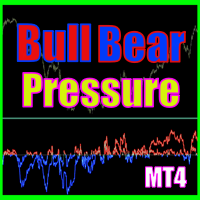
Bull bear pressure indicator - is the manual system which defines bull/bear market. When lines is above zero level - market is strong bullish, and when lines below zero level - market is bearish. First line represents global trend and second one are smoothed and shows local market's mood. Main inputs are : MainPeriod- main indicator's period for global trend calculation; SignalPeriod - period for   smoothed and shows local market's trend; Main Indicator's Features Signals are not repaint,non-la
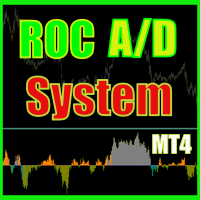
ROC acceleration-deceleration is the manual system for medium-term scalping. Indicator based on custom ROC system which defines bullish/bearish market and especially  acceleration-deceleration of tendention in the market's main direction. Buy arrow is plotted during bearish market when current trend decelerates and sell  arrow is plotted during bullish market when current trend decelerates. Main Indicator's Features Signals are not repaint,non-late or disappear(exept cases when system recalculat
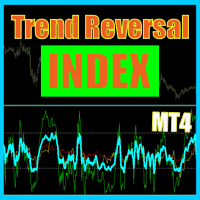
Trend reversal index - is the manual trading system that works with overbought , oversold levels and reversal patterns. Sell arrow is plotted when indicator is higher than overbought level and here forms reversal pattern, all pattern points  located higher than overbought level. Opposite with buy arrow : ndicator is lower than oversold level and here forms reversal pattern, all pattern points located lower than overbought level.  Main Indicator's Features Signals are not repaint, late or disapp
Demarker pullback system - is the manual trading system for choppy markets. It show 2 colored histogram.  When histogram is blue - market is quite bullish, when histogram ir orange - market is more bearish. Up arrow is plotted when histogram is in oversold zone but blue color. Down arrow is plotted when histogram is in overbought zone but orange color. These patterns shows false breakout and possible soon reverse(price is overbought but shows bearish signs and price is oversold but shows bullis
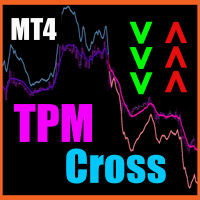
TPM Cross (trend power moving cross) - is a trend following strategy based on custom signal points. Indicator consists from main custom moving chart line and trend power line. Indicator defines up and down movements by it's trend power and custom moving direction. When current market's trend looses it's power and opposite trend starts - power trend line  crosses moving and indicator plots an arrow.  Main indicator's adjustable inputs : movingPeriod - period of moving line  trendPeriod  - period
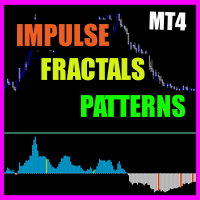
Impulse fractals indicator - is counter-trend oriented complex market fractal pattern.  Market creates bull/bear impulse, trend starts, fractals on impulsed wave are an agressive pullback signals. Buy arrow is plotted when market is bearish and it's impulse showed up-side fractal, and sell arrow is plotted when market is bullish and it's impulse showed dn-side fractal. Main indicator's adjustable inputs : impulsePeriod - main period of impulse histogram  filterPeriod  - smoothes impulse accordi
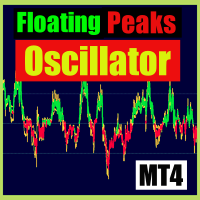
Floating peaks oscillator - it the manual trading system. It's based on Stochastik/RSI type of oscillator with dynamic/floating  overbought and oversold levels. When main line is green - market is under bullish pressure, when main line is red - market is under bearish pressure. Buy arrow appears at the floating bottom and sell arrow appears at floating top. Indicator allows to reverse signal types. Main indicator's adjustable inputs : mainTrendPeriod; signalTrendPeriod; smoothedTrendPeriod; tre
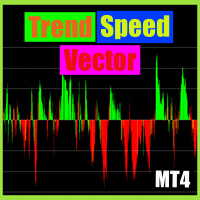
Trend speed vector - is the oscillator for manual trading. System measures trend direction and it's speed. Histogram shows 4 colors: Lime --> Strong up movement with good gain speed; Green --> Up movement with low gain speed Red --> Strong down movement with good gain speed; Orange --> Down movement with low gain speed Green and Orange histograms show weak market's movements and thуese places excluded from signal points. Buy arrow is plotted during strong down movement when bearish gain speed i
Floating gain meter is the manual trading system that works with local trends and it's scalping. Histogram represents  bull/bear floating trend gain. Green color histogram shows choppy market with bullish pressure, Orange - shows choppy market with bearish pressure. Lime and Red colors shows "boiled" places in market. As a rule buy arrow is placed after strong Down movement when it's power becomes weak and choppy market starts. And sell arrow is plotted after strong Up movement when it's power
Pullback points indicator - is the manual trading system, that shows most popular market prices. Indicator measures bull/bear waves pressure and looks for "consensus" prices. As a rule these points are crossed up and down very often and opened trade has several chances to be closed in positive zone. Mainly, such points is the good base for "common profit" types of strategies. Indicator also represents   "common profit"  scalping method of trading as default one.  Main Indicator's Features Signa
Noize Absorption Index MT4
Ekaterina Saltykova
5 (1)
Noize Absorption Index - is the manual trading system that measures the difference of pressure between bears forces and bulls forces. Green line - is a noize free index that showing curent situation. Zero value of index shows totally choppy/flat market.Values above zero level shows how powerfull bullish wave is and values below zero measures bearish forces.Up arrow appears on bearish market when it's ready to reverse, dn arrow appears on weak bullish market, as a result of reverse expectation. S
Looking for EA to automate your trading strategy on the Forex market? TrendRocWaves Robot — your faithful companion in the world of trading! This 100% automated EA offers unique features: - works exclusively on high timeframes (H1 and H4) for confirmed response to market changes. - uses the most popular and liquid currency pairs such as EURUSD,GBPUSD with minimal spreads and fast transaction execution. - applies a scalping method based on a medium-term trend to achieve local goals and reduce r
Introducing to your attention an innovative expert advisor created specifically for the most juicy and volatility    currency     basket: GBPUSD and XAUUSD. This EA is designed using the main features of this market's movement, making it an ideal choice for dynamic trading on high-trending and medium-volatile pairs. The advisor is focused on minimizing trading risks, aiming to reduce losses to a minimum. Main features: EA is designed to open and close orders at the begginning of trading session
Introducing to your attention unique trading advisor, Squeeze roc xau points, exclusively designed for trading on the XAU/USD pair. We analyzed predominantly all objectively important timeframes and identified unique characteristics of gold movements relative to the dollar to create this product. These insights can be extremely useful in predicting market reversal points on timeframes from M30 to H8 for the XAU/USD pair. You can choose your favorite timeframe to receive signals or use multiple
Introducing to your attention a unique trading advisor "Detrended scalper jpy points robot", designed for trading with major JPY crosses. The idea is based on a modified indicator, detrended price oscillator, whose task is to eliminate the influence of the trend on price movements. This greatly simplifies the process of determining overbought/oversold cycles. The focus is on analyzing short cycles: long market cycles consist of several short ones. By analyzing the short components, we can more
Hybrid Trend Impulse robot – is an advanced EA that combines modern approaches to trend and impulse analysis, offering unique capabilities for effective deposit management. Key advantages of the HybridTrendImpulse_robot: Nonlinear dynamics: The method of interaction between opening prices forms a unique nonlinear model that is particularly sensitive to significant price fluctuations, increasing their significance and making the indicator ideal for working in high volatility conditions. Enhanced
R trend sync robot mt4
Ekaterina Saltykova
r-Trend Sync Robot is an expert advisor for extra volatility markets like XAUUSD with dynamic lot size. Main EA features : The advisor's algorithm is based on the analysis of an extensive array of historical data (from 1995 for EURUSD & EURJPY and from 2004 for XAUUSD), which ensured the identification of general patterns in the behavior of these pairs across a wide range of timeframes. The analysis of historical data helped the advisor learn to recognize market triggers for medium-term trends a
At the core of the VidyaPearsonFlow Robot lies the synthesis of two key principles : a daptive filtration of market noise and statistical analysis of correlations between major Forex pairs such as EURUSD, GBPUSD, and XAUUSD. This is not merely an algorithm—it is a system that embodies the harmony of mathematical rigor and the flexibility required to operate in the ever-changing market environment. The Essence of the Method: Adaptive Filtration: The system dynamically adjusts to changing market
Adaptive Trend Metrix Adaptive Trend Metrix is an fxtool for assessing the current state of the market that adapts to changes in volatility, helping to determine the direction and strength of the trend by taking into account price dynamics. One aspect of this strategy is its ability to change and use different parameters based on price behavior. For example, it takes into account the current market volatility to adjust sensitivity to price fluctuations and identify entry and exit points. Adaptiv
The fully automated trading advisor, CovEchoTrend Robot, focuses on reliability and flexibility. By employing statistical analysis methods to study the relationships between the base indicator and market patterns, the system enables a deeper understanding of market processes. Intelligent pattern analysis: The application of statistical data processing helps identify key trend reversal points more accurately, signaling significant market shifts. Informed decision-making is based on the intersecti
Filtro:
Nessuna recensione
Rispondi alla recensione